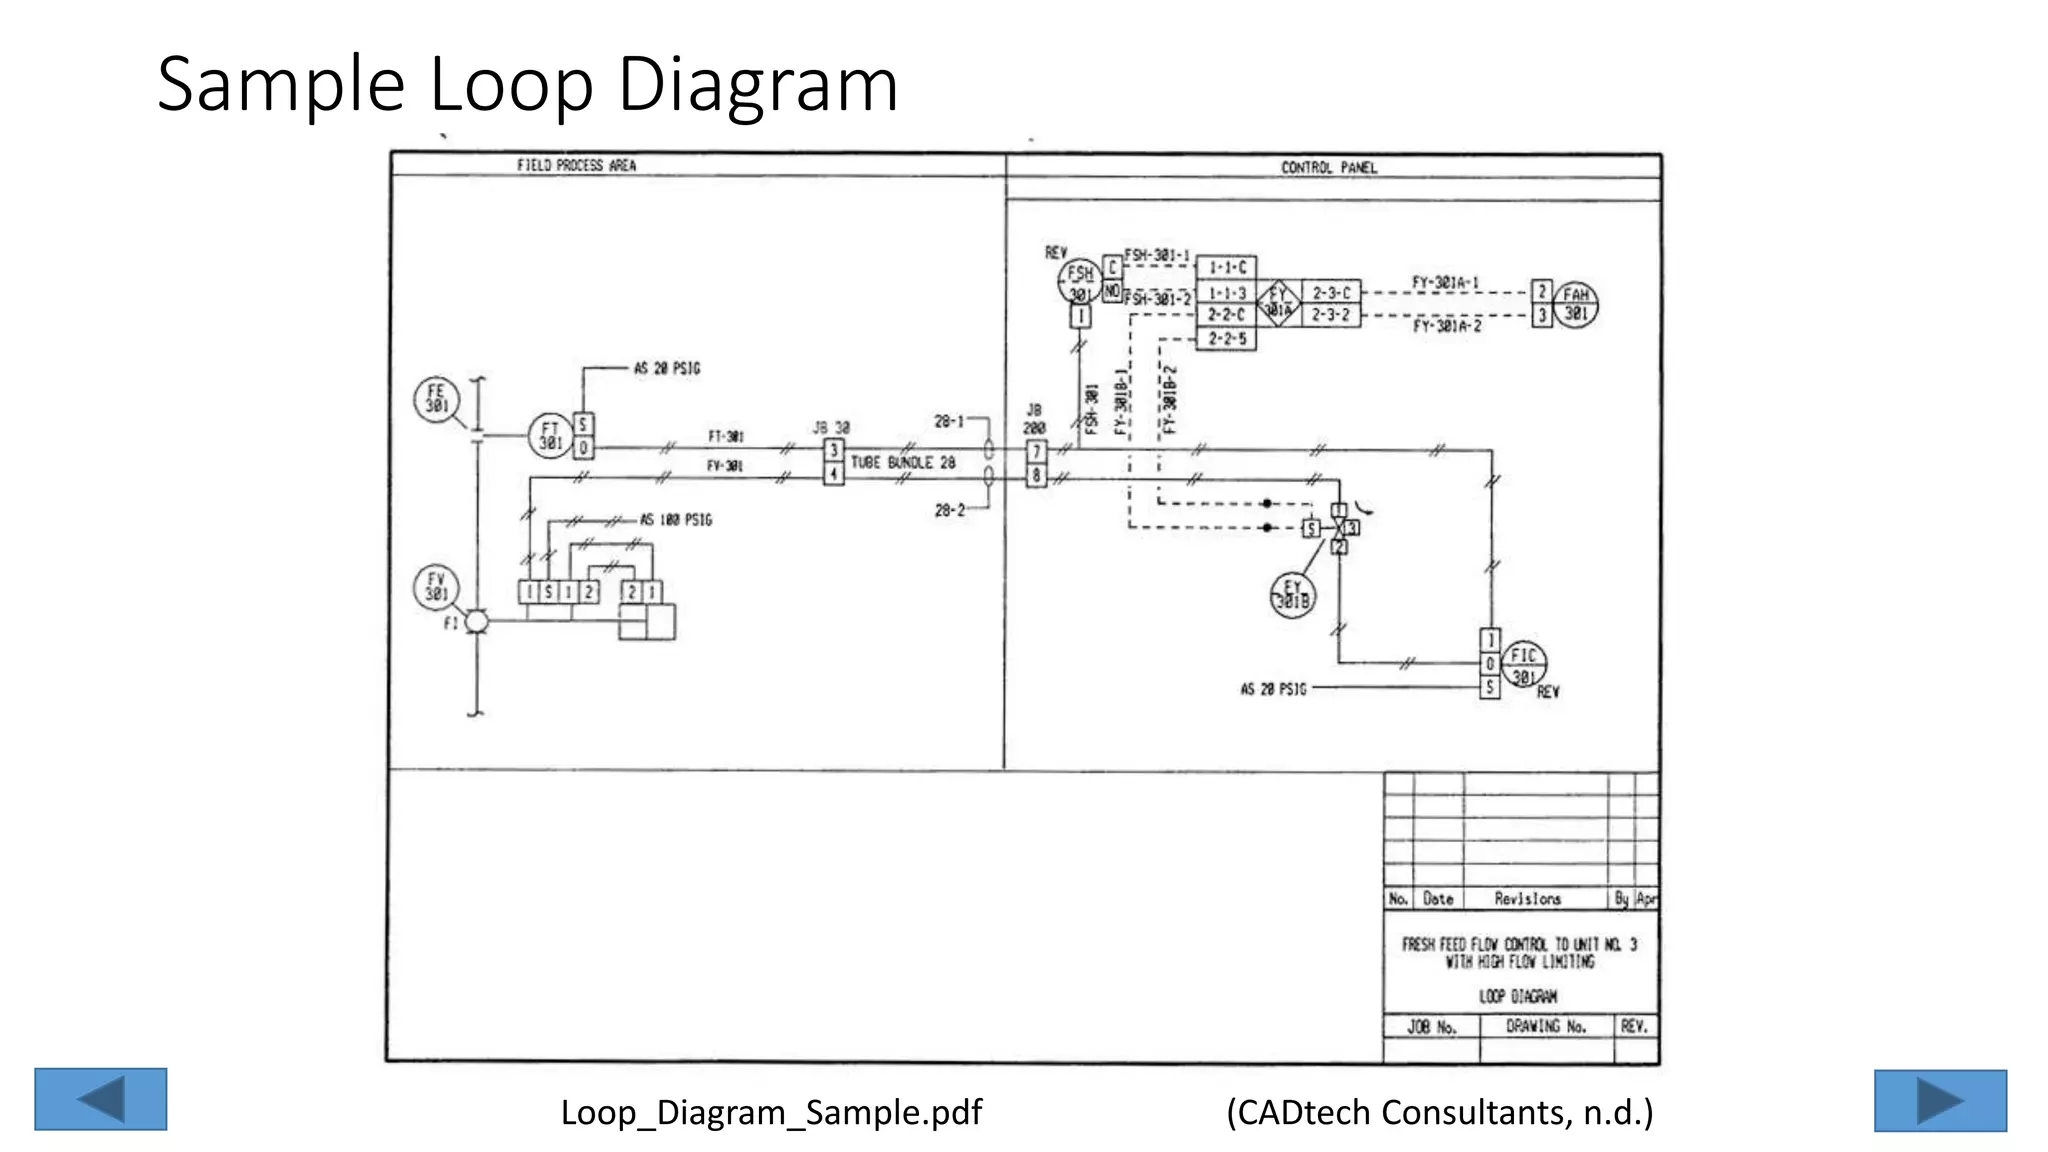
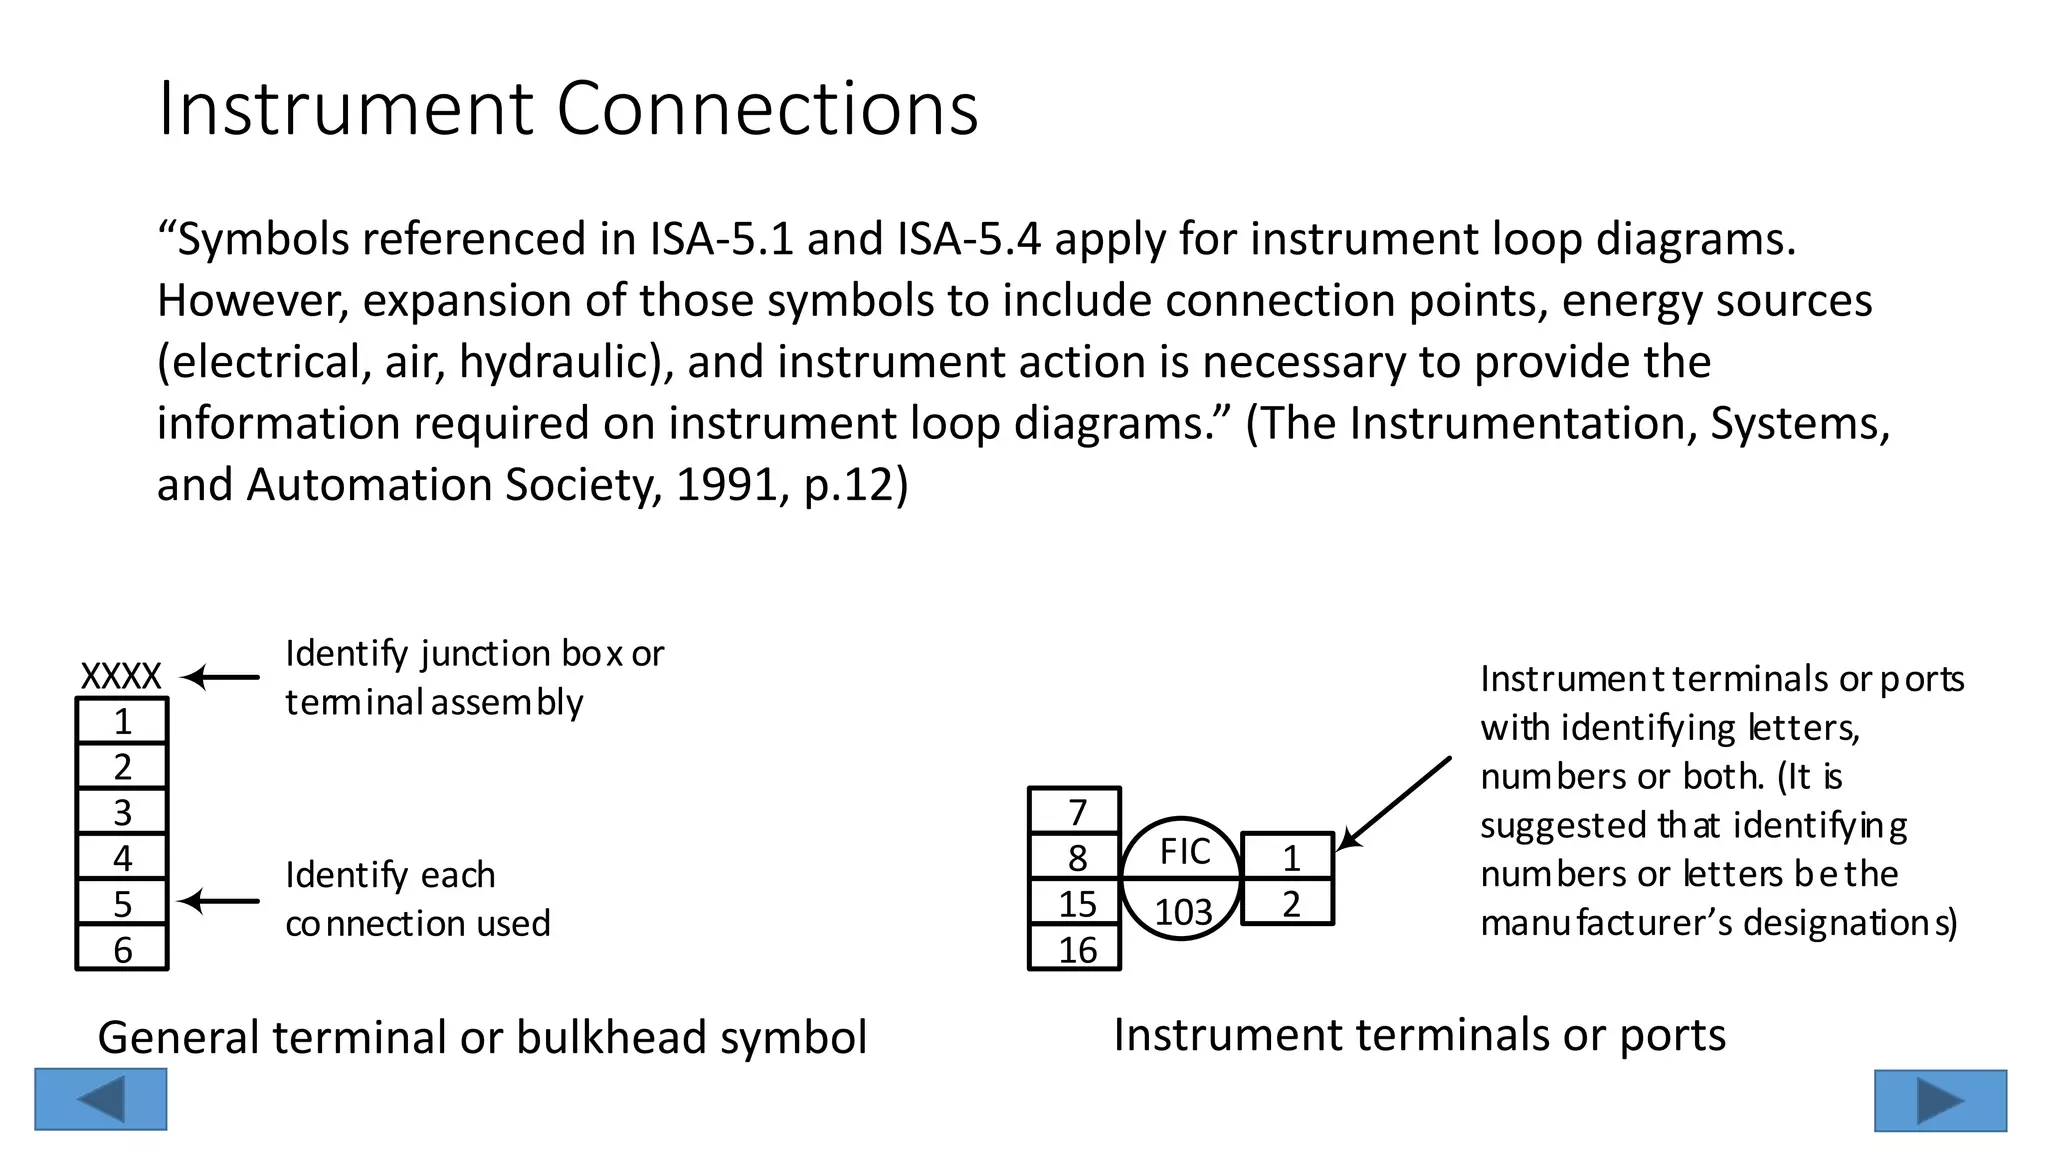
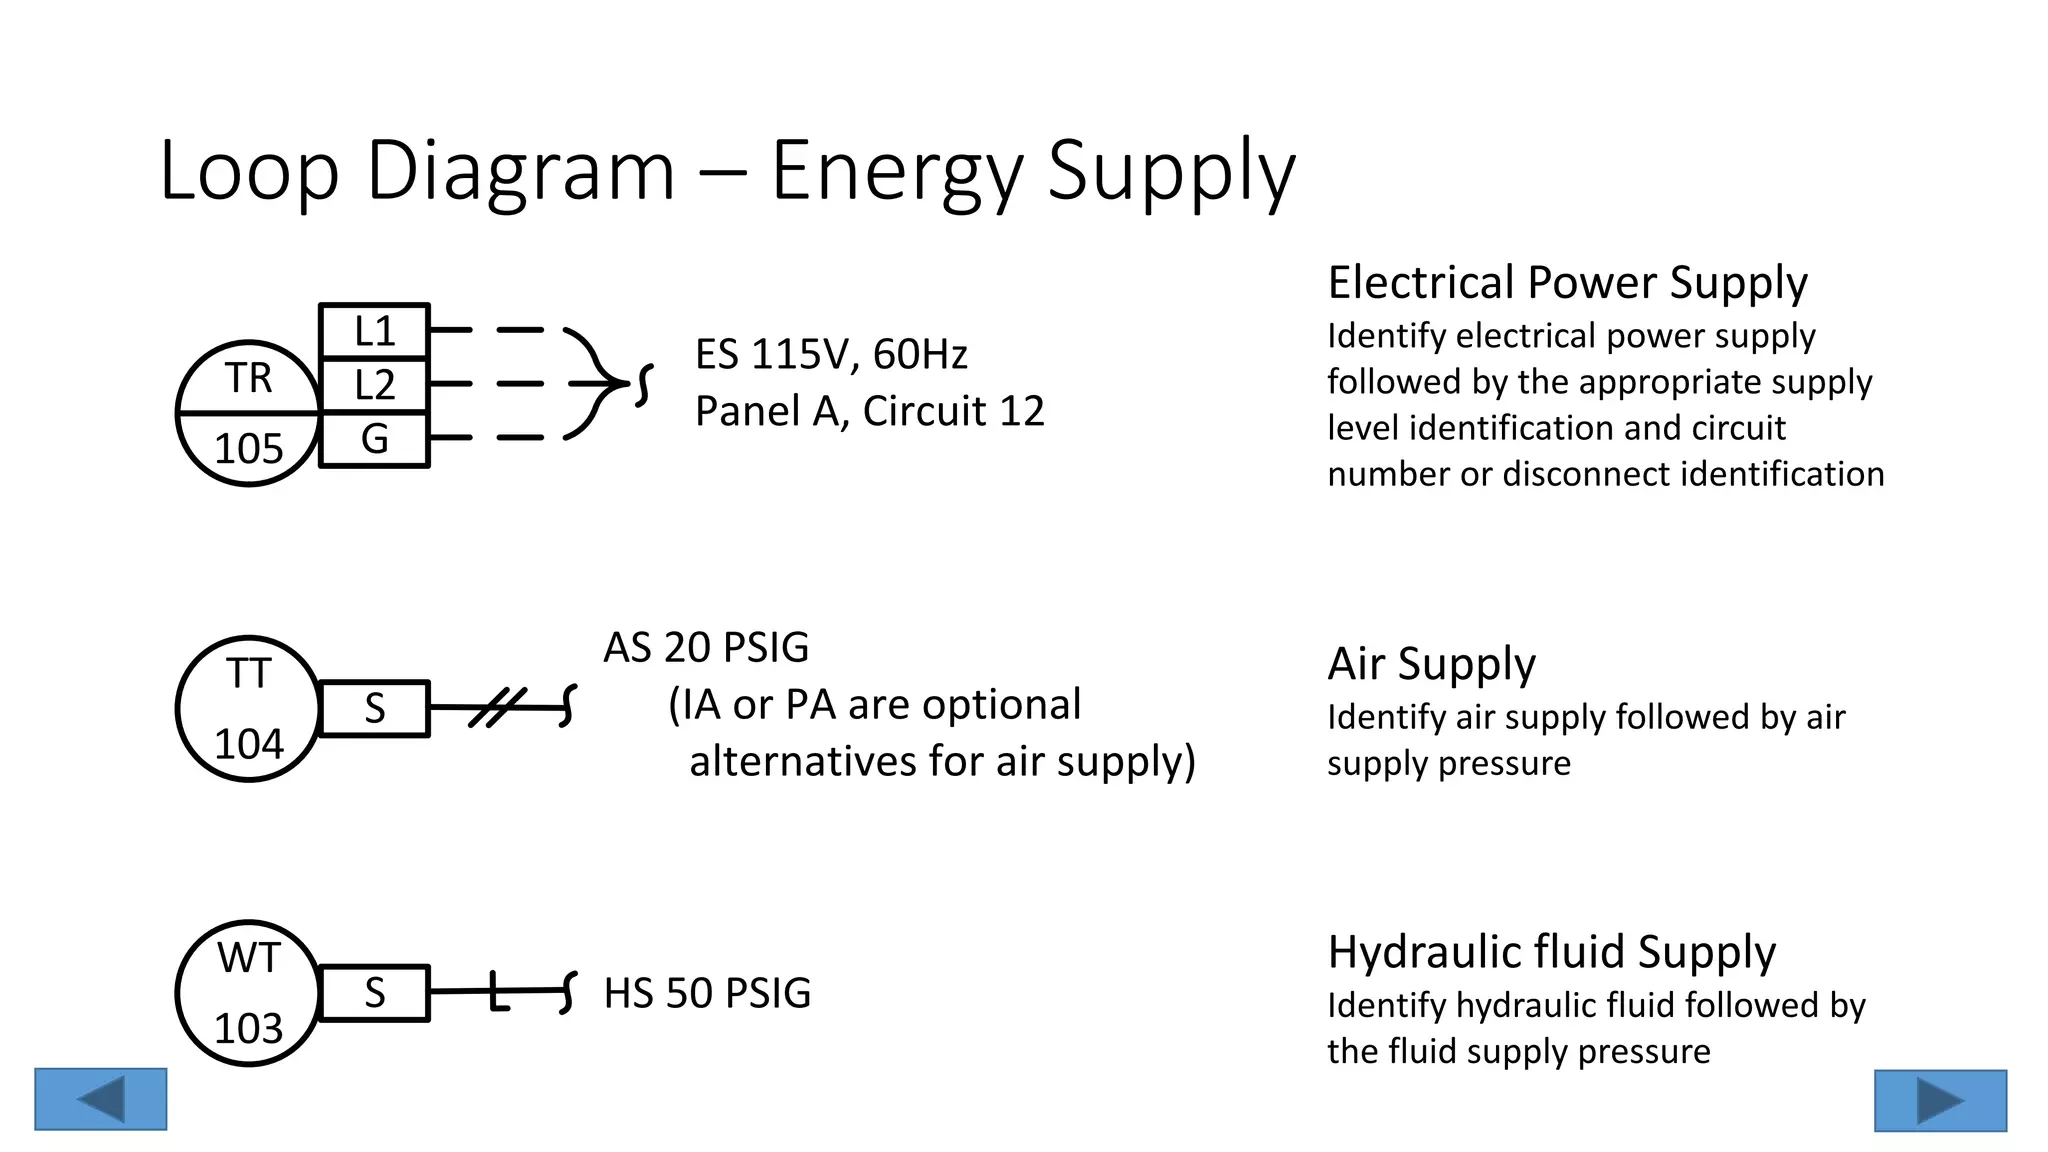
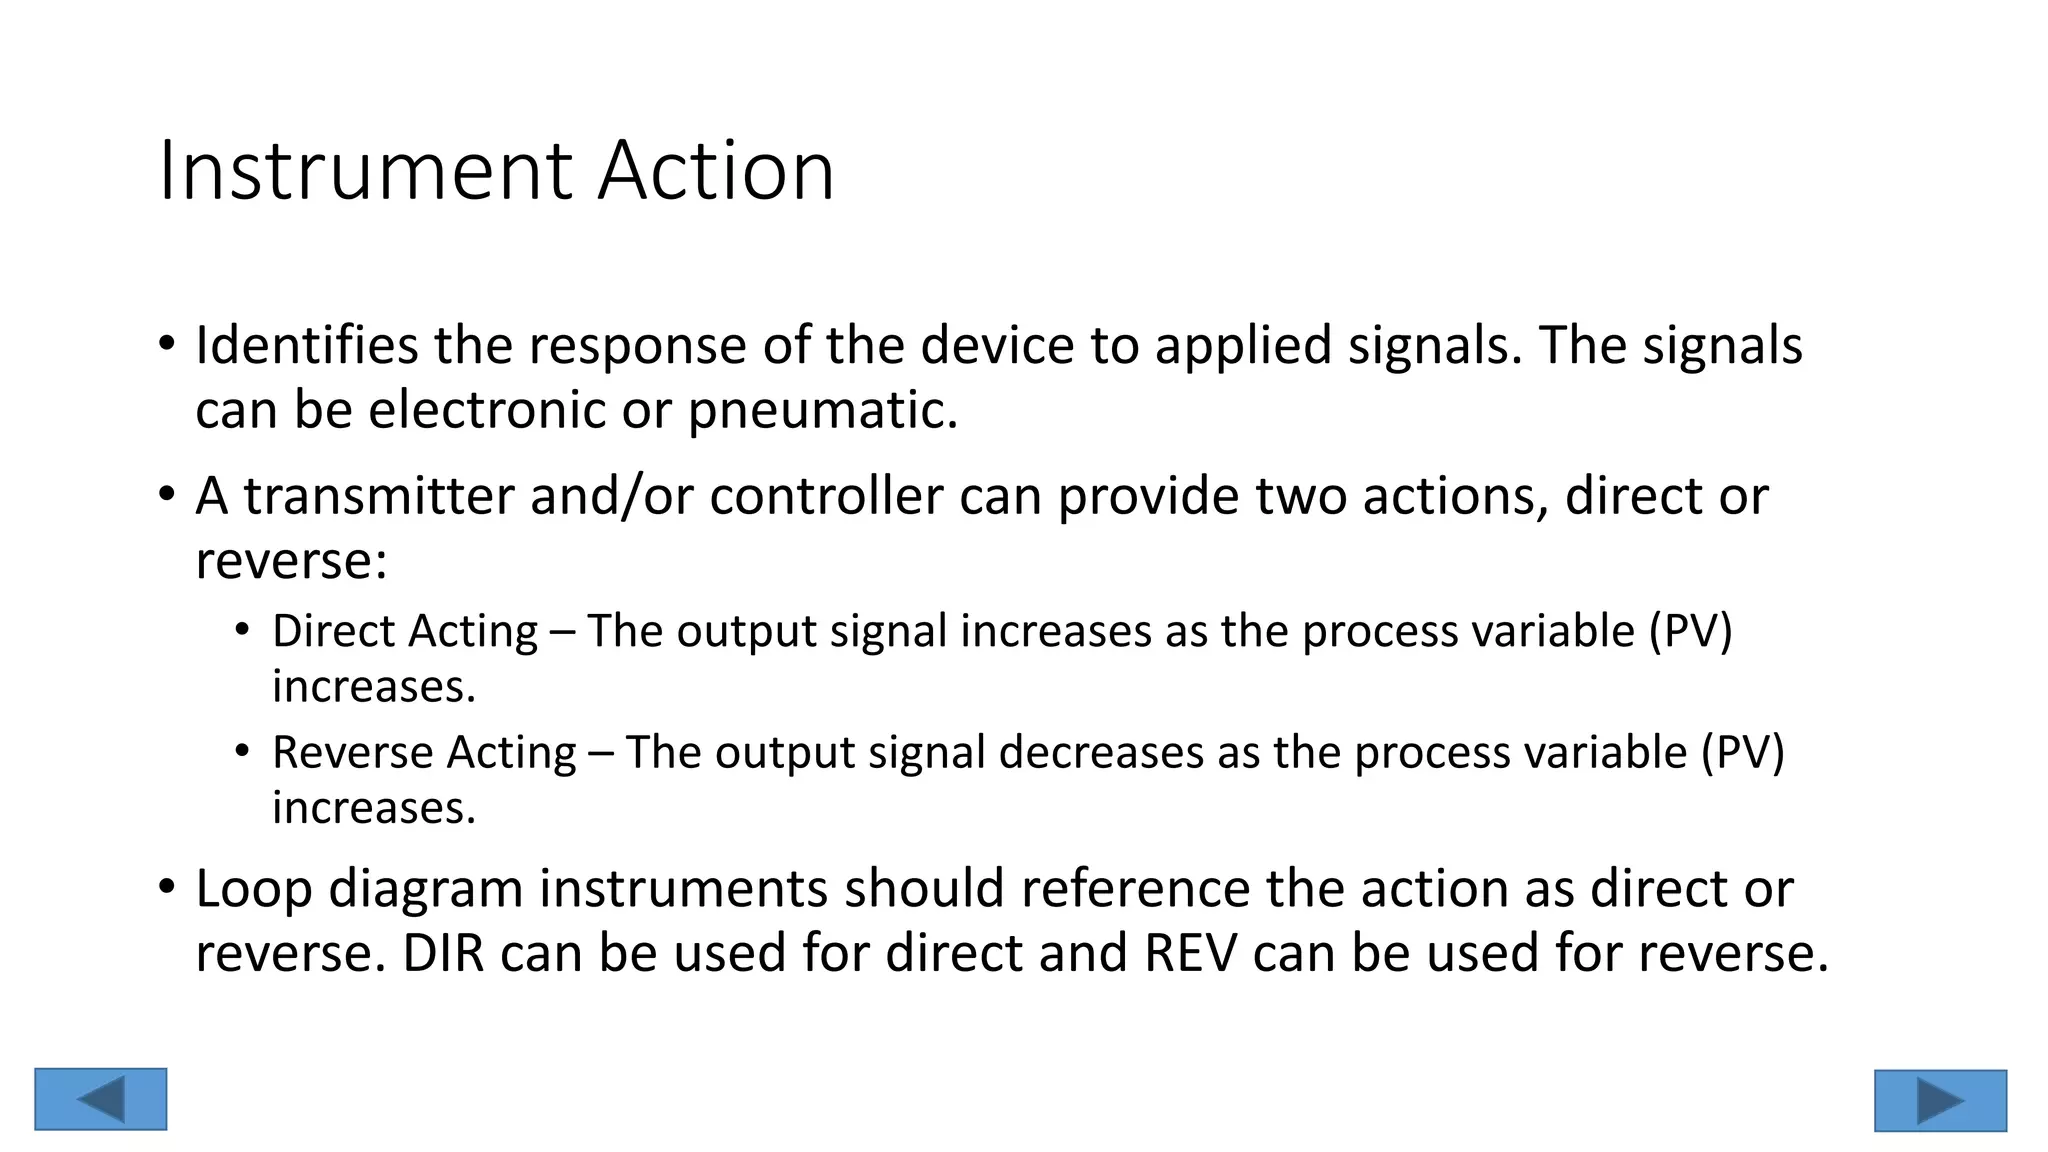
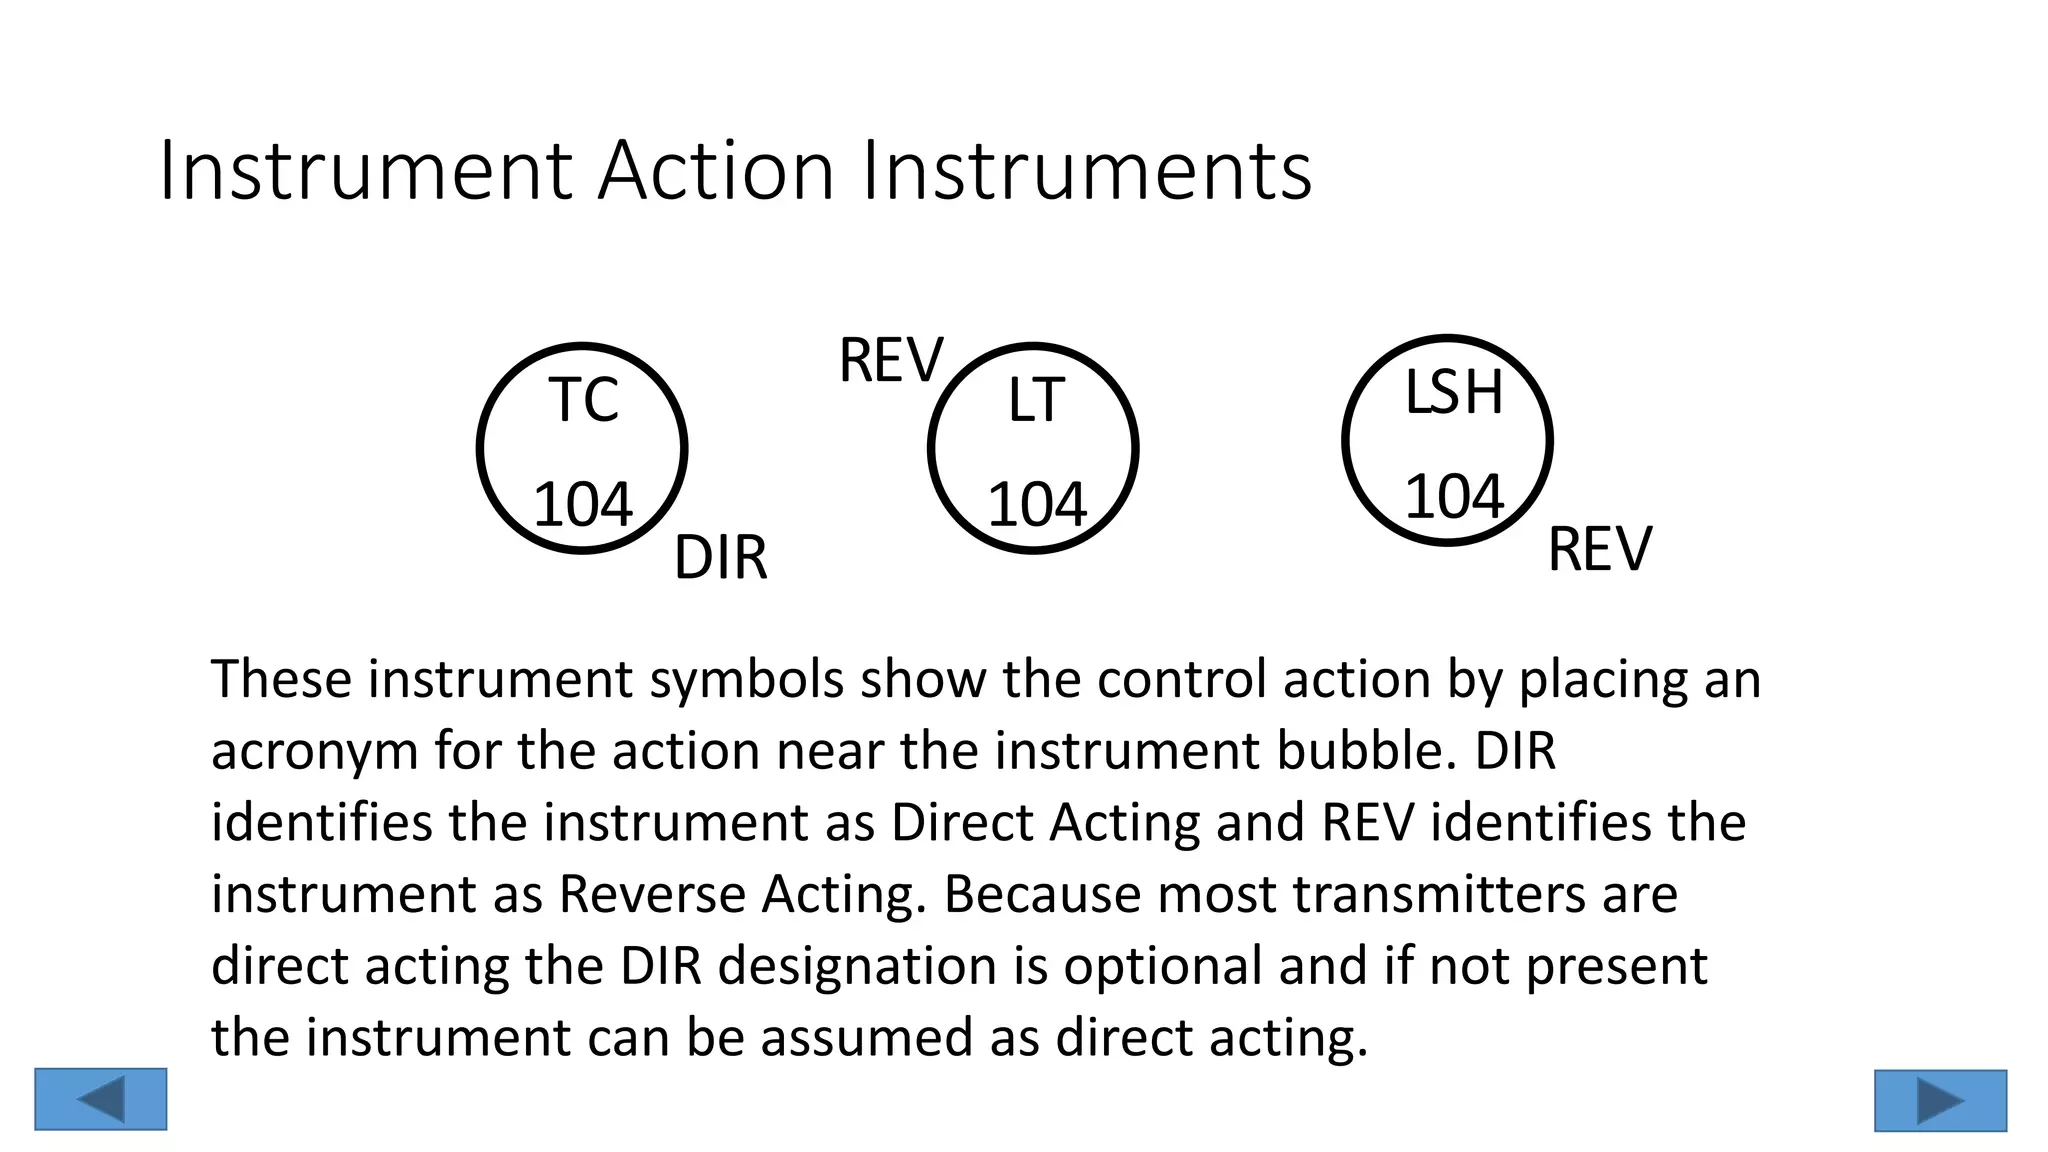
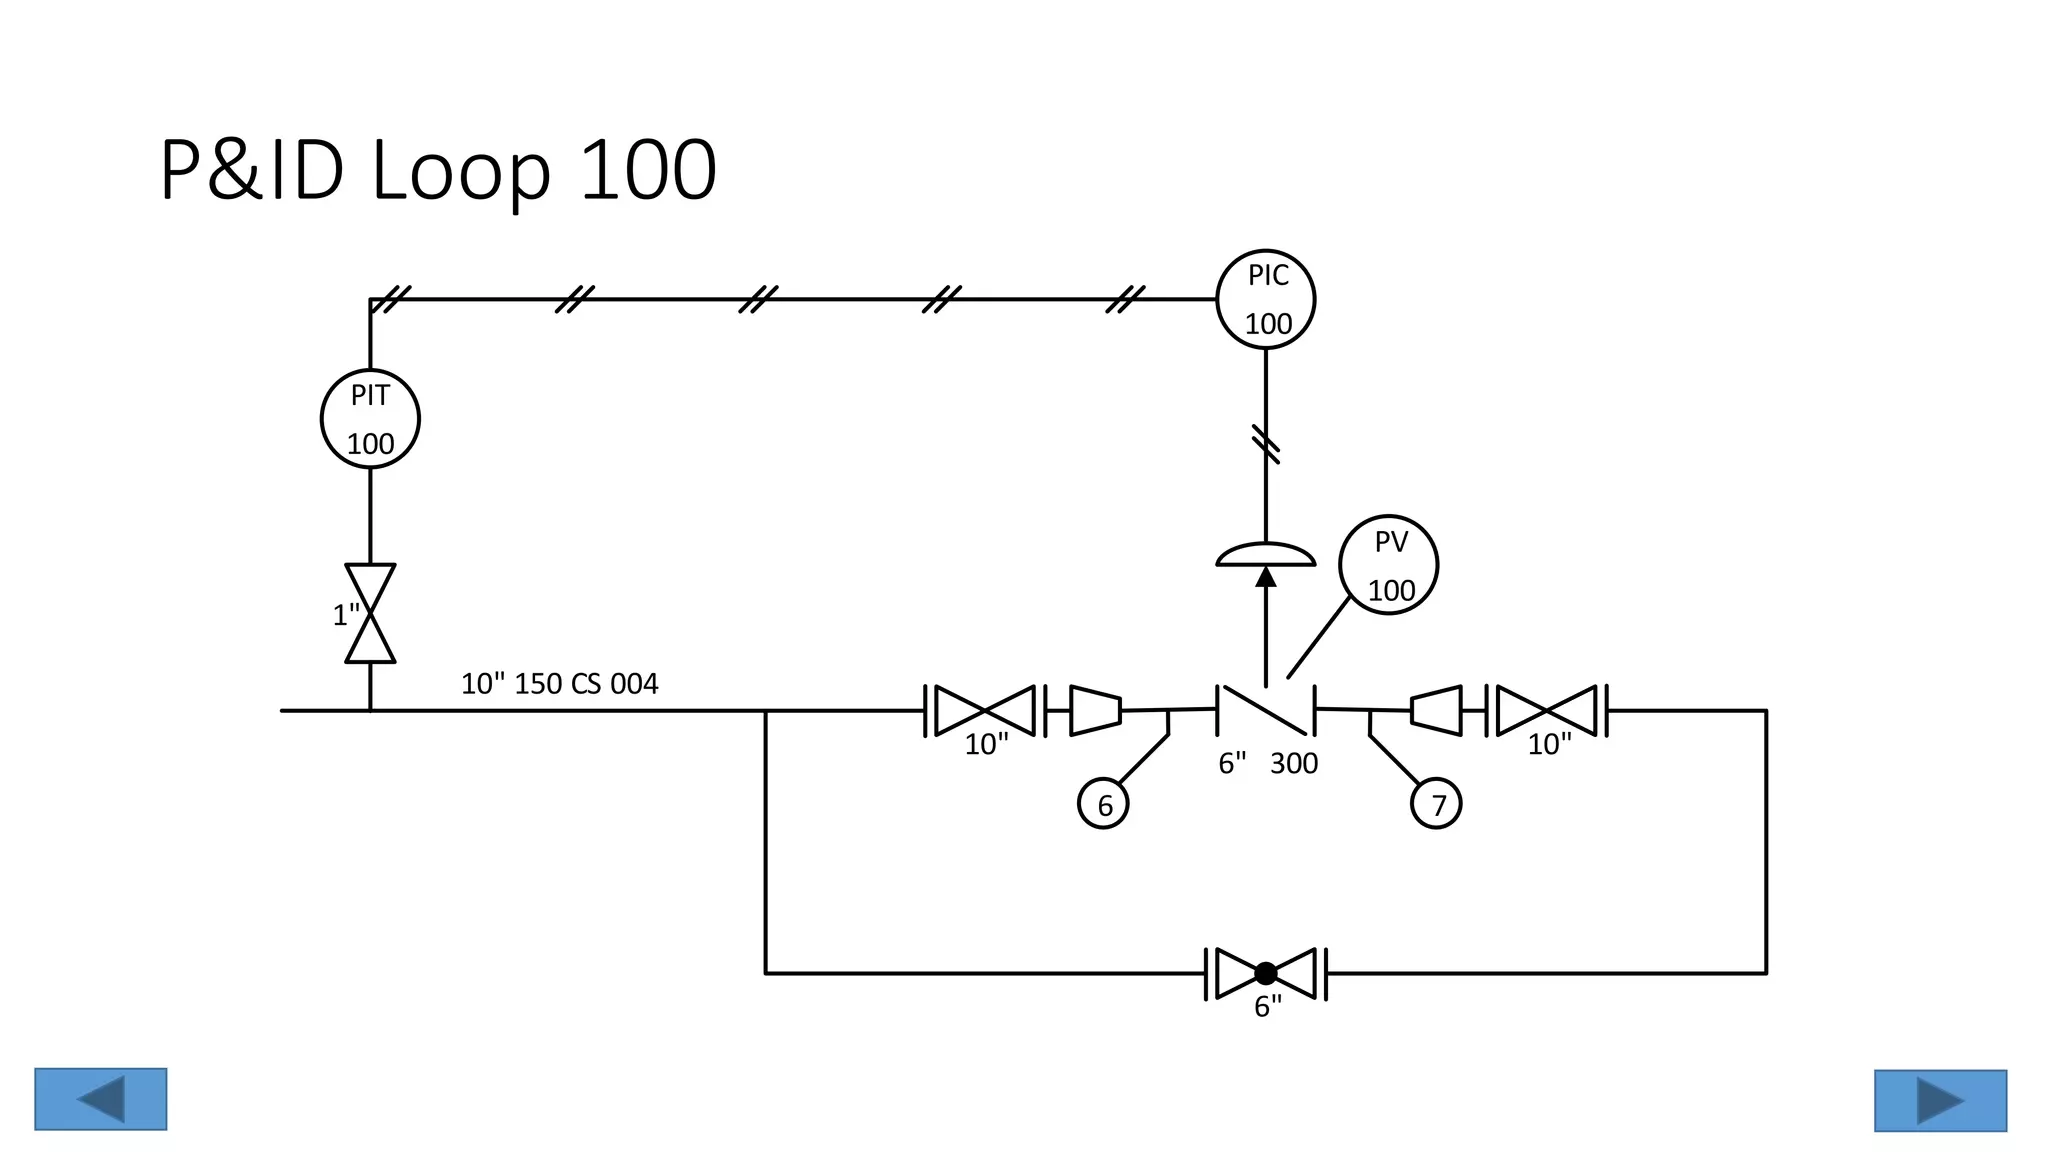
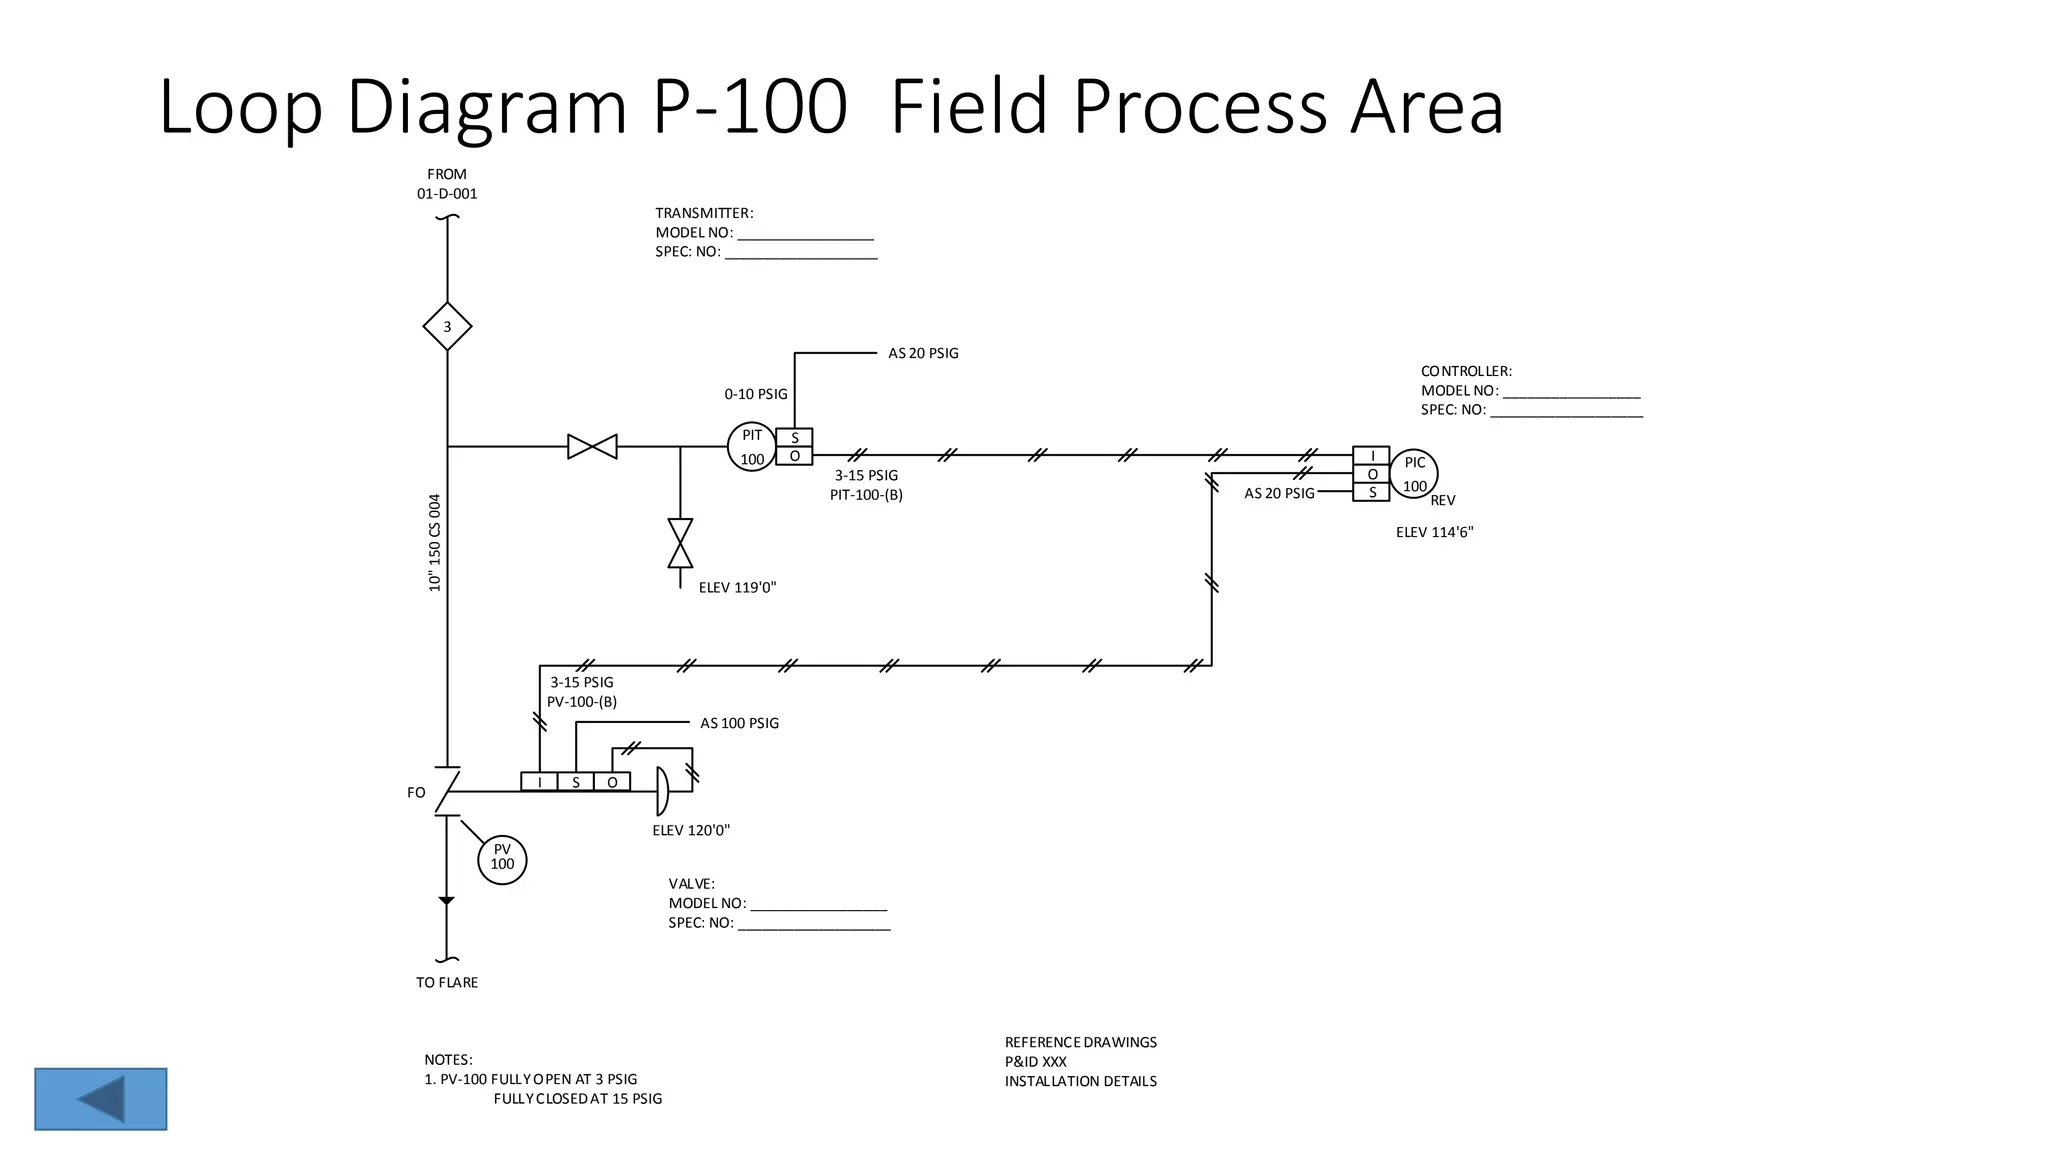
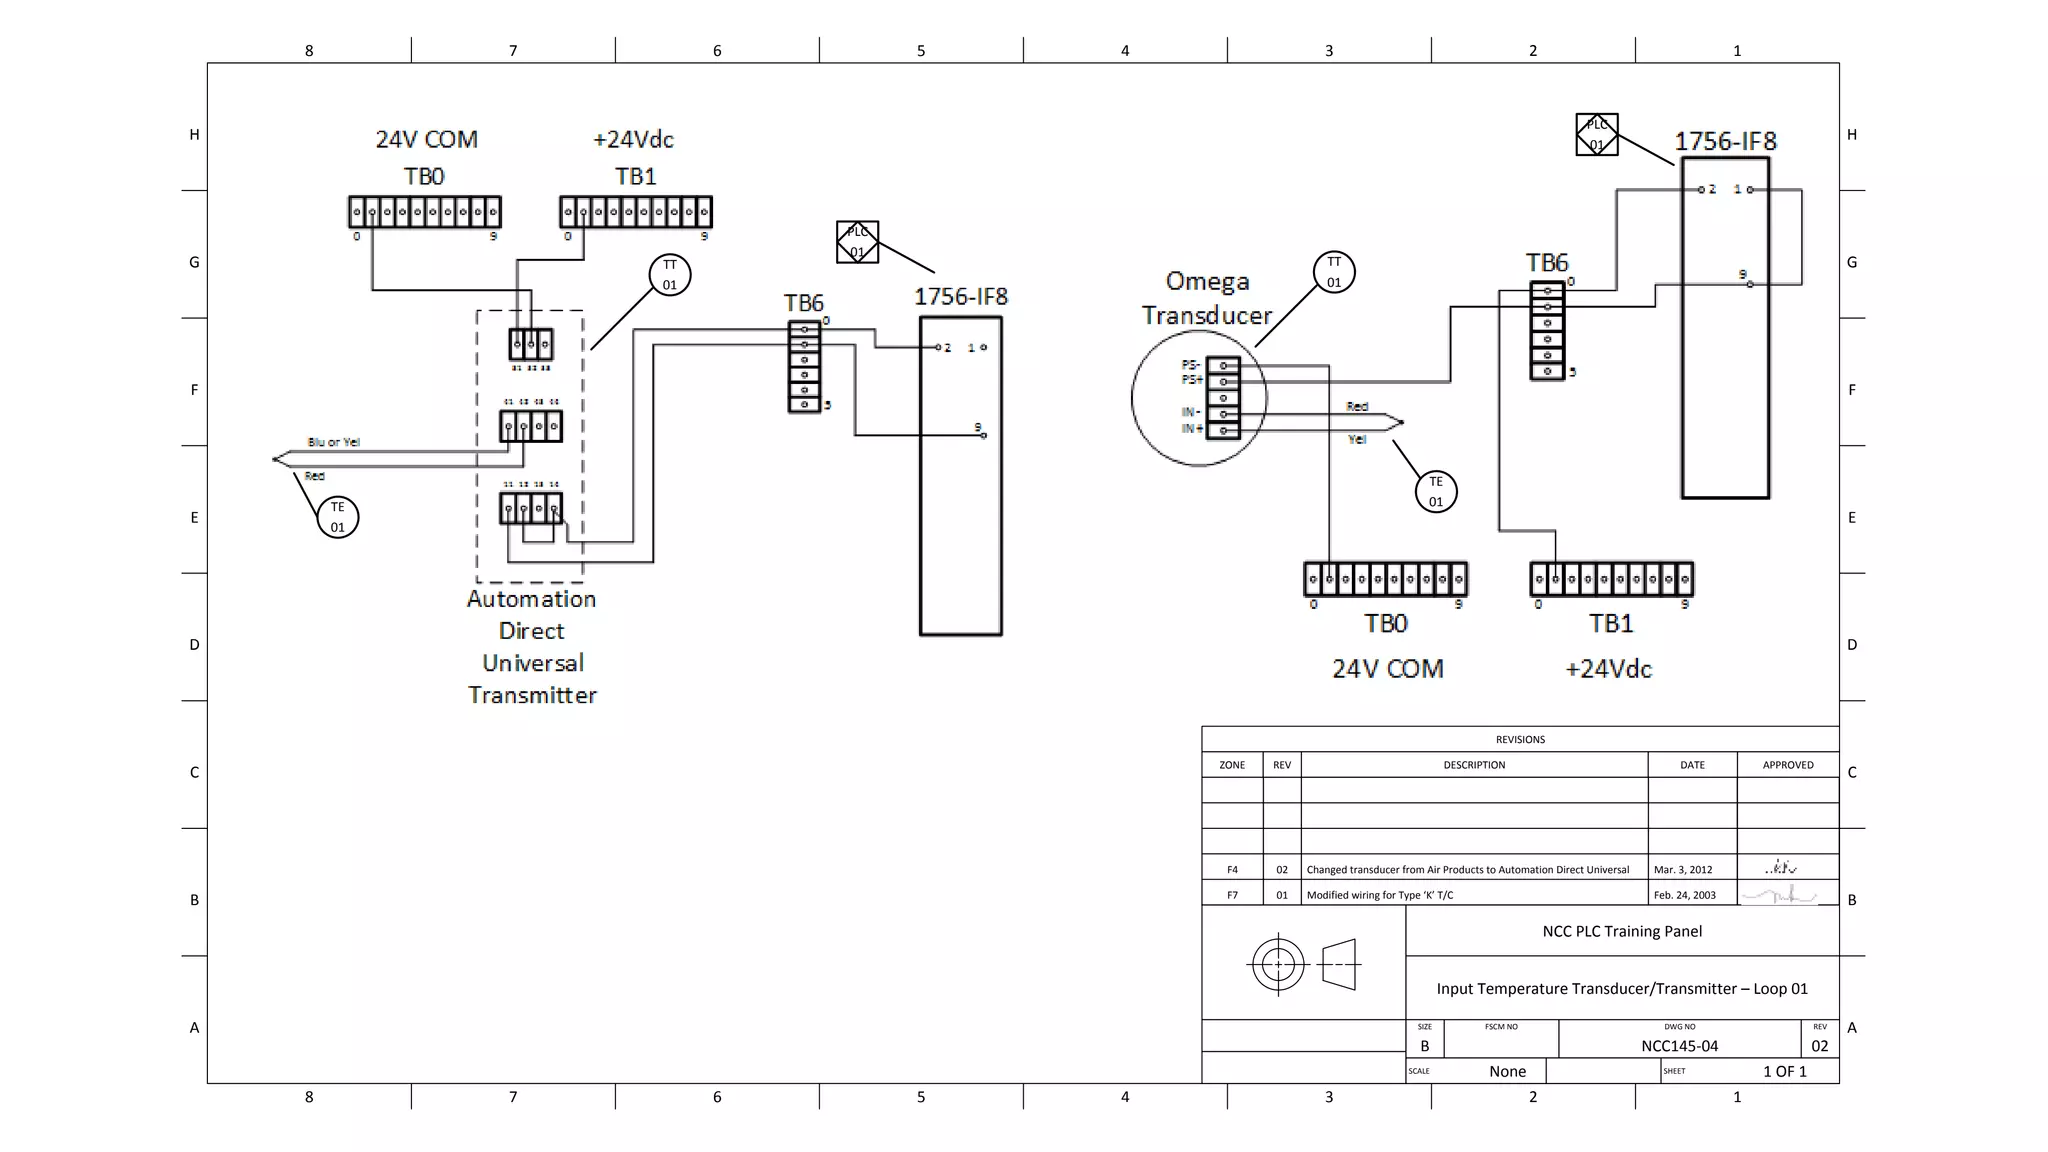
Loop Diagrams
Chapter 07 – Loop Diagrams
EMEC125
Overview & Definitions
• Loop diagrams are the most popular of all the documents generated
for a process control system.
• Definitions:
• Loop Diagram – “A schematic representation of a complete hydraulic, electric,
magnetic, or pneumatic circuit.” (International Society of Automation, 2003,
p.299)
• Loop – “Instrumentation arranged as a combination of two or more
instruments or functions arranged so that signals pass from one to another
for the purpose of measurement and indication or control of a process
variable. a) A self-contained device that measures and controls a process
variable.” (International Society of Automation, 2009, p.3.1.40)
Sample Loop Diagram
(CADtech Consultants, n.d.)Loop_Diagram_Sample.pdf
Loop Diagrams – What’s On Them?
• Everything a controls technician needs to maintain and/or install a
system of instrumentation
• Included is:
• Electrical and pneumatic signal connections
• Power connections to instruments and controls
• Indication and control devices, along with the connections to the process, to
the piping, the ductwork, vessels, tanks, etc.
• Controllers whether computer or pneumatic
• Source and service utilities i.e. compressed air, water, electrical power, etc.
• Termination information that includes the identification of junction box(es),
terminal strip numbers, terminal block numbers and possibly even pneumatic
port numbers
Guidelines
• ISA-5.4-1991 Instrument Loop Diagrams spell out a few guidelines for
creating loop diagrams. The standard states:
• Drawings should be American Society of Mechanical Engineers (ASME) B size
(11” x 17”) drawings.
• Only one loop should be depicted on a loop diagram.
• Paper can be portrait or landscape. Landscape is the preferred and is the most
common orientation.
• Should be divided into sections that relate to component locations, such as
and according to ISA-5.4:
• Field or Field Process Area
• Cable Spreading Room
• Computer I/O Cabinet/Cabinet
• Panel Front
• Control Panel
• Console
Developing a Loop Diagram
• Development can start when:
• A standard has been established as to the content.
• The P&IDs are completed and issued.
• Specification forms have been completed.
• All devices and instruments have been specified and preferably ordered.
• Junction boxes, if used, have been defined, a.k.a. marshalling panel.
• Termination diagrams for control computers are ready for loading.
Instrument Connections
1
2
3
4
5
6
XXXX
Identify junction box or
terminalassembly
Identify each
connection used
FIC
103
7
8
15
16
1
2
Instrument terminals orports
with identifying letters,
numbers or both. (It is
suggested that identifying
numbers or letters bethe
manufacturer’s designations)
“Symbols referenced in ISA-5.1 and ISA-5.4 apply for instrument loop diagrams.
However, expansion of those symbols to include connection points, energy sources
(electrical, air, hydraulic), and instrument action is necessary to provide the
information required on instrument loop diagrams.” (The Instrumentation, Systems,
and Automation Society, 1991, p.12)
General terminal or bulkhead symbol Instrument terminals or ports
Loop Diagram – Energy Supply
TR
105
L1
L2
G
S
TT
104
S
WT
103
ES 115V, 60Hz
Panel A, Circuit 12
AS 20 PSIG
(IA or PA are optional
alternatives for air supply)
HS 50 PSIG
Electrical Power Supply
Identify electrical power supply
followed by the appropriate supply
level identification and circuit
number or disconnect identification
Air Supply
Identify air supply followed by air
supply pressure
Hydraulic fluid Supply
Identify hydraulic fluid followed by
the fluid supply pressure
Instrument Action
• Identifies the response of the device to applied signals. The signals
can be electronic or pneumatic.
• A transmitter and/or controller can provide two actions, direct or
reverse:
• Direct Acting – The output signal increases as the process variable (PV)
increases.
• Reverse Acting – The output signal decreases as the process variable (PV)
increases.
• Loop diagram instruments should reference the action as direct or
reverse. DIR can be used for direct and REV can be used for reverse.
Instrument Action Instruments
TC
104
DIR
LT
104
REV LSH
104
REV
These instrument symbols show the control action by placing an
acronym for the action near the instrument bubble. DIR
identifies the instrument as Direct Acting and REV identifies the
instrument as Reverse Acting. Because most transmitters are
direct acting the DIR designation is optional and if not present
the instrument can be assumed as direct acting.
P&ID Loop 100
10"
6"
10"
PIC
100
10" 150 CS 004
1"
PIT
100
PV
100
6 7
6" 300
Loop Diagram P-100 Field Process Area
3-15 PSIG
PIT-100-(B)
I S O
PIT
100
S
O PIC
100
I
O
S
3
PV
100
AS 20 PSIG
0-10 PSIG
ELEV 119'0"
ELEV 120'0"
AS 20 PSIG
3-15 PSIG
PV-100-(B)
AS 100 PSIG
TO FLARE
10"150CS004
FO
FROM
01-D-001
ELEV 114'6"
REV
CONTROLLER:
MODEL NO: _________________
SPEC: NO: ___________________
VALVE:
MODEL NO: _________________
SPEC: NO: ___________________
TRANSMITTER:
MODEL NO: _________________
SPEC: NO: ___________________
NOTES:
1. PV-100 FULLYOPEN AT 3 PSIG
FULLYCLOSEDAT 15 PSIG
REFERENCEDRAWINGS
P&ID XXX
INSTALLATION DETAILS
H
G
F
E
D
C
B
A
8 7 6 5 4 3 2 1
H
G
F
E
D
C
B
A
8 7 6 5 4 3 2 1
NCC PLC Training Panel
Input Temperature Transducer/Transmitter – Loop 01
SIZE FSCM NO DWG NO REV
B NCC145-04 02
SCALE None SHEET 1 OF 1
REVISIONS
ZONE REV DESCRIPTION DATE APPROVED
F4
F7
02
01
Changed transducer from Air Products to Automation Direct Universal
Modified wiring for Type ‘K’ T/C
Mar. 3, 2012
Feb. 24, 2003
TT
01
PLC
01
PLC
01
TT
01
TE
01
TE
01

07 chapter07 loop_diagrams

  • 1.
    Loop Diagrams Chapter 07– Loop Diagrams EMEC125
  • 2.
    Overview & Definitions •Loop diagrams are the most popular of all the documents generated for a process control system. • Definitions: • Loop Diagram – “A schematic representation of a complete hydraulic, electric, magnetic, or pneumatic circuit.” (International Society of Automation, 2003, p.299) • Loop – “Instrumentation arranged as a combination of two or more instruments or functions arranged so that signals pass from one to another for the purpose of measurement and indication or control of a process variable. a) A self-contained device that measures and controls a process variable.” (International Society of Automation, 2009, p.3.1.40)
  • 3.
    Sample Loop Diagram (CADtechConsultants, n.d.)Loop_Diagram_Sample.pdf
  • 4.
    Loop Diagrams –What’s On Them? • Everything a controls technician needs to maintain and/or install a system of instrumentation • Included is: • Electrical and pneumatic signal connections • Power connections to instruments and controls • Indication and control devices, along with the connections to the process, to the piping, the ductwork, vessels, tanks, etc. • Controllers whether computer or pneumatic • Source and service utilities i.e. compressed air, water, electrical power, etc. • Termination information that includes the identification of junction box(es), terminal strip numbers, terminal block numbers and possibly even pneumatic port numbers
  • 5.
    Guidelines • ISA-5.4-1991 InstrumentLoop Diagrams spell out a few guidelines for creating loop diagrams. The standard states: • Drawings should be American Society of Mechanical Engineers (ASME) B size (11” x 17”) drawings. • Only one loop should be depicted on a loop diagram. • Paper can be portrait or landscape. Landscape is the preferred and is the most common orientation. • Should be divided into sections that relate to component locations, such as and according to ISA-5.4: • Field or Field Process Area • Cable Spreading Room • Computer I/O Cabinet/Cabinet • Panel Front • Control Panel • Console
  • 6.
    Developing a LoopDiagram • Development can start when: • A standard has been established as to the content. • The P&IDs are completed and issued. • Specification forms have been completed. • All devices and instruments have been specified and preferably ordered. • Junction boxes, if used, have been defined, a.k.a. marshalling panel. • Termination diagrams for control computers are ready for loading.
  • 7.
    Instrument Connections 1 2 3 4 5 6 XXXX Identify junctionbox or terminalassembly Identify each connection used FIC 103 7 8 15 16 1 2 Instrument terminals orports with identifying letters, numbers or both. (It is suggested that identifying numbers or letters bethe manufacturer’s designations) “Symbols referenced in ISA-5.1 and ISA-5.4 apply for instrument loop diagrams. However, expansion of those symbols to include connection points, energy sources (electrical, air, hydraulic), and instrument action is necessary to provide the information required on instrument loop diagrams.” (The Instrumentation, Systems, and Automation Society, 1991, p.12) General terminal or bulkhead symbol Instrument terminals or ports
  • 8.
    Loop Diagram –Energy Supply TR 105 L1 L2 G S TT 104 S WT 103 ES 115V, 60Hz Panel A, Circuit 12 AS 20 PSIG (IA or PA are optional alternatives for air supply) HS 50 PSIG Electrical Power Supply Identify electrical power supply followed by the appropriate supply level identification and circuit number or disconnect identification Air Supply Identify air supply followed by air supply pressure Hydraulic fluid Supply Identify hydraulic fluid followed by the fluid supply pressure
  • 9.
    Instrument Action • Identifiesthe response of the device to applied signals. The signals can be electronic or pneumatic. • A transmitter and/or controller can provide two actions, direct or reverse: • Direct Acting – The output signal increases as the process variable (PV) increases. • Reverse Acting – The output signal decreases as the process variable (PV) increases. • Loop diagram instruments should reference the action as direct or reverse. DIR can be used for direct and REV can be used for reverse.
  • 10.
    Instrument Action Instruments TC 104 DIR LT 104 REVLSH 104 REV These instrument symbols show the control action by placing an acronym for the action near the instrument bubble. DIR identifies the instrument as Direct Acting and REV identifies the instrument as Reverse Acting. Because most transmitters are direct acting the DIR designation is optional and if not present the instrument can be assumed as direct acting.
  • 11.
    P&ID Loop 100 10" 6" 10" PIC 100 10"150 CS 004 1" PIT 100 PV 100 6 7 6" 300
  • 12.
    Loop Diagram P-100Field Process Area 3-15 PSIG PIT-100-(B) I S O PIT 100 S O PIC 100 I O S 3 PV 100 AS 20 PSIG 0-10 PSIG ELEV 119'0" ELEV 120'0" AS 20 PSIG 3-15 PSIG PV-100-(B) AS 100 PSIG TO FLARE 10"150CS004 FO FROM 01-D-001 ELEV 114'6" REV CONTROLLER: MODEL NO: _________________ SPEC: NO: ___________________ VALVE: MODEL NO: _________________ SPEC: NO: ___________________ TRANSMITTER: MODEL NO: _________________ SPEC: NO: ___________________ NOTES: 1. PV-100 FULLYOPEN AT 3 PSIG FULLYCLOSEDAT 15 PSIG REFERENCEDRAWINGS P&ID XXX INSTALLATION DETAILS
  • 13.
    H G F E D C B A 8 7 65 4 3 2 1 H G F E D C B A 8 7 6 5 4 3 2 1 NCC PLC Training Panel Input Temperature Transducer/Transmitter – Loop 01 SIZE FSCM NO DWG NO REV B NCC145-04 02 SCALE None SHEET 1 OF 1 REVISIONS ZONE REV DESCRIPTION DATE APPROVED F4 F7 02 01 Changed transducer from Air Products to Automation Direct Universal Modified wiring for Type ‘K’ T/C Mar. 3, 2012 Feb. 24, 2003 TT 01 PLC 01 PLC 01 TT 01 TE 01 TE 01

Editor's Notes

  • #3 Introduce the student to Loop Diagrams, what they are and how they are basically used. Review the definitions.
  • #4 Open the file: “Loop_Diagram_Sample.pdf” to allow zooming. This is an example of a Loop Diagram. In this chapter we will talking about and producing loop diagrams. CADtech Consultants. (n.d.). ...software solutions for EPCs & Plant Operators. Retrieved June 23, 2015, from CADtech Consultants: http://www.cadtechindia.com/P_reports.htm
  • #5 Review what appears on Loop Diagrams. Other things that can appear are: cable numbering, wire colors, wire markers, callouts on power panels and circuit breaker numbers.
  • #6 ASME B-Size drawings can be easily printed and easily reduced to A-Size 8-1/2” x 11” paper. B-Size is easy to use on the bench top or in the field. Students were introduced to the standard paper sizes earlier in the course. Here they are for review: ANSI A – 8.5” x 11” 215.9 mm x 279.4 mm ANSI B – 11” x 17” 279.4 mm x 431.8 mm ANSI C – 17” x 22” 431.8 mm x 558.8 mm ANSI D – 22” x 34” 558.8 mm x 863.6 mm ANSI E – 34” x 44” 863.6 mm x 1117.6 mm Only one loop should be depicted on a loop diagram page. Some old documents might show several loops on a ‘D’ or ‘E’ size paper; however, this is not the standard and was most likely done due to lack of knowledge or as a method to save money. Dividing the document in sections depicting what location(s) the equipment is located in makes it very easy for technicians and engineers to get a full picture of the loop as it relates to the process with all of the connections, junction boxes, etc. shown.
  • #7 Discuss the basic needs to start developing a loop diagram. The content that will appear on a loop diagram should be agreed upon. There are times when too much information on these documents could be more of a hindrance then help. All of the P&IDs should be complete and approved. The instrument and device spec. sheets should be complete and available. If junction boxes are used, the architecture should be understood and defined. These junction boxes, a.k.a. marshalling panels, are where individual signal cables are gathered into one or a few large multi-conductor cables for the run to the host controller panel. The location of these boxes/panels should appear on the loop diagram since wire degradation can account for disturbance an a reason for signal loss. The computer and/or controller termination diagrams should be complete that shows the input and output cards and the connections devices to those cards.
  • #8 The terminal blocks shown on this slide are examples of how instrument connection points can be shown on loop diagrams. This diagrams are taken from the ISA-5.4-1991 Standard, Paragraph 7.2 and7.3, page 13.
  • #9 These samples are taken from the ISA-5.4-1991 standard and the textbook. They show methods for depicting how energy sources are connected to instruments. Things to note is that for Electrical Power connections, the voltage level is shown. If the voltage is AC, the frequency is also shown. It’s always a good idea to include the panel designation and the circuit identification, if they exist. For pneumatics, the air supply level should be shown in the appropriate units, usually (Pounds per Square Inch, Gauge) PSIG. Other air supplies can be referenced. Instrument Air (IA) is clean dray air that meets ANSI/ISA-7.0.01-1996 standard and Pressure Absolute (PA). Pressure Absolute is defined as: 1. The pressure that is measured relative to zero pressure (vacuum) [ISA-37.1-1975 (R1982)]. 2. The pressure above the absolute zero value of pressure that is theoretically obtained in empty space or at the absolute zero for temperature, as distinguished from gauge pressure. For hydraulics, the fluid supply pressure should be shown.
  • #11 Students will learn, or are currently learning more about Direct and Reverse Acting transmitters in another course in this series.
  • #12 Clicking the P&ID will open a PDF showing the P&ID and the Loop Diagram on the same page. This P&ID is Figure 2-23 in the textbook and relates to Figure 2-21 that shows loop 100. Review the operation of this P&ID and in particular, what appears on the P&ID versus what will appear on the Loop Diagram that will be shown on the next slide.
  • #13 Clicking the Loop Diagram will open a PDF showing the P&ID and the Loop Diagram on the same page. Review this Loop Diagram. Be sure to identify all of the key components that make this a loop diagram and what appears on this diagram that does not appear on the P&ID. Reference that fact that on the P&ID, PIC 100 does not state that it is reverse acting; however, on the loop diagram it does. Explain how one should understand that since PV 100 is Fail Open, the PIC 100 must be reverse acting so that the loop works correctly.