Downloaded 228 times
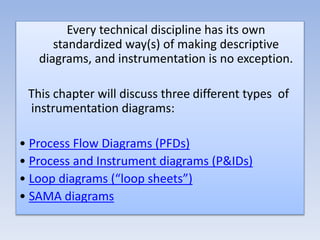

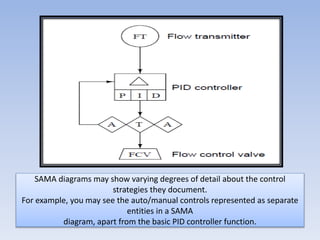
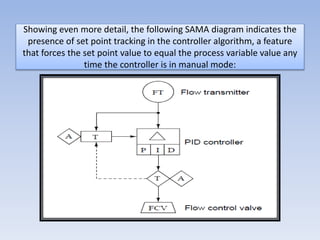

This document discusses different types of instrumentation diagrams used in process instrumentation: - Process Flow Diagrams (PFDs) show the overall process flow with minimal instrumentation details. - Process and Instrument Diagrams (P&IDs) show both the process flow and instrumentation connections. - Loop diagrams focus on instrumentation details like wire and terminal connections. - SAMA diagrams focus on control strategies through information flow rather than physical connections. The document explains key details depicted in each type of diagram through examples.