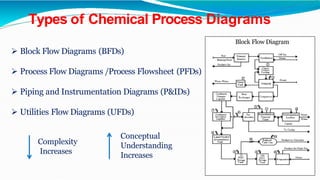
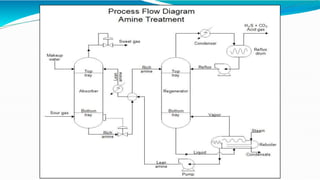
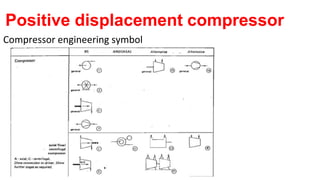
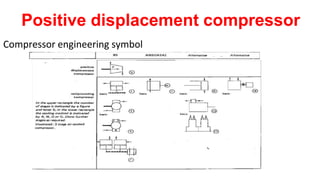
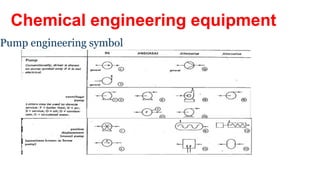
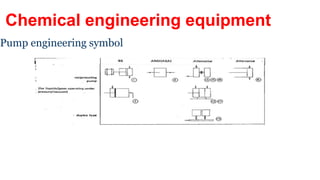
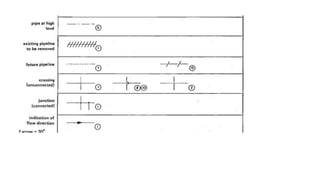
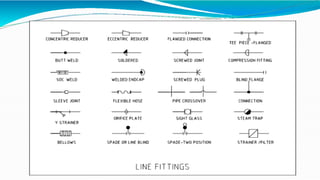
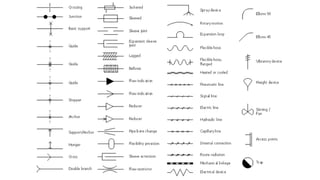
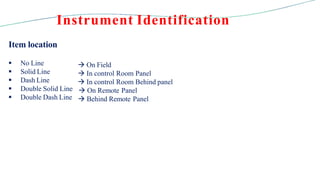
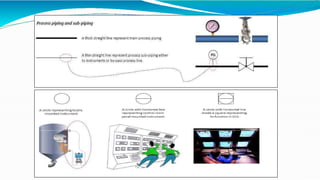
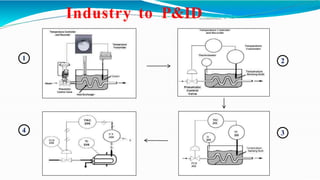
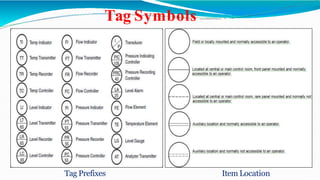
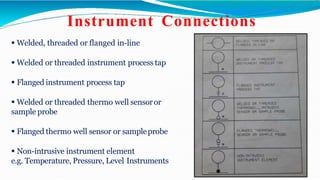
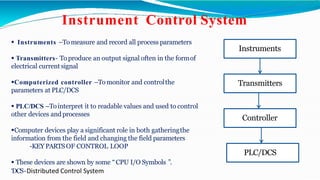
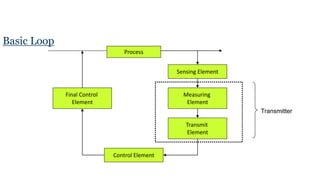
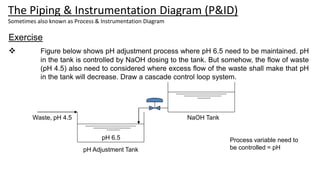
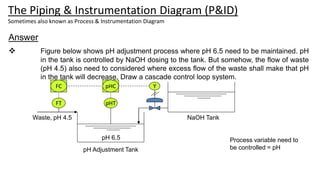
A Typical Chemical Plant
Chemical Process Diagrams
(Flow sheets)
 Engineering drawings that defines the Chemical Process Steps in proper sequence Pictorially
More elaborate diagrammatic representations of Equipments, Sequence of Operations, and
Performance of a Plant
 Necessary for clarity and to meet the needs of various persons engaged in Design, Cost
estimating, Purchasing, Fabrication, Operation, Maintenance and Management
 During plant design, for understanding the process requirements
 During Operations, forms a basis for comparison of operating performance with design
 Can be used by operating personnel for the preparation of operating manuals and training
Key documents in understanding Process, during Operation and Maintenance
Types of Chemical Process Diagrams
 Block Flow Diagrams (BFDs)
 Process Flow Diagrams /Process Flowsheet (PFDs)
 Piping and Instrumentation Diagrams (P&IDs)
 Utilities Flow Diagrams (UFDs)
Block Flow Diagram
Complexity
Increases
Conceptual
Understanding
Increases
1. Genesis of P&ID
 BFD represents entire process in a single sheet. Rectangles in Block
Flow Diagrams represents unit operations.
 Blocks are connected by straight lines representing process
flow streams. Process flow streams may be mixtures of liquids, gases
and solids flowing in pipes or ducts, or solids being carried on a
conveyor belt.
 In PFD you can find some detailed information like plant operating
conditions, process flow. It is is a type of flowchart that illustrates
the relationships between major components at an industrial
plant
 P&IDs provide detail information when compared to above two
drawings. They use standard nomenclature, symbols, and tag numbers
to fully describe the process.
Fluid transportation system
- Compressor
Used to increase the pressure of a gas (compressible fluid)
Examples
Increase the pressure for instrument air systems (to get control valves to operate),
transport gases such as hydrogen, nitrogen, fuel gas, etc. in a chemical plant
Centrifugal compressor
Positive displacement compressor
Compressor engineering symbol
Positive displacement compressor
Compressor engineering symbol
Positive displacement compressor
Compressor engineering symbol
Chemical engineering equipment
Pump engineering symbol
Chemical engineering equipment
Pump engineering symbol
Introduction to P&ID
 Diagram in the process industry which shows the Piping of the process flow together withthe
installed Equipment and Instrumentation
 Institute of Instrumentation and Control (UK) defines as-
“A diagram which shows the interconnection of Piping, Process Equipment and the Instrumentation
used to control the process”
 In simple words, Schematic representation of all Equipment, Piping and Process Instrumentation
Provides the basis for the development of system control schemes, allowing for further safety and
operational investigations , such as HAZOP
 P&ID is used during most plant activities such as-
• Normal operating conditions
• Startup & Shutdowns
• Regular Maintenance
• Emergency Situations
“Piping & InstrumentationDiagram”
The Piping & Instrumentation Diagram (P&ID)
Sometimes also known as Process & Instrumentation Diagram
Purpose of P&ID
 To show –
 Material Flow
 Piping between various sections
 Major pieces of mechanical Equipments
 Valves and directions of process flow
 Field Mounted instruments
 Electrical Equipments
 Communication Links
 Not to show-
Process Information
Physical dimensions of equipment
Piping Details
Control Logic
Standards and Codes used in Instrumentation-
 American National Standards Institute (ANSI)- All Products & Services
 American Petroleum Institute (API)- Oil & Natural Gas
 American Society for Testing Materials (ASTM)- All Products & Services
 American Society of Mechanical Engineers (ASME)-Pressure vessels & Pipes
 American Institute of Chemical Engineers (AIChE)- Manufacturing Processes
 Deutsches Institut für Normung (DIN)- Rules and symbols for flow-sheet
 International Society of Automation (ISA)- Process control
“ Goal of uniformity in the field of Instrumentation ”
P&ID Symbology
P&ID Symbol Contents
 Equipment Symbology
 Equipment Layout
 Equipment Identification & Numbering
 Nozzles
 Miscellaneous
 Piping Symbology
 Piping Layout
 Line Identification
 Line Continuation
 Piping Components
 Utility Piping
 Instrument Symbology
 Instrument Layout
 Instrument Identification
 Interconnecting Piping
 Instrument Piping
 Instrument Control
Item Status
N
E
R
V
F
M
- New
- Existing
- Tobe Relocated
- Vendor Supplied Packages
- Future
- Tobe Modified
Equipment Symbology
I) Equipment Layout
 Relative Shape
e.g. Spheres, Tanks, Columns, Pumps
 Relative Orientation
e.g. Horizontal, Vertical, Sloped
 Relative Position
Location relative to otherequipment
 Relative Size
Size relative to otherequipment
 Equipment Status
e.g. New, Existing, Relocated, Future, Vendor S.
Piping Symbology
 Piping is shown schematically, in a logical sequence, not as it is actually piped in the field
 Piping specification differentiate between various piping systems
e.g. pigging line system, cooling jacket pipeline etc.
 The various piping parts are shown according to following category:
 Drains
 Vents
 Flush connections
 Steam and Air traps
 Reducers
 Relief devices
 Each pipeline will have a label that gives a unique identifier, size and piping specification code
 Piping length and elevation, isometrics, and stress considerations are not shown
Interconnecting Line types
Types of Connections:
 Main Line(Pipeline)
 Process Connections
 Pneumatic Signals
 Data Links
 Capillary Tubing
 Hydraulic Signals
 Electromagnetic /Sonic Signal
Pipe support and hangers
(British Standard)

Line Continuation
In almost all processes in chemical plant, various materials
are transferred to different parts of the plant.
In such cases, one P&ID sheet is not sufficient to show all
piping systems of that material spread in various parts of plant.
 We have to continue the pipeline flow in the next sheetsalso
 Line continuation symbols
Line continuation symbols show piping connections between
different P&IDs.
 It helps to correlate the connections of some materialsin
different processes within the plant.
Miscellaneous Piping Items:
 All manual valves
 Self-contained regulating valve
 Rupture/Safety devices
 Drains
 Vents
 Flush connections
 Steam and Air traps
 Reducers /Expanders
Piping Components
Valves on Piping
A valve is a device that regulates, directs or controls the flow of a fluid (gases, liquids,
fluidized solids, or slurries) by opening, closing, or partially obstructing various passageways.
Instrument Symbology
An instrument is a device that measures a physical quantity such as flow,
temperature, level, distance,pressure.
Instrumentation is the use of measuring instruments to monitor and control
process.
As a chemical plant has different processes occurring and we use instruments
for the following reasons:
 Reduce Variability
 Increase Efficiency
 Ensure Safety
 P&IDs shows all instruments present over the plant in various processes.
Every instrument is identified and shown both schematically and symbolically
on the P&IDs.
Instrument specifications give the particular type, service, range, and
manufacturer.
Instrument Identification
Item location
 No Line
 Solid Line
 Dash Line
 Double Solid Line
 Double Dash Line
 On Field
 In control Room Panel
 In control Room Behind panel
 On Remote Panel
 Behind Remote Panel
1
4 3
2
Industry to P&ID
Tag Symbols
Tag Prefixes Item Location
Instrument Connections
 Welded, threaded or flanged in-line
 Welded or threaded instrument process tap
 Flanged instrument process tap
 Welded or threaded thermo well sensoror
sample probe
 Flanged thermo well sensor or sampleprobe
 Non-intrusive instrument element
e.g. Temperature, Pressure, Level Instruments
Instrument Control System
 Instruments –Tomeasure and record all process parameters
 Transmitters- To produce an output signal often in the formof
electrical current signal
Computerized controller –To monitor and controlthe
parameters at PLC/DCS
 PLC/DCS –Tointerpret it to readable values and used to control
other devices andprocesses
Computer devices play a significant role in both gatheringthe
information from the field and changing the field parameters
-KEY PARTSOF CONTROL LOOP
 These devices are shown by some “CPU I/O Symbols ”.
‘DCS-Distributed Control System
Instrument Control System
Instruments
PLC/DCS
Controller
Transmitters
Detailed graphical representation of a process including the
hardware and software (i.e piping, equipment, and
instrumentation) necessary to design, construct and operate
the facility. Common synonyms for P&IDs include
Engineering Flow Diagram (EFD), Utility Flow Diagram
(UFD) and Mechanical Flow Diagram (MFD).
The Piping & Instrumentation Diagram (P&ID)
Sometimes also known as Process & Instrumentation Diagram
Basic Loop
Process
Sensing Element
Measuring
Element
Transmit
Element
Control Element
Final Control
Element
Transmitter
Basic Loop
Transmitter
Controller
Orifice
(Flow Sensor)
Set point
Fluid Fluid
SENSORS (Sensing Element)
A device, such as a photoelectric cell, that receives and responds to a signal or
stimulus.
A sensor is a device that measures a physical quantity and converts it into a signal
which can be read by an observer or by an instrument.
For example, a mercury thermometer converts the measured temperature into
expansion and contraction of a liquid which can be read on a calibrated glass tube.
For accuracy, all sensors need to be calibrated against known standards.
Temperature Sensor
A thermocouple is a junction between two different metals that produces a voltage
related to a temperature difference. Thermocouples are a widely used type
of temperature sensor.
1. Thermocouple
Flow Sensor
Example :-Turbine Meter
In a turbine, the basic concept is that a meter is manufactured with a known cross
sectional area. A rotor is then istalled inside the meter with its blades axial to the
product flow. When the product passes the rotor blades, they impart an angular
velocity to the blades and therefore to the rotor. This angular velocity is directly
proportional to the total volumetric flow rate.
Turbine meters are best suited to large, sustained flows as they are susceptible to
start/stop errors as well as errors caused by unsteady flow states.
Flow Sensor
Venturi Meter
A device for measuring flow of a fluid in terms of
the drop in pressure when the fluid flows into
the constriction of a Venturi tube.
It consists of a venturi tube and one of several forms
of flow registering devices.
TRANSMITTER
Transmitter is a transducer* that responds to a measurement variable and
converts that input into a standardized transmission signal.
*Transducer is a device that receives output signal from sensors.
Pressure Transmitter
Differential Pressure
Transmitter
Pressure Level
Transmitter
CONTROLLER
Controller is a device which monitors and affects the operational conditions of a
given dynamical system. The operational conditions are typically referred to as output
variables of the system which can be affected by adjusting certain input variables
Indicating Controller Recording Controller
FINAL CONTROL ELEMENT
Final Control Element is a device that directly controls the value of manipulated variable
of control loop. Final control element may be control valves, pumps, heaters, etc.
Pump Control Valve Heater
Industrial Applications
The detailed design approach requires various departments to supply agreat
deal of data with other. Listed are various fields that use P&IDs:
 Process Engineers
 Piping/Mechanical Engineers
 Electrical Engineers
 Instrumentation Engineers
 Structural/Civil Engineers
The Piping & Instrumentation Diagram (P&ID)
Sometimes also known as Process & Instrumentation Diagram
Exercise
 Figure below shows pH adjustment process where pH 6.5 need to be maintained. pH
in the tank is controlled by NaOH dosing to the tank. But somehow, the flow of waste
(pH 4.5) also need to considered where excess flow of the waste shall make that pH
in the tank will decrease. Draw a cascade control loop system.
Process variable need to
be controlled = pH
NaOH Tank
pH Adjustment Tank
Waste, pH 4.5
pH 6.5
The Piping & Instrumentation Diagram (P&ID)
Sometimes also known as Process & Instrumentation Diagram
Answer
 Figure below shows pH adjustment process where pH 6.5 need to be maintained. pH
in the tank is controlled by NaOH dosing to the tank. But somehow, the flow of waste
(pH 4.5) also need to considered where excess flow of the waste shall make that pH
in the tank will decrease. Draw a cascade control loop system.
Process variable need to
be controlled = pH
pHT
FT
pHC
FC Y
NaOH Tank
pH Adjustment Tank
Waste, pH 4.5
pH 6.5
5_6064355360796312399.pptx

5_6064355360796312399.pptx

  • 1.
  • 2.
    Chemical Process Diagrams (Flowsheets)  Engineering drawings that defines the Chemical Process Steps in proper sequence Pictorially More elaborate diagrammatic representations of Equipments, Sequence of Operations, and Performance of a Plant  Necessary for clarity and to meet the needs of various persons engaged in Design, Cost estimating, Purchasing, Fabrication, Operation, Maintenance and Management  During plant design, for understanding the process requirements  During Operations, forms a basis for comparison of operating performance with design  Can be used by operating personnel for the preparation of operating manuals and training Key documents in understanding Process, during Operation and Maintenance
  • 3.
    Types of ChemicalProcess Diagrams  Block Flow Diagrams (BFDs)  Process Flow Diagrams /Process Flowsheet (PFDs)  Piping and Instrumentation Diagrams (P&IDs)  Utilities Flow Diagrams (UFDs) Block Flow Diagram Complexity Increases Conceptual Understanding Increases
  • 4.
  • 5.
     BFD representsentire process in a single sheet. Rectangles in Block Flow Diagrams represents unit operations.  Blocks are connected by straight lines representing process flow streams. Process flow streams may be mixtures of liquids, gases and solids flowing in pipes or ducts, or solids being carried on a conveyor belt.  In PFD you can find some detailed information like plant operating conditions, process flow. It is is a type of flowchart that illustrates the relationships between major components at an industrial plant  P&IDs provide detail information when compared to above two drawings. They use standard nomenclature, symbols, and tag numbers to fully describe the process.
  • 7.
    Fluid transportation system -Compressor Used to increase the pressure of a gas (compressible fluid) Examples Increase the pressure for instrument air systems (to get control valves to operate), transport gases such as hydrogen, nitrogen, fuel gas, etc. in a chemical plant
  • 8.
  • 9.
  • 10.
  • 11.
  • 12.
  • 13.
  • 14.
    Introduction to P&ID Diagram in the process industry which shows the Piping of the process flow together withthe installed Equipment and Instrumentation  Institute of Instrumentation and Control (UK) defines as- “A diagram which shows the interconnection of Piping, Process Equipment and the Instrumentation used to control the process”  In simple words, Schematic representation of all Equipment, Piping and Process Instrumentation Provides the basis for the development of system control schemes, allowing for further safety and operational investigations , such as HAZOP  P&ID is used during most plant activities such as- • Normal operating conditions • Startup & Shutdowns • Regular Maintenance • Emergency Situations “Piping & InstrumentationDiagram”
  • 15.
    The Piping &Instrumentation Diagram (P&ID) Sometimes also known as Process & Instrumentation Diagram
  • 16.
    Purpose of P&ID To show –  Material Flow  Piping between various sections  Major pieces of mechanical Equipments  Valves and directions of process flow  Field Mounted instruments  Electrical Equipments  Communication Links  Not to show- Process Information Physical dimensions of equipment Piping Details Control Logic
  • 17.
    Standards and Codesused in Instrumentation-  American National Standards Institute (ANSI)- All Products & Services  American Petroleum Institute (API)- Oil & Natural Gas  American Society for Testing Materials (ASTM)- All Products & Services  American Society of Mechanical Engineers (ASME)-Pressure vessels & Pipes  American Institute of Chemical Engineers (AIChE)- Manufacturing Processes  Deutsches Institut für Normung (DIN)- Rules and symbols for flow-sheet  International Society of Automation (ISA)- Process control “ Goal of uniformity in the field of Instrumentation ” P&ID Symbology
  • 18.
    P&ID Symbol Contents Equipment Symbology  Equipment Layout  Equipment Identification & Numbering  Nozzles  Miscellaneous  Piping Symbology  Piping Layout  Line Identification  Line Continuation  Piping Components  Utility Piping  Instrument Symbology  Instrument Layout  Instrument Identification  Interconnecting Piping  Instrument Piping  Instrument Control Item Status N E R V F M - New - Existing - Tobe Relocated - Vendor Supplied Packages - Future - Tobe Modified
  • 19.
    Equipment Symbology I) EquipmentLayout  Relative Shape e.g. Spheres, Tanks, Columns, Pumps  Relative Orientation e.g. Horizontal, Vertical, Sloped  Relative Position Location relative to otherequipment  Relative Size Size relative to otherequipment  Equipment Status e.g. New, Existing, Relocated, Future, Vendor S.
  • 20.
    Piping Symbology  Pipingis shown schematically, in a logical sequence, not as it is actually piped in the field  Piping specification differentiate between various piping systems e.g. pigging line system, cooling jacket pipeline etc.  The various piping parts are shown according to following category:  Drains  Vents  Flush connections  Steam and Air traps  Reducers  Relief devices  Each pipeline will have a label that gives a unique identifier, size and piping specification code  Piping length and elevation, isometrics, and stress considerations are not shown
  • 21.
    Interconnecting Line types Typesof Connections:  Main Line(Pipeline)  Process Connections  Pneumatic Signals  Data Links  Capillary Tubing  Hydraulic Signals  Electromagnetic /Sonic Signal
  • 23.
    Pipe support andhangers (British Standard)
  • 24.
     Line Continuation In almostall processes in chemical plant, various materials are transferred to different parts of the plant. In such cases, one P&ID sheet is not sufficient to show all piping systems of that material spread in various parts of plant.  We have to continue the pipeline flow in the next sheetsalso  Line continuation symbols Line continuation symbols show piping connections between different P&IDs.  It helps to correlate the connections of some materialsin different processes within the plant.
  • 25.
    Miscellaneous Piping Items: All manual valves  Self-contained regulating valve  Rupture/Safety devices  Drains  Vents  Flush connections  Steam and Air traps  Reducers /Expanders Piping Components
  • 28.
    Valves on Piping Avalve is a device that regulates, directs or controls the flow of a fluid (gases, liquids, fluidized solids, or slurries) by opening, closing, or partially obstructing various passageways.
  • 29.
    Instrument Symbology An instrumentis a device that measures a physical quantity such as flow, temperature, level, distance,pressure. Instrumentation is the use of measuring instruments to monitor and control process. As a chemical plant has different processes occurring and we use instruments for the following reasons:  Reduce Variability  Increase Efficiency  Ensure Safety  P&IDs shows all instruments present over the plant in various processes. Every instrument is identified and shown both schematically and symbolically on the P&IDs. Instrument specifications give the particular type, service, range, and manufacturer.
  • 30.
    Instrument Identification Item location No Line  Solid Line  Dash Line  Double Solid Line  Double Dash Line  On Field  In control Room Panel  In control Room Behind panel  On Remote Panel  Behind Remote Panel
  • 32.
  • 33.
  • 34.
    Instrument Connections  Welded,threaded or flanged in-line  Welded or threaded instrument process tap  Flanged instrument process tap  Welded or threaded thermo well sensoror sample probe  Flanged thermo well sensor or sampleprobe  Non-intrusive instrument element e.g. Temperature, Pressure, Level Instruments
  • 35.
  • 36.
     Instruments –Tomeasureand record all process parameters  Transmitters- To produce an output signal often in the formof electrical current signal Computerized controller –To monitor and controlthe parameters at PLC/DCS  PLC/DCS –Tointerpret it to readable values and used to control other devices andprocesses Computer devices play a significant role in both gatheringthe information from the field and changing the field parameters -KEY PARTSOF CONTROL LOOP  These devices are shown by some “CPU I/O Symbols ”. ‘DCS-Distributed Control System Instrument Control System Instruments PLC/DCS Controller Transmitters
  • 37.
    Detailed graphical representationof a process including the hardware and software (i.e piping, equipment, and instrumentation) necessary to design, construct and operate the facility. Common synonyms for P&IDs include Engineering Flow Diagram (EFD), Utility Flow Diagram (UFD) and Mechanical Flow Diagram (MFD). The Piping & Instrumentation Diagram (P&ID) Sometimes also known as Process & Instrumentation Diagram
  • 38.
  • 39.
  • 40.
    SENSORS (Sensing Element) Adevice, such as a photoelectric cell, that receives and responds to a signal or stimulus. A sensor is a device that measures a physical quantity and converts it into a signal which can be read by an observer or by an instrument. For example, a mercury thermometer converts the measured temperature into expansion and contraction of a liquid which can be read on a calibrated glass tube. For accuracy, all sensors need to be calibrated against known standards.
  • 41.
    Temperature Sensor A thermocoupleis a junction between two different metals that produces a voltage related to a temperature difference. Thermocouples are a widely used type of temperature sensor. 1. Thermocouple
  • 42.
    Flow Sensor Example :-TurbineMeter In a turbine, the basic concept is that a meter is manufactured with a known cross sectional area. A rotor is then istalled inside the meter with its blades axial to the product flow. When the product passes the rotor blades, they impart an angular velocity to the blades and therefore to the rotor. This angular velocity is directly proportional to the total volumetric flow rate. Turbine meters are best suited to large, sustained flows as they are susceptible to start/stop errors as well as errors caused by unsteady flow states.
  • 43.
    Flow Sensor Venturi Meter Adevice for measuring flow of a fluid in terms of the drop in pressure when the fluid flows into the constriction of a Venturi tube. It consists of a venturi tube and one of several forms of flow registering devices.
  • 44.
    TRANSMITTER Transmitter is atransducer* that responds to a measurement variable and converts that input into a standardized transmission signal. *Transducer is a device that receives output signal from sensors. Pressure Transmitter Differential Pressure Transmitter Pressure Level Transmitter
  • 45.
    CONTROLLER Controller is adevice which monitors and affects the operational conditions of a given dynamical system. The operational conditions are typically referred to as output variables of the system which can be affected by adjusting certain input variables Indicating Controller Recording Controller
  • 46.
    FINAL CONTROL ELEMENT FinalControl Element is a device that directly controls the value of manipulated variable of control loop. Final control element may be control valves, pumps, heaters, etc. Pump Control Valve Heater
  • 47.
    Industrial Applications The detaileddesign approach requires various departments to supply agreat deal of data with other. Listed are various fields that use P&IDs:  Process Engineers  Piping/Mechanical Engineers  Electrical Engineers  Instrumentation Engineers  Structural/Civil Engineers
  • 48.
    The Piping &Instrumentation Diagram (P&ID) Sometimes also known as Process & Instrumentation Diagram Exercise  Figure below shows pH adjustment process where pH 6.5 need to be maintained. pH in the tank is controlled by NaOH dosing to the tank. But somehow, the flow of waste (pH 4.5) also need to considered where excess flow of the waste shall make that pH in the tank will decrease. Draw a cascade control loop system. Process variable need to be controlled = pH NaOH Tank pH Adjustment Tank Waste, pH 4.5 pH 6.5
  • 49.
    The Piping &Instrumentation Diagram (P&ID) Sometimes also known as Process & Instrumentation Diagram Answer  Figure below shows pH adjustment process where pH 6.5 need to be maintained. pH in the tank is controlled by NaOH dosing to the tank. But somehow, the flow of waste (pH 4.5) also need to considered where excess flow of the waste shall make that pH in the tank will decrease. Draw a cascade control loop system. Process variable need to be controlled = pH pHT FT pHC FC Y NaOH Tank pH Adjustment Tank Waste, pH 4.5 pH 6.5