![Terms You Should Know Before Proceeding
• Discrete Control
• “On/off control. One of the two output values is equal to zero.” (International
Society of Automation, 2003, p. 150)
• A better definition would be: A signal that is either fully ON or fully OFF with
no values in-between.
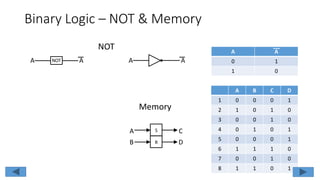
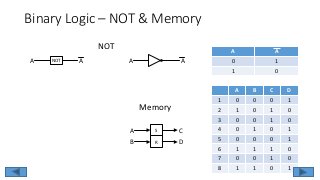
• Binary
• “1. A term applied to a signal or device that has only two discrete positions or
states. When used in its simplest form, as in “binary signal” (as opposed to
“analog signal”), the term denotes an “on-off” or “high-low” state, that is, one
that does not represent continuously varying quantities. [ANSI-ISA-5.1-1984
(R1992)].” (International Society of Automation, 2003, p. 49).](https://image.slidesharecdn.com/06chapter06binarylogicsystems-160811205502/85/06-chapter06-binary_logic_systems_Rev02-4-320.jpg)
![Terms You Should Know Before Proceeding
• Process Variable
• “1. Any variable property of a process. The term process variable is used in
the relevant standard to apply to all variables other than instrument signals
[ANSI/ISA-5.1-1984 (R1992)]. 2. In the treatment of material, any
characteristic or measurable attribute whose value changes with changes in
prevailing conditions. Common variables are flow, level, pressure and
temperature.” (International Society of Automation, 2003, p. 392).
• Control Variable (Controlled Variable)
• “1. The variable that the control system attempts to keep at the set point
value. The set point may be constant or variable. 2. The part of a process to
be controlled (flow, level, temperature, pressure, etc.).” (International Society
of Automation, 2003, p. 109).](https://image.slidesharecdn.com/06chapter06binarylogicsystems-160811205502/85/06-chapter06-binary_logic_systems_Rev02-6-320.jpg)
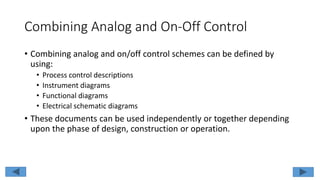
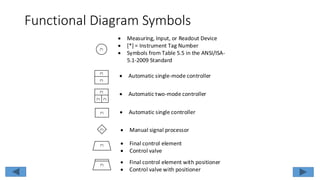
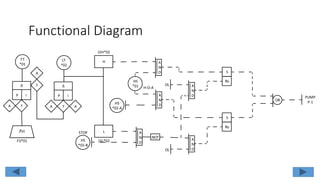
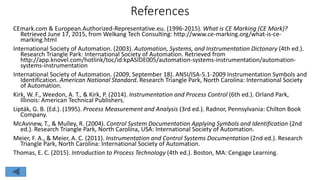
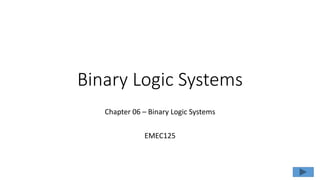
![Functional Diagram Symbols
(*)
Measuring, Input, or Readout Device
[*] = Instrument Tag Number
Symbols from Table 5.5 in the ANSI/ISA-
5.1-2009 Standard
(*)
(*)
Automatic single-mode controller
(*)
(*) (*)
Automatic two-mode controller
(*) Automatic single controller
(*) Manual signal processor
(*) Final control element
Control valve
(*)
Final control element with positioner
Control valve with positioner](https://image.slidesharecdn.com/06chapter06binarylogicsystems-160811205502/85/06-chapter06-binary_logic_systems_Rev02-32-320.jpg)
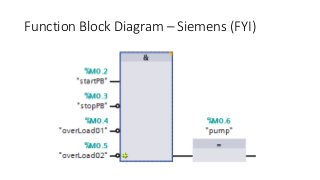
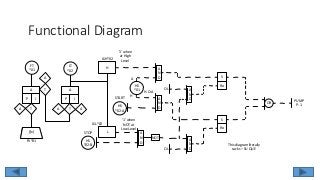
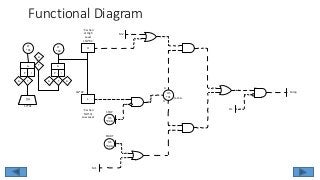


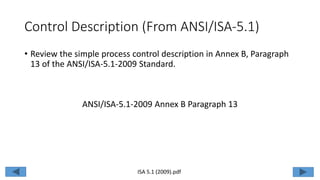
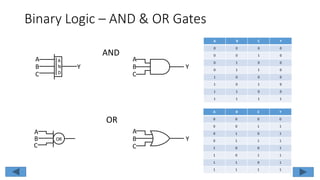
This chapter covers binary logic systems in process control, emphasizing the importance of understanding documentation for various professionals in the field. It includes definitions of key terms, explanations of binary logic operations such as AND, OR, and NOT gates, and discusses their applications in control systems. The chapter also highlights the use of logic diagrams and functional symbols to aid in the design and understanding of safety instrumented systems.


![[03] Chapter02_Logic Design with MOSFETs.ppt](https://cdn.slidesharecdn.com/ss_thumbnails/03chapter02logicdesignwithmosfets-250325080642-9741ed58-thumbnail.jpg?width=640&height=640&fit=bounds)