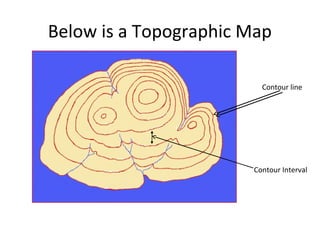
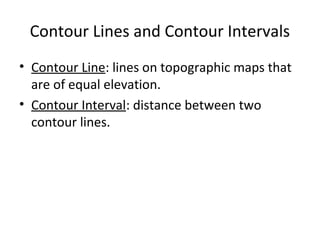
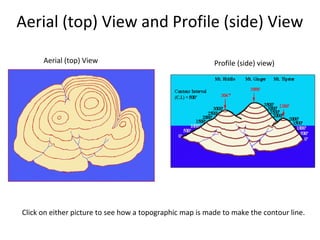
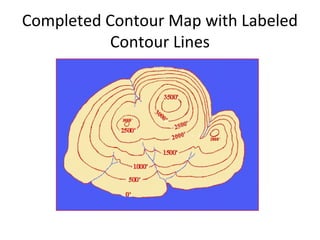
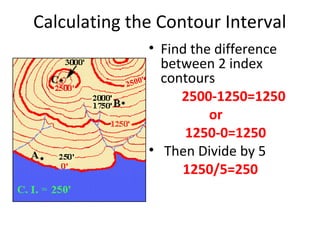
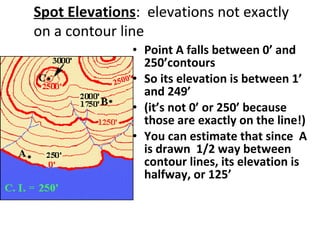
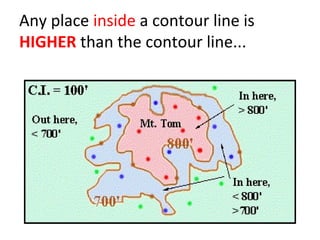
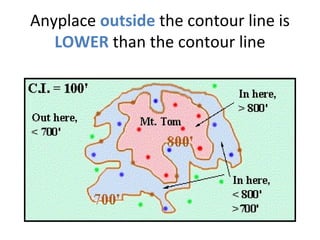
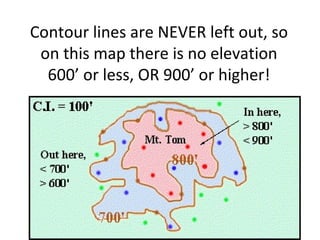
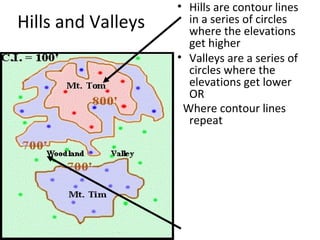
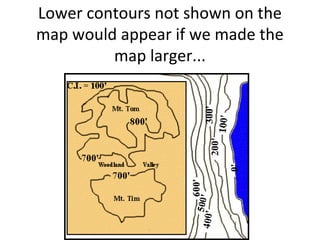
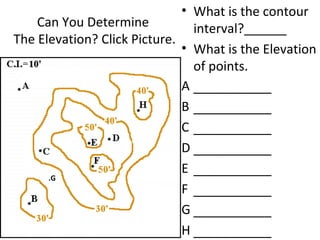
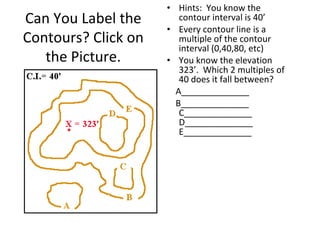
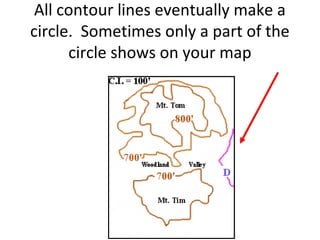
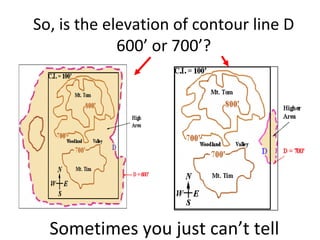
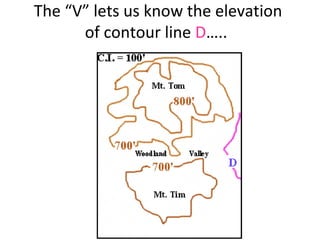
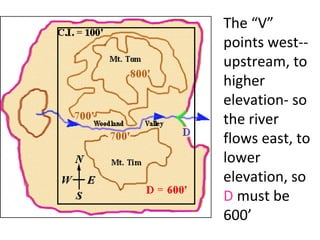
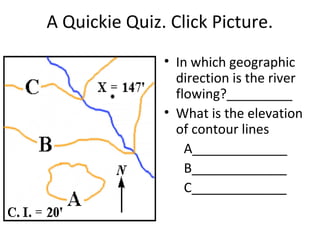
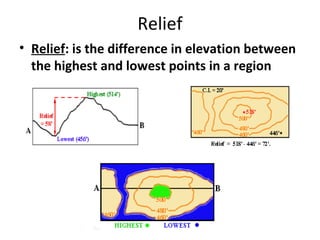
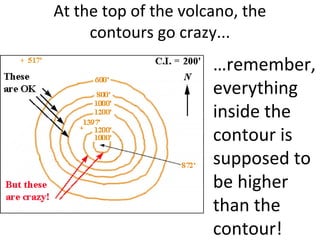
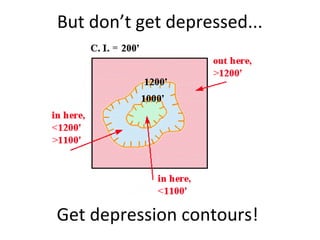
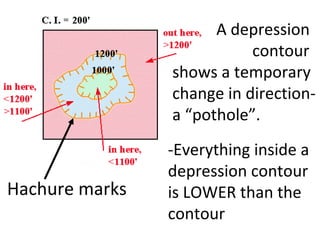
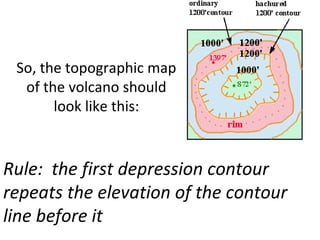
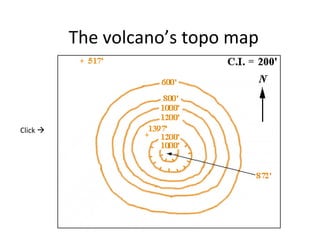
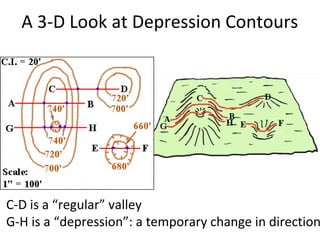
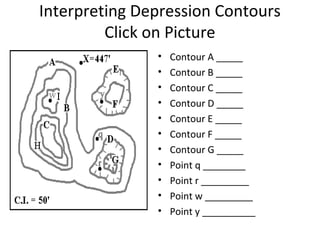
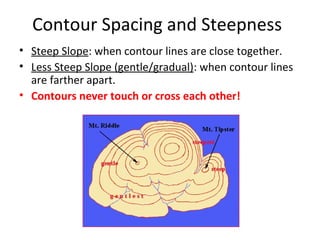
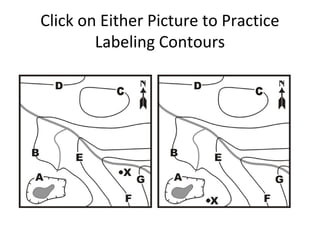
Topographic Maps
Internet Interactive
Below is a Topographic Map
Contour line

Contour Interval
Contour Lines and Contour Intervals
• Contour Line: lines on topographic maps that
are of equal elevation.
• Contour Interval: distance between two
contour lines.
Aerial (top) View and Profile (side) View
Aerial (top) View

Profile (side) view)

Click on either picture to see how a topographic map is made to make the contour line.
Completed Contour Map with Labeled
Contour Lines
Calculating the Contour Interval
• Find the difference
between 2 index
contours
2500-1250=1250
or
1250-0=1250
• Then Divide by 5
1250/5=250
Spot Elevations: elevations not exactly
on a contour line
• Point A falls between 0’ and
250’contours
• So its elevation is between 1’
and 249’
• (it’s not 0’ or 250’ because
those are exactly on the line!)
• You can estimate that since A
is drawn 1/2 way between
contour lines, its elevation is
halfway, or 125’
Any place inside a contour line is
HIGHER than the contour line...
Anyplace outside the contour line is
LOWER than the contour line
Contour lines are NEVER left out, so
on this map there is no elevation
600’ or less, OR 900’ or higher!
Hills and Valleys

• Hills are contour lines
in a series of circles
where the elevations
get higher
• Valleys are a series of
circles where the
elevations get lower
OR
Where contour lines
repeat
Lower contours not shown on the
map would appear if we made the
map larger...
• What is the contour
Can You Determine
interval?______
The Elevation? Click Picture.
• What is the Elevation
of points.
A ___________
B ___________
C ___________
D ___________
E ___________
.G
F ___________
G ___________
H ___________
Can You Label the
Contours? Click on
the Picture.

• Hints: You know the
contour interval is 40’
• Every contour line is a
multiple of the contour
interval (0,40,80, etc)
• You know the elevation
323’. Which 2 multiples of
40 does it fall between?
A______________
B______________
C______________
D______________
E______________
All contour lines eventually make a
circle. Sometimes only a part of the
circle shows on your map
So, is the elevation of contour line D
600’ or 700’?

Sometimes you just can’t tell
Sometimes there is a hint. Water
always flows downhill. There is a
river flowing thru Woodland

Valley. If D was
a hill (700’)then
the river flows
east, because
water can’t flow
uphill
The Rule of V’s
• Water always flows
form higher to lover
elevation
• contour lines make
a “V” shape when
they cross rivers
The point of the V always
points upstream--toward the higher
elevation

This river
is flowing
southwes
t
The V points upstream-and the river
flows the other way!
The “V” lets us know the elevation
of contour line D…..
The “V”
points west-upstream, to
higher
elevation- so
the river
flows east, to
lower
elevation, so
D must be
600’
A Quickie Quiz. Click Picture.
• In which geographic
direction is the river
flowing?_________
• What is the elevation
of contour lines
A_____________
B_____________
C_____________
Relief
• Relief: is the difference in elevation between
the highest and lowest points in a region
No, we’re not done interpreting maps
yet...
Steepness: the closer together the
contour lines, the steeper the slope
Depressed? Got yourself
into a hole?
The volcano, with a crater in the
middle, rises above a flat plain.

C.I.=200’

The highest
elevation is at
the rim of the
crater. The
lowest point
of the volcano
is in the middle of the crater.
At the top of the volcano, the
contours go crazy...

…remember,
everything
inside the
contour is
supposed to
be higher
than the
contour!
But don’t get depressed...

Get depression contours!
A depression
contour
shows a temporary
change in directiona “pothole”.

Hachure marks

-Everything inside a
depression contour
is LOWER than the
contour
So, the topographic map
of the volcano should
look like this:

Rule: the first depression contour
repeats the elevation of the contour
line before it
The volcano’s topo map

Click 
A 3-D Look at Depression Contours

C-D is a “regular” valley
G-H is a “depression”: a temporary change in direction
Interpreting Depression Contours
Click on Picture
•
•
•
•
•
•
•
•
•
•
•

Contour A _____
Contour B _____
Contour C _____
Contour D _____
Contour E _____
Contour F _____
Contour G _____
Point q ________
Point r _________
Point w _________
Point y __________
Contour Spacing and Steepness
• Steep Slope: when contour lines are close together.
• Less Steep Slope (gentle/gradual): when contour lines
are farther apart.
• Contours never touch or cross each other!
Steep and Gentle Slopes

Profile (side) view of an island

Aerial view of island showing contour lines
Closer together on the steepest side
Gradient
•
•
•
•
•
•
•

Gradient tells you how steep your route is!
It is the difference in elevation (ED) divided by the horizontal distance (HD):
 GRADIENT = ED/HD
Take a look at this example:
The vertical distance (here, the difference in elevation between points 'A' and
'B') = 10,000 feet
The horizontal distance from 'A' to 'B' = 5 miles
Gradient = vertical distance (elevation difference (ED)) divided by horizontal
distance (HD)
The GRADIENT is 2000 feet per mile (10,000 feet divided by 5 miles)
Other Gradient Examples
Gradient Quiz Instructions
Click Picture to Take Quiz
•
•
•
•
•
•
•
•
•
•
•
•
•
•
•
•
•
•
•

GRADIENT QUIZ INSTRUCTIONS
In the menu bar under "Select Line", click on "Scale".
Click on the "Measure Line" button. A ruler will appear on the map.
In the text box next to the question "One inch on map is equal to how many
miles?", type in your answer and click on the red check mark.
Look in the bottom right 'response text area' for a response to your input.
If your answer is not correct, follow the hint and try again.
If the response is "Correct!", go to the menu bar again and click on "Line A-C".
Then, click on "Measure Line."
Next, input an answer to indicate the "Distance on Map" and click on the red check
mark.
If your answer is not correct, follow the hint and try again.
If the response is "Correct!", input an answer to indicate "Actual Distance" and click
on the red check mark.
If your answer is not correct, follow the hint and try again.
If the response is "Correct!", input an answer to indicate "Elevation Difference" and
click on the red check mark.
If your answer is not correct, follow the hint and try again.
If the response is "Correct!", input an answer to indicate "Gradient" and click on
the red check mark.
If your answer is not correct, follow the hint and try again.
If the response is "Correct!", input an answer to indicate which of the illustrated
lines has a slope similar to the line whose gradient you have calculated. Then, click
on the red check mark.
If your answer is not correct, follow the hint and try again.
If your answer is correct, go to the menu bar and select the next line to work with.
For curved lines, a straightened line and a ruler will appear in the box under the
map
© 2002
Wayne G. Powell and David J. Leveson
Click on Either Picture to Practice
Labeling Contours
NOW...

We’re Done!
References
• http://academic.brooklyn.cuny.edu/geology/l
eveson/core/linksa/maptop.html

Topographic Maps

  • 1.
  • 2.
    Below is aTopographic Map Contour line Contour Interval
  • 3.
    Contour Lines andContour Intervals • Contour Line: lines on topographic maps that are of equal elevation. • Contour Interval: distance between two contour lines.
  • 4.
    Aerial (top) Viewand Profile (side) View Aerial (top) View Profile (side) view) Click on either picture to see how a topographic map is made to make the contour line.
  • 5.
    Completed Contour Mapwith Labeled Contour Lines
  • 6.
    Calculating the ContourInterval • Find the difference between 2 index contours 2500-1250=1250 or 1250-0=1250 • Then Divide by 5 1250/5=250
  • 7.
    Spot Elevations: elevationsnot exactly on a contour line • Point A falls between 0’ and 250’contours • So its elevation is between 1’ and 249’ • (it’s not 0’ or 250’ because those are exactly on the line!) • You can estimate that since A is drawn 1/2 way between contour lines, its elevation is halfway, or 125’
  • 8.
    Any place insidea contour line is HIGHER than the contour line...
  • 9.
    Anyplace outside thecontour line is LOWER than the contour line
  • 10.
    Contour lines areNEVER left out, so on this map there is no elevation 600’ or less, OR 900’ or higher!
  • 11.
    Hills and Valleys •Hills are contour lines in a series of circles where the elevations get higher • Valleys are a series of circles where the elevations get lower OR Where contour lines repeat
  • 12.
    Lower contours notshown on the map would appear if we made the map larger...
  • 13.
    • What isthe contour Can You Determine interval?______ The Elevation? Click Picture. • What is the Elevation of points. A ___________ B ___________ C ___________ D ___________ E ___________ .G F ___________ G ___________ H ___________
  • 14.
    Can You Labelthe Contours? Click on the Picture. • Hints: You know the contour interval is 40’ • Every contour line is a multiple of the contour interval (0,40,80, etc) • You know the elevation 323’. Which 2 multiples of 40 does it fall between? A______________ B______________ C______________ D______________ E______________
  • 15.
    All contour lineseventually make a circle. Sometimes only a part of the circle shows on your map
  • 16.
    So, is theelevation of contour line D 600’ or 700’? Sometimes you just can’t tell
  • 17.
    Sometimes there isa hint. Water always flows downhill. There is a river flowing thru Woodland Valley. If D was a hill (700’)then the river flows east, because water can’t flow uphill
  • 18.
    The Rule ofV’s • Water always flows form higher to lover elevation • contour lines make a “V” shape when they cross rivers
  • 19.
    The point ofthe V always points upstream--toward the higher elevation This river is flowing southwes t
  • 20.
    The V pointsupstream-and the river flows the other way!
  • 21.
    The “V” letsus know the elevation of contour line D…..
  • 22.
    The “V” points west-upstream,to higher elevation- so the river flows east, to lower elevation, so D must be 600’
  • 23.
    A Quickie Quiz.Click Picture. • In which geographic direction is the river flowing?_________ • What is the elevation of contour lines A_____________ B_____________ C_____________
  • 24.
    Relief • Relief: isthe difference in elevation between the highest and lowest points in a region
  • 25.
    No, we’re notdone interpreting maps yet...
  • 26.
    Steepness: the closertogether the contour lines, the steeper the slope
  • 27.
  • 28.
    The volcano, witha crater in the middle, rises above a flat plain. C.I.=200’ The highest elevation is at the rim of the crater. The lowest point of the volcano is in the middle of the crater.
  • 29.
    At the topof the volcano, the contours go crazy... …remember, everything inside the contour is supposed to be higher than the contour!
  • 30.
    But don’t getdepressed... Get depression contours!
  • 31.
    A depression contour shows atemporary change in directiona “pothole”. Hachure marks -Everything inside a depression contour is LOWER than the contour
  • 32.
    So, the topographicmap of the volcano should look like this: Rule: the first depression contour repeats the elevation of the contour line before it
  • 33.
    The volcano’s topomap Click 
  • 34.
    A 3-D Lookat Depression Contours C-D is a “regular” valley G-H is a “depression”: a temporary change in direction
  • 35.
    Interpreting Depression Contours Clickon Picture • • • • • • • • • • • Contour A _____ Contour B _____ Contour C _____ Contour D _____ Contour E _____ Contour F _____ Contour G _____ Point q ________ Point r _________ Point w _________ Point y __________
  • 36.
    Contour Spacing andSteepness • Steep Slope: when contour lines are close together. • Less Steep Slope (gentle/gradual): when contour lines are farther apart. • Contours never touch or cross each other!
  • 37.
    Steep and GentleSlopes Profile (side) view of an island Aerial view of island showing contour lines Closer together on the steepest side
  • 38.
    Gradient • • • • • • • Gradient tells youhow steep your route is! It is the difference in elevation (ED) divided by the horizontal distance (HD):  GRADIENT = ED/HD Take a look at this example: The vertical distance (here, the difference in elevation between points 'A' and 'B') = 10,000 feet The horizontal distance from 'A' to 'B' = 5 miles Gradient = vertical distance (elevation difference (ED)) divided by horizontal distance (HD) The GRADIENT is 2000 feet per mile (10,000 feet divided by 5 miles)
  • 39.
  • 40.
    Gradient Quiz Instructions ClickPicture to Take Quiz • • • • • • • • • • • • • • • • • • • GRADIENT QUIZ INSTRUCTIONS In the menu bar under "Select Line", click on "Scale". Click on the "Measure Line" button. A ruler will appear on the map. In the text box next to the question "One inch on map is equal to how many miles?", type in your answer and click on the red check mark. Look in the bottom right 'response text area' for a response to your input. If your answer is not correct, follow the hint and try again. If the response is "Correct!", go to the menu bar again and click on "Line A-C". Then, click on "Measure Line." Next, input an answer to indicate the "Distance on Map" and click on the red check mark. If your answer is not correct, follow the hint and try again. If the response is "Correct!", input an answer to indicate "Actual Distance" and click on the red check mark. If your answer is not correct, follow the hint and try again. If the response is "Correct!", input an answer to indicate "Elevation Difference" and click on the red check mark. If your answer is not correct, follow the hint and try again. If the response is "Correct!", input an answer to indicate "Gradient" and click on the red check mark. If your answer is not correct, follow the hint and try again. If the response is "Correct!", input an answer to indicate which of the illustrated lines has a slope similar to the line whose gradient you have calculated. Then, click on the red check mark. If your answer is not correct, follow the hint and try again. If your answer is correct, go to the menu bar and select the next line to work with. For curved lines, a straightened line and a ruler will appear in the box under the map © 2002 Wayne G. Powell and David J. Leveson
  • 41.
    Click on EitherPicture to Practice Labeling Contours
  • 42.
  • 43.