Downloaded 290 times

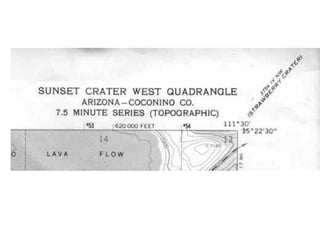
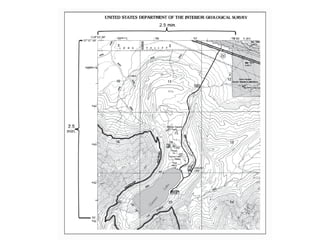
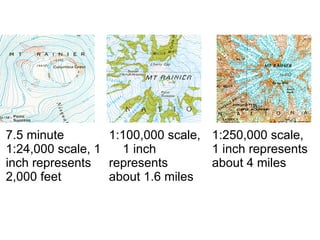
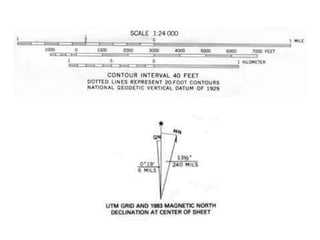
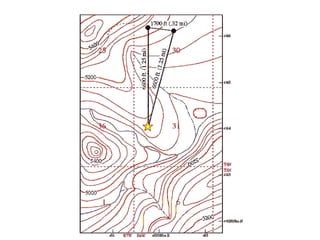


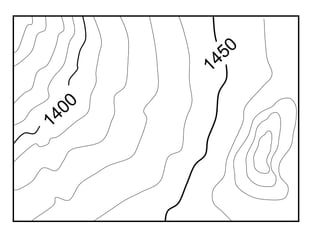
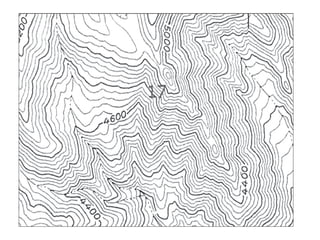
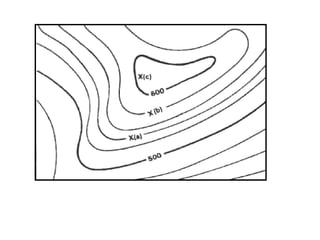
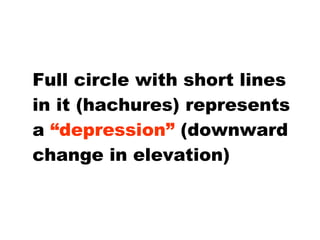
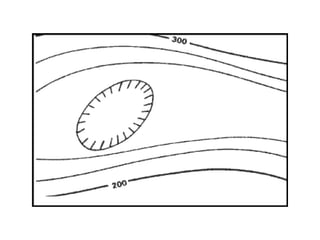
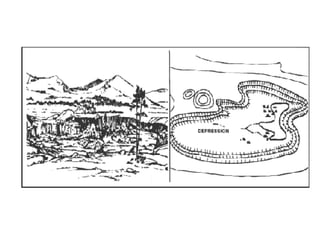
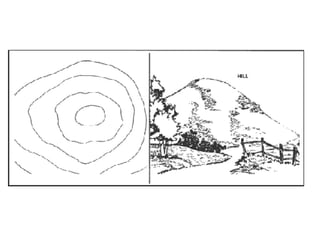
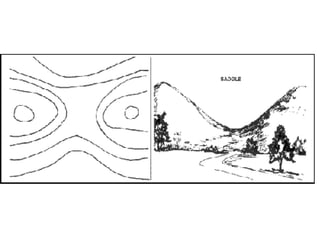
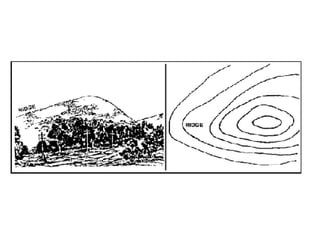
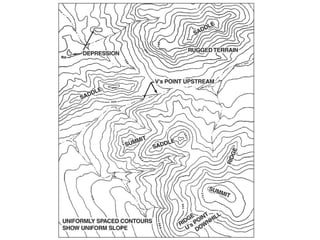
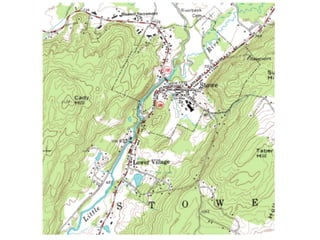
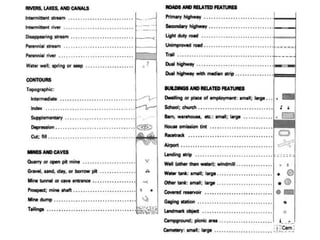
Topographic maps show physical characteristics of an area such as rivers, streams, mountains, roads, and man-made structures. They use contour lines to indicate elevation and slope of the land, with closer lines representing a steeper slope. Elevation is noted in feet or meters and contour intervals show the change in elevation between lines. Features such as hills, summits, and depressions are represented symbolically.