Downloaded 114 times
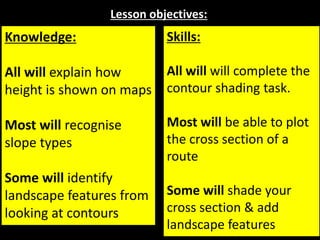
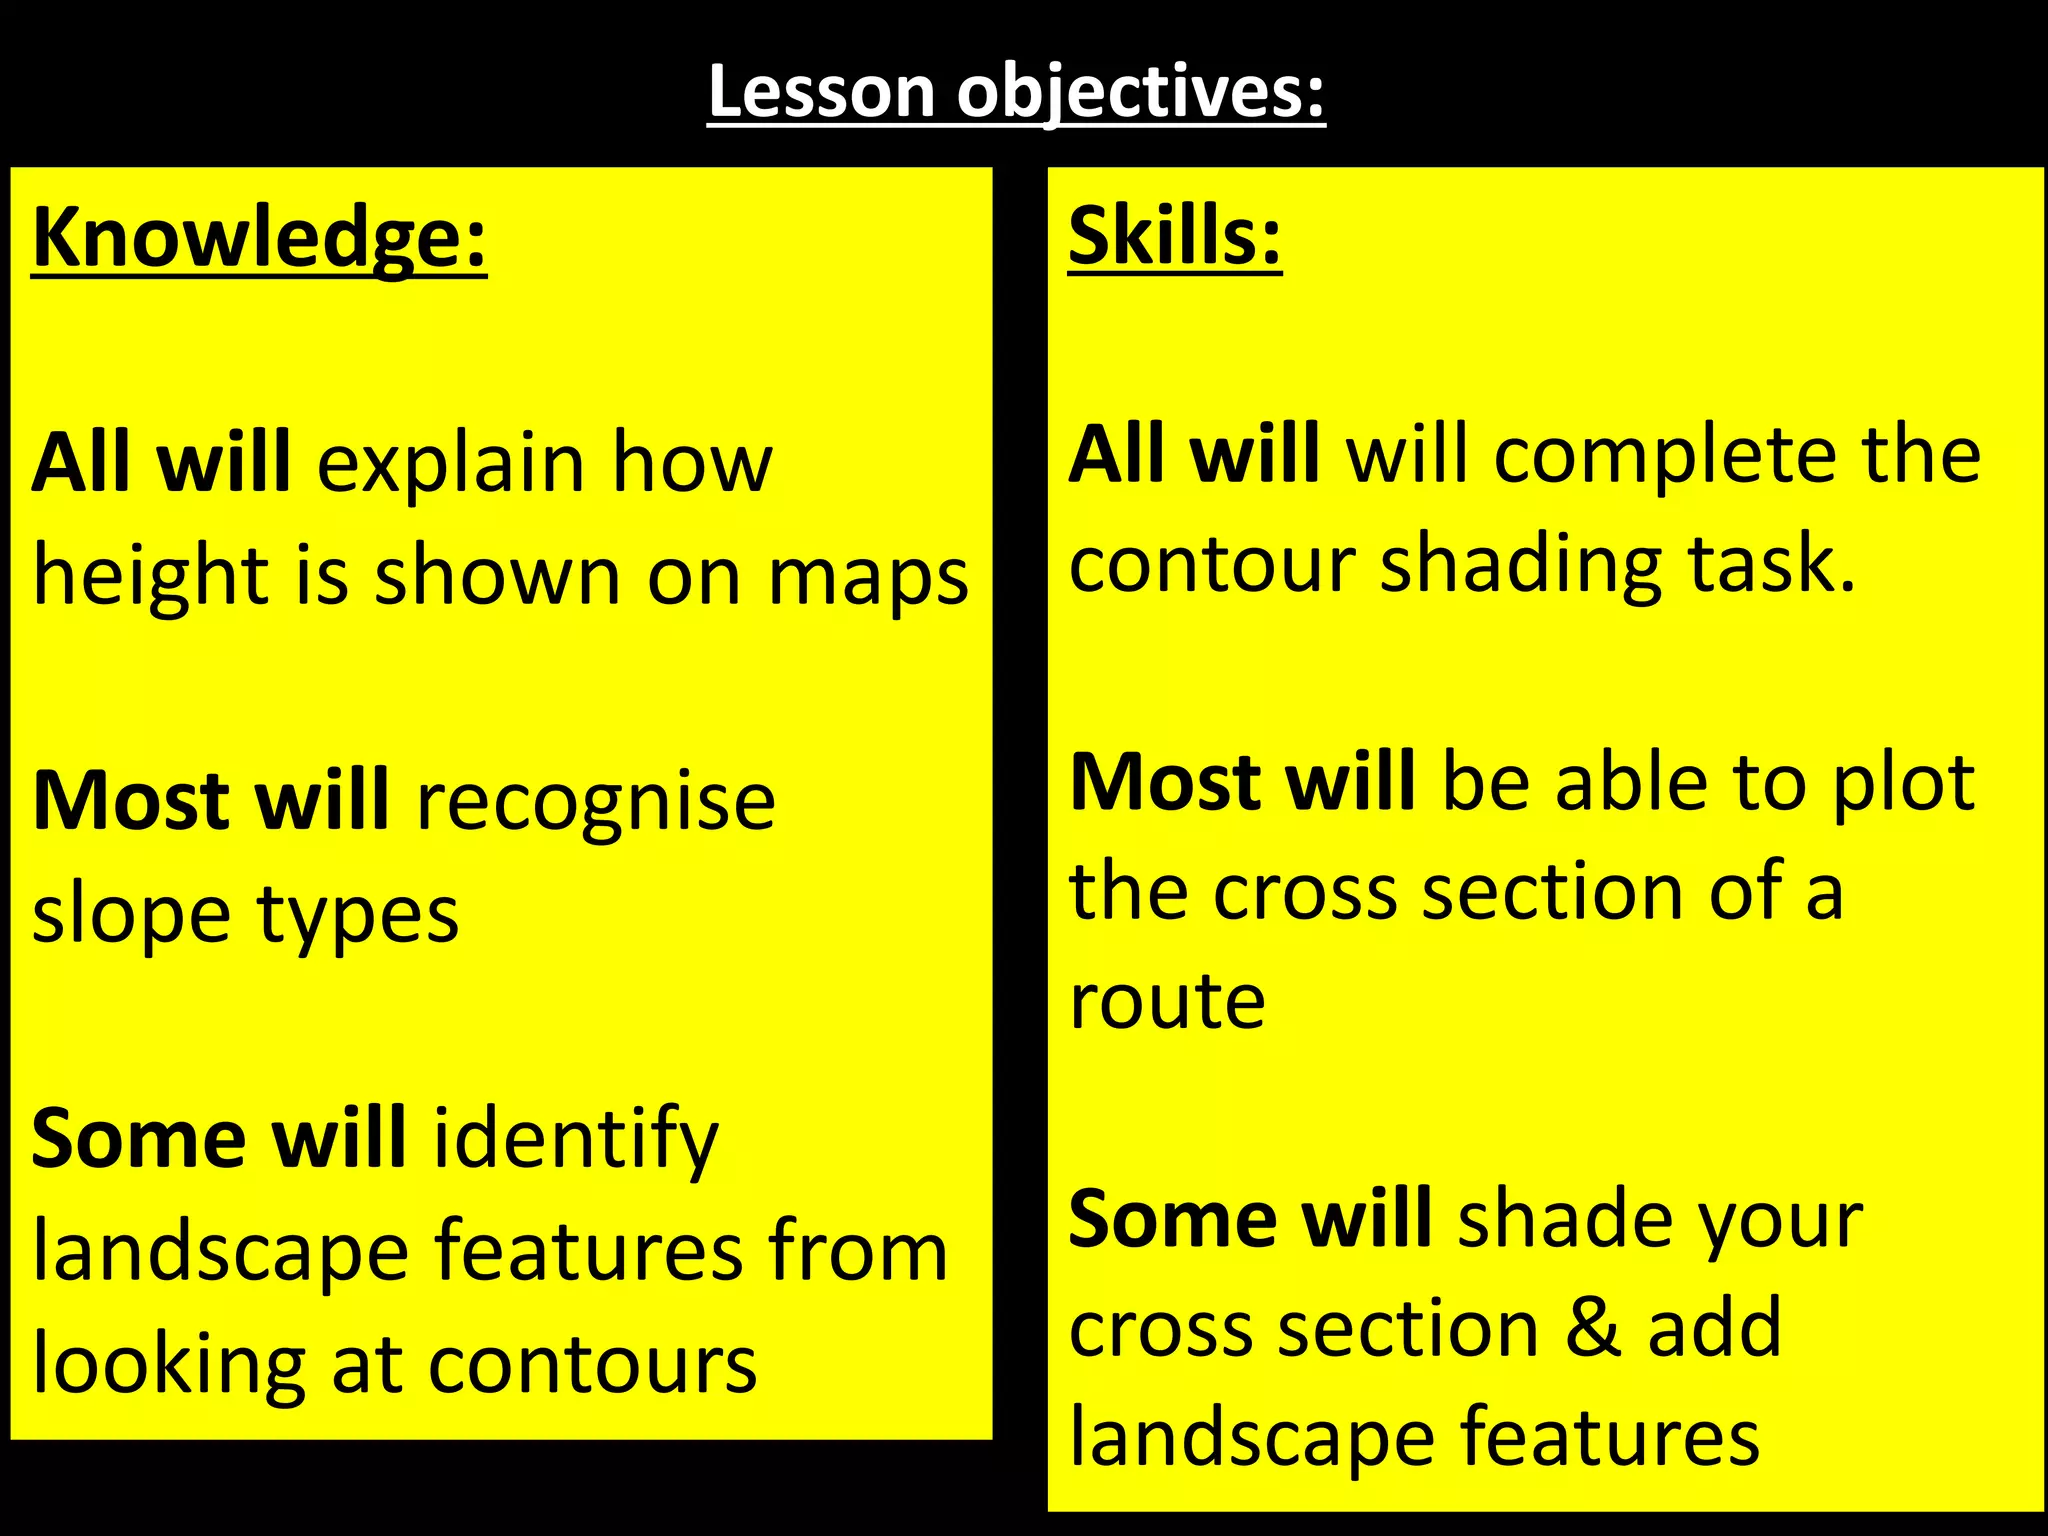
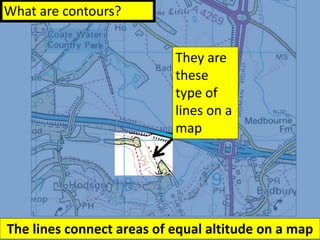


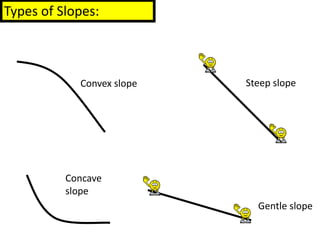
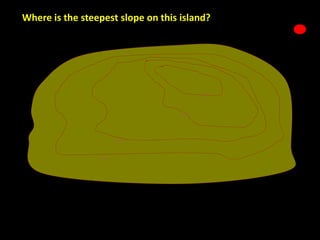
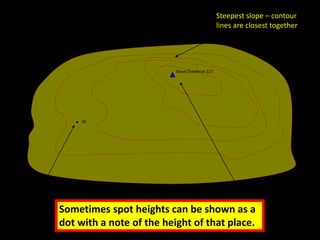
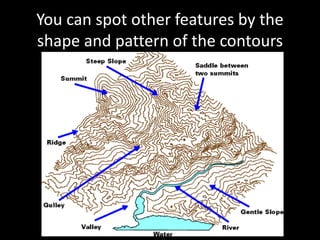
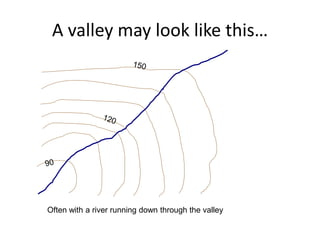
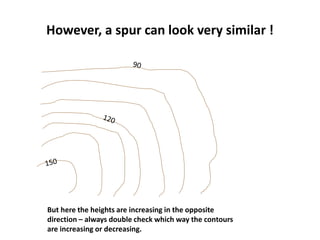
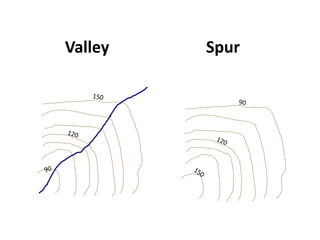
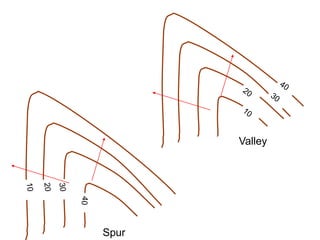
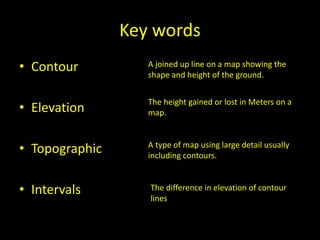
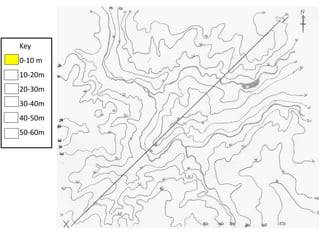
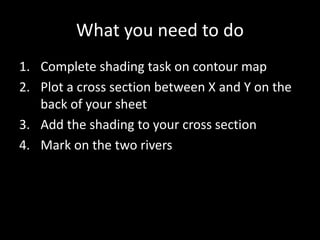

The document outlines lesson objectives focused on understanding contours on maps, including plotting cross sections and identifying landscape features. It explains how contour lines represent elevation and slope, with instructions for shading areas of equal height on a map. The lesson also emphasizes key terms and concepts such as gradient, topographic maps, and the importance of recognizing different slope types.


