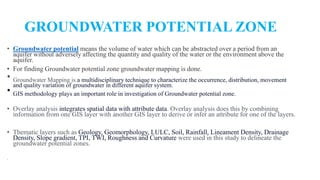
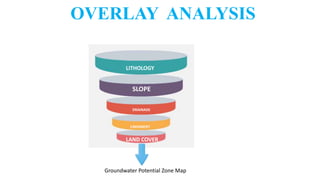
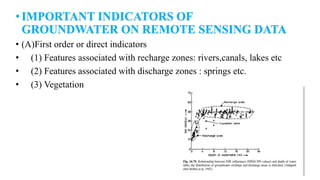
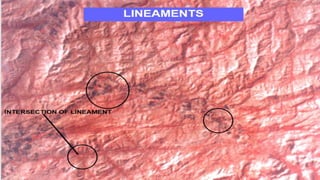
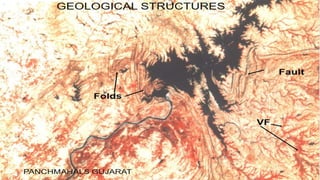
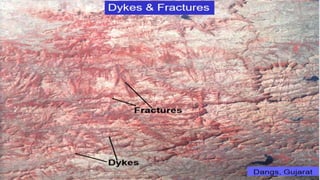
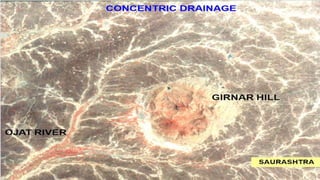
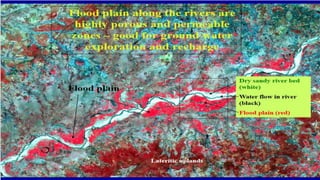
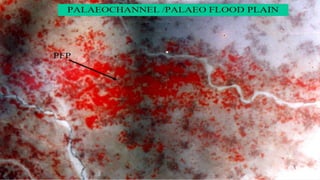
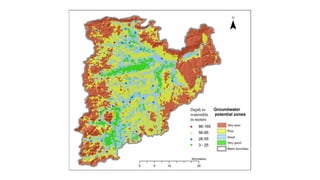
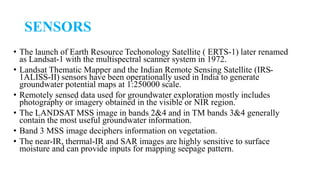
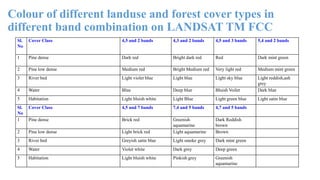
APPLICATION OF REMOTE SENSING IN
GROUND WATER EXPLORATION
BY-ANKITA DASH
M.Sc FIRST YEAR
ROLL-22GEOL002
CONTENT
• Introduction
• Water resources of India at a glance
• Hydrogeological cycle
• Exploration of groundwater
• Groundwater potential zone
• Indicators
• Sensors
• Rules for selection of imagery
• Conclusion
• Reference
• Water is the most vital material for mankind and regions with easy
availability of water have always been more prosperous.
• Ground water hydrology may be defined as the science of the occurrence ,
distribution and movement of water below the surface of the earth.
• Due to over exploitation of surface water for different purposes , demand
on groundwater has increased many folds.
• Remote sensing is the most advanced space technology is being widely
used for exploration and management of natural resources which is both
time and cost effective.
HYDROGEOLOGICAL CYCLE
GROUNDWATER POTENTIAL ZONE
• Groundwater potential means the volume of water which can be abstracted over a period from an
aquifer without adversely affecting the quantity and quality of the water or the environment above the
aquifer.
• For finding Groundwater potential zone groundwater mapping is done.
• Groundwater Mapping is a multidisciplinary technique to characterize the occurrence, distribution, movement
and quality variation of groundwater in different aquifer system.
• GIS methodology plays an important role in investigation of Groundwater potential zone.
• Overlay analysis integrates spatial data with attribute data. Overlay analysis does this by combining
information from one GIS layer with another GIS layer to derive or infer an attribute for one of the layers.
• Thematic layers such as Geology, Geomorphology, LULC, Soil, Rainfall, Lineament Density, Drainage
Density, Slope gradient, TPI, TWI, Roughness and Curvature were used in this study to delineate the
groundwater potential zones.
.
OVERLAY ANALYSIS
Groundwater Potential Zone Map
LITHOLOGY
SLOPE
DRAINAGE
LINEAMENT
LAND COVER
•IMPORTANT INDICATORS OF
GROUNDWATER ON REMOTE SENSING DATA
• (A)First order or direct indicators
• (1) Features associated with recharge zones: rivers,canals, lakes etc
• (2) Features associated with discharge zones : springs etc.
• (3) Vegetation
• (B) SECOND ORDER OR INDIRECT INDICATORS
• (1) Topographic features and general surface gradient
• (2) Landforms
• (3) Depth of weathering and regolith
• (4) Lithology : hard rock and soft rock
• (5) Geological structure
• (6) Lineaments, joints and fractures
• (7) Faults and shear zones
• (8) Soil types
• (9) Soil moisture
• (10) Vegetation
• (11) Drainage characteristics
• (12) Special geological features such as karst, alluvial fans,dykes and
reefs,unconformities, buried channels, salts encrustation etc.
•
SENSORS
• The launch of Earth Resource Techonology Satellite ( ERTS-1) later renamed
as Landsat-1 with the multispectral scanner system in 1972.
• Landsat Thematic Mapper and the Indian Remote Sensing Satellite (IRS-
1ALISS-II) sensors have been operationally used in India to generate
groundwater potential maps at 1:250000 scale.
• Remotely sensed data used for groundwater exploration mostly includes
photography or imagery obtained in the visible or NIR region.
• The LANDSAT MSS image in bands 2&4 and in TM bands 3&4 generally
contain the most useful groundwater information.
• Band 3 MSS image deciphers information on vegetation.
• The near-IR, thermal-IR and SAR images are highly sensitive to surface
moisture and can provide inputs for mapping seepage pattern.
• Radar imagery, particularly microwave sensing data can provide
information on the presence of moisture or at shallow depths below the
surface.
• High resolution IRS FCC data at 1:50000 and PAN data on 1:12500
scale is of much help in mapping of cannal network surface water
bodies,flood areas etc, which play an important role in the assessment
of recharge parameters.
• Monitoring of surface water in pre-monsoon & post-monsoon indicates
good correlation with rainfall.
RULES FOR THE SELECTION OF
IMAGERY
• Select scenes with low sun angle. Landforms and general topography
are enhanced by topographic shadowing when the scene angle is
relatively low (less then 45)
• Select black and white imagery in infrared or middle infrared region
for delineating landscape features without being composed by
vegetation tone.
• Select atleast one FCC showing landforms and drainage pattern and
maximise the difference between types of vegetation.The vegetation
patterns and brightness are clues to the location and proximity of
groundwater. Dry season scenes will show phreatophytes as bright
red,whereas plants without adequate moisture will appear as dull red
or brown.
• Select two black and white images of the same area ,acquired from
different orbits. Using these images , stereographic view of the study
area can be produced .
• Orbital drift or cutting the scenes from slightly different locations
along the orbital track provides the stereoscopic effect.
• Select one scene for pre-monsoon and another for post monsoon
periods in order to note the change of landforms , vegetative cover and
drainage .This is particularly useful for a terrain full of alluvial
features.
Sl.No Water Pollutant/Quality Parameters Useful sensors
1 Salt water Intrusion CIR,TIR
2 Suspended Solids V,C,TIR
3 Chlorophyll,phytoplankton(biological contaminants) C,CIR,TIR
4 Aquatic vegetation V,CIR,IR
5 Temperature TIR,MW
6 Oil spills/seeps UV(Video),TIR,MW
7 Salinity CIR,TIR,MW
8 Waste effluents CIR,TIR
9 Pollution related to agriculture,forestry,mining and
land development activities.
V,C,CIR
10 Radioactive Waste GRS
Sl.
No
Cover Class 4,5 and 2 bands 4,3 and 2 bands 4,5 and 3 bands 5,4 and 2 bands
1 Pine dense Dark red Bright dark red Red Dark mint green
2 Pine low dense Medium red Bright Medium red Very light red Medium mint green
3 River bed Light violet blue Light blue Light sky blue Light reddish,ash
grey
4 Water Blue Deep blue Bluish Voilet Dark blue
5 Habitation Light bluish white Light Blue Light green blue Light satin blue
Sl.
No
Cover Class 4,5 and 7 bands 7,4 and 5 bands 4,7 and 5 bands
1 Pine dense Brick red Greenish
aquamarine
Dark Reddish
brown
2 Pine low dense Light brick red Light aquamarine Brown
3 River bed Greyish satin blue Light smoke grey Dark mint green
4 Water Violet white Dark grey Deep green
5 Habitation Light bluish white Pinkish grey Greenish
aquamarine
Colour of different landuse and forest cover types in
different band combination on LANDSAT TM FCC
CONCLUSION
• Remote sensing data provides a highly sophisticated tool for
delineating potential groundwater zones.
• The information proves to be of importance in regional groundwater
exploration scheme and can reduce the cost and time involved in
exploration procedures .
• In this country more and more organizations are adopting this
technique and it will become an indispensable tool in the
exploration,development and management of water resources.
REFERENCE
• Remote Sensing Geology by Ravi P. Gupta, Springer publication
• Textbook on Remote Sensing in natural resources monitoring and
management by C.S.Agarwal & P.K. Garg , Wheeler publication
THANK YOU

REMOTE SENSING IN GROUNDWATER.pptx

  • 1.
    APPLICATION OF REMOTESENSING IN GROUND WATER EXPLORATION BY-ANKITA DASH M.Sc FIRST YEAR ROLL-22GEOL002
  • 2.
    CONTENT • Introduction • Waterresources of India at a glance • Hydrogeological cycle • Exploration of groundwater • Groundwater potential zone • Indicators • Sensors • Rules for selection of imagery • Conclusion • Reference
  • 3.
    • Water isthe most vital material for mankind and regions with easy availability of water have always been more prosperous. • Ground water hydrology may be defined as the science of the occurrence , distribution and movement of water below the surface of the earth. • Due to over exploitation of surface water for different purposes , demand on groundwater has increased many folds. • Remote sensing is the most advanced space technology is being widely used for exploration and management of natural resources which is both time and cost effective.
  • 4.
  • 5.
    GROUNDWATER POTENTIAL ZONE •Groundwater potential means the volume of water which can be abstracted over a period from an aquifer without adversely affecting the quantity and quality of the water or the environment above the aquifer. • For finding Groundwater potential zone groundwater mapping is done. • Groundwater Mapping is a multidisciplinary technique to characterize the occurrence, distribution, movement and quality variation of groundwater in different aquifer system. • GIS methodology plays an important role in investigation of Groundwater potential zone. • Overlay analysis integrates spatial data with attribute data. Overlay analysis does this by combining information from one GIS layer with another GIS layer to derive or infer an attribute for one of the layers. • Thematic layers such as Geology, Geomorphology, LULC, Soil, Rainfall, Lineament Density, Drainage Density, Slope gradient, TPI, TWI, Roughness and Curvature were used in this study to delineate the groundwater potential zones. .
  • 6.
    OVERLAY ANALYSIS Groundwater PotentialZone Map LITHOLOGY SLOPE DRAINAGE LINEAMENT LAND COVER
  • 7.
    •IMPORTANT INDICATORS OF GROUNDWATERON REMOTE SENSING DATA • (A)First order or direct indicators • (1) Features associated with recharge zones: rivers,canals, lakes etc • (2) Features associated with discharge zones : springs etc. • (3) Vegetation
  • 8.
    • (B) SECONDORDER OR INDIRECT INDICATORS • (1) Topographic features and general surface gradient • (2) Landforms • (3) Depth of weathering and regolith • (4) Lithology : hard rock and soft rock • (5) Geological structure • (6) Lineaments, joints and fractures • (7) Faults and shear zones • (8) Soil types • (9) Soil moisture • (10) Vegetation • (11) Drainage characteristics • (12) Special geological features such as karst, alluvial fans,dykes and reefs,unconformities, buried channels, salts encrustation etc. •
  • 16.
    SENSORS • The launchof Earth Resource Techonology Satellite ( ERTS-1) later renamed as Landsat-1 with the multispectral scanner system in 1972. • Landsat Thematic Mapper and the Indian Remote Sensing Satellite (IRS- 1ALISS-II) sensors have been operationally used in India to generate groundwater potential maps at 1:250000 scale. • Remotely sensed data used for groundwater exploration mostly includes photography or imagery obtained in the visible or NIR region. • The LANDSAT MSS image in bands 2&4 and in TM bands 3&4 generally contain the most useful groundwater information. • Band 3 MSS image deciphers information on vegetation. • The near-IR, thermal-IR and SAR images are highly sensitive to surface moisture and can provide inputs for mapping seepage pattern.
  • 17.
    • Radar imagery,particularly microwave sensing data can provide information on the presence of moisture or at shallow depths below the surface. • High resolution IRS FCC data at 1:50000 and PAN data on 1:12500 scale is of much help in mapping of cannal network surface water bodies,flood areas etc, which play an important role in the assessment of recharge parameters. • Monitoring of surface water in pre-monsoon & post-monsoon indicates good correlation with rainfall.
  • 18.
    RULES FOR THESELECTION OF IMAGERY • Select scenes with low sun angle. Landforms and general topography are enhanced by topographic shadowing when the scene angle is relatively low (less then 45) • Select black and white imagery in infrared or middle infrared region for delineating landscape features without being composed by vegetation tone. • Select atleast one FCC showing landforms and drainage pattern and maximise the difference between types of vegetation.The vegetation patterns and brightness are clues to the location and proximity of groundwater. Dry season scenes will show phreatophytes as bright red,whereas plants without adequate moisture will appear as dull red or brown.
  • 19.
    • Select twoblack and white images of the same area ,acquired from different orbits. Using these images , stereographic view of the study area can be produced . • Orbital drift or cutting the scenes from slightly different locations along the orbital track provides the stereoscopic effect. • Select one scene for pre-monsoon and another for post monsoon periods in order to note the change of landforms , vegetative cover and drainage .This is particularly useful for a terrain full of alluvial features.
  • 20.
    Sl.No Water Pollutant/QualityParameters Useful sensors 1 Salt water Intrusion CIR,TIR 2 Suspended Solids V,C,TIR 3 Chlorophyll,phytoplankton(biological contaminants) C,CIR,TIR 4 Aquatic vegetation V,CIR,IR 5 Temperature TIR,MW 6 Oil spills/seeps UV(Video),TIR,MW 7 Salinity CIR,TIR,MW 8 Waste effluents CIR,TIR 9 Pollution related to agriculture,forestry,mining and land development activities. V,C,CIR 10 Radioactive Waste GRS
  • 21.
    Sl. No Cover Class 4,5and 2 bands 4,3 and 2 bands 4,5 and 3 bands 5,4 and 2 bands 1 Pine dense Dark red Bright dark red Red Dark mint green 2 Pine low dense Medium red Bright Medium red Very light red Medium mint green 3 River bed Light violet blue Light blue Light sky blue Light reddish,ash grey 4 Water Blue Deep blue Bluish Voilet Dark blue 5 Habitation Light bluish white Light Blue Light green blue Light satin blue Sl. No Cover Class 4,5 and 7 bands 7,4 and 5 bands 4,7 and 5 bands 1 Pine dense Brick red Greenish aquamarine Dark Reddish brown 2 Pine low dense Light brick red Light aquamarine Brown 3 River bed Greyish satin blue Light smoke grey Dark mint green 4 Water Violet white Dark grey Deep green 5 Habitation Light bluish white Pinkish grey Greenish aquamarine Colour of different landuse and forest cover types in different band combination on LANDSAT TM FCC
  • 22.
    CONCLUSION • Remote sensingdata provides a highly sophisticated tool for delineating potential groundwater zones. • The information proves to be of importance in regional groundwater exploration scheme and can reduce the cost and time involved in exploration procedures . • In this country more and more organizations are adopting this technique and it will become an indispensable tool in the exploration,development and management of water resources.
  • 23.
    REFERENCE • Remote SensingGeology by Ravi P. Gupta, Springer publication • Textbook on Remote Sensing in natural resources monitoring and management by C.S.Agarwal & P.K. Garg , Wheeler publication
  • 24.