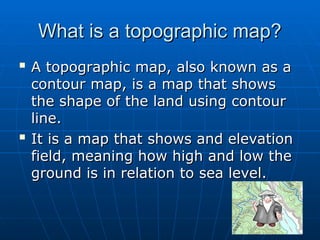
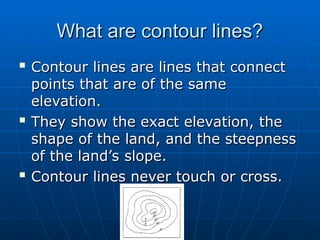
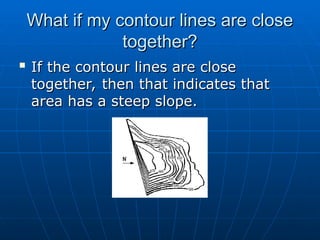
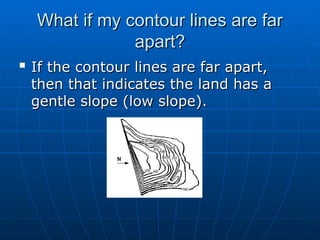
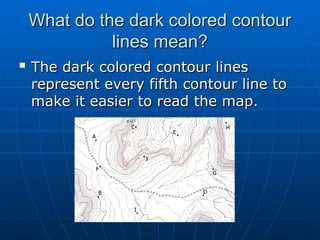
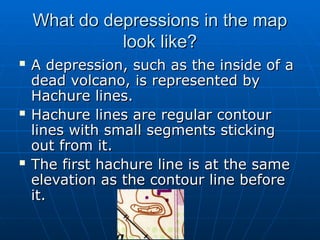
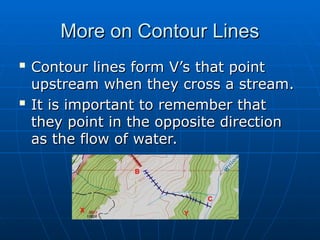
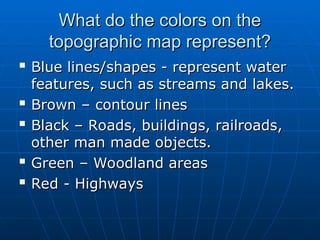
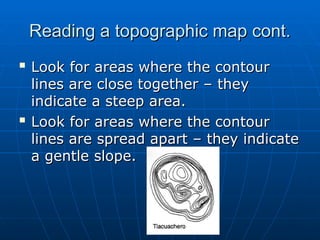
Topographic Maps
Topographic Maps
T. Bates
T. Bates
Hugo A. Owens Middle School
Lesson Objectives
Lesson Objectives

Define a topographic map and state
its uses.
its uses.

Describe how contour lines show the
elevations, shape, and slope of the
land.
land.

Identify the meanings of some
symbols and colors used on
topographic maps.
topographic maps.
What is a topographic map?

A topographic map, also known as a
contour map, is a map that shows
the shape of the land using contour
line.
line.

It is a map that shows and elevation
field, meaning how high and low the
ground is in relation to sea level.
What are contour lines?

Contour lines are lines that connect
points that are of the same
elevation.
elevation.

They show the exact elevation, the
shape of the land, and the steepness
of the land’s slope.

Contour lines never touch or cross.
What is a benchmark?

A benchmark is a point where exact
elevation is known and is marked
with a brass or aluminum plate. It is
marked BM on the map with the
elevation numbers given in feet.

Benchmarks are useful to help
determine contour lines.
Other Topographic Terms

Map scale – compares distances on
the map with distances on earth.

Legend – explains symbols used on
the map.
the map.

Index contours – contour lines that
are labeled to help you find the
contour interval.
contour interval.
What is a contour interval?

A contour interval is the difference in
elevation between two contour lines
that are side by side.

Remember that a contour interval is
not the distance between the two
lines – to get the distance you need
to use the map scale.
What if my contour lines are close
together?
together?

If the contour lines are close
together, then that indicates that
area has a steep slope.
What if my contour lines are far
apart?
apart?

If the contour lines are far apart,
then that indicates the land has a
gentle slope (low slope).
What do the dark colored contour
lines mean?
lines mean?

The dark colored contour lines
represent every fifth contour line to
make it easier to read the map.
What do depressions in the map
look like?
look like?
 A depression, such as the inside of a
A depression, such as the inside of a
dead volcano, is represented by
Hachure lines.
Hachure lines.
 Hachure lines are regular contour
Hachure lines are regular contour
lines with small segments sticking
out from it.
out from it.
 The first hachure line is at the same
The first hachure line is at the same
elevation as the contour line before
it.
it.
More on Contour Lines

Contour lines form V’s that point
upstream when they cross a stream.

It is important to remember that
they point in the opposite direction
as the flow of water.
What do the colors on the
topographic map represent?

Blue lines/shapes - represent water
features, such as streams and lakes.

Brown – contour lines

Black – Roads, buildings, railroads,
other man made objects.

Green – Woodland areas

Red - Highways
Red - Highways
Now that I know what a topographic
map is, how do I read it?

First determine the contour interval
(the distance between each contour
line)
line)

Then determine the map scale
(usually at the bottom of the map)

Identify any hills or depressions

Use the legend to identify man made
features.
features.
Reading a topographic map cont.

Look for areas where the contour
lines are close together – they
indicate a steep area.

Look for areas where the contour
lines are spread apart – they indicate
a gentle slope.
a gentle slope.
Review Questions
Review Questions
 How are contour lines drawn on
How are contour lines drawn on
maps?
maps?
 How does a contour map show
How does a contour map show
whether a slope is gentle or steep?
 What is a benchmark?
What is a benchmark?
 How is a benchmark shown on a
How is a benchmark shown on a
map?
map?
 How is distance measured on a
How is distance measured on a
contour map?
contour map?

my ppt 1 on Maps topographic Maps types.ppt

  • 1.
    Topographic Maps Topographic Maps T.Bates T. Bates Hugo A. Owens Middle School Hugo A. Owens Middle School
  • 2.
    Lesson Objectives Lesson Objectives  Definea topographic map and state Define a topographic map and state its uses. its uses.  Describe how contour lines show the Describe how contour lines show the elevations, shape, and slope of the elevations, shape, and slope of the land. land.  Identify the meanings of some Identify the meanings of some symbols and colors used on symbols and colors used on topographic maps. topographic maps.
  • 3.
    What is atopographic map? What is a topographic map?  A topographic map, also known as a A topographic map, also known as a contour map, is a map that shows contour map, is a map that shows the shape of the land using contour the shape of the land using contour line. line.  It is a map that shows and elevation It is a map that shows and elevation field, meaning how high and low the field, meaning how high and low the ground is in relation to sea level. ground is in relation to sea level.
  • 4.
    What are contourlines? What are contour lines?  Contour lines are lines that connect Contour lines are lines that connect points that are of the same points that are of the same elevation. elevation.  They show the exact elevation, the They show the exact elevation, the shape of the land, and the steepness shape of the land, and the steepness of the land’s slope. of the land’s slope.  Contour lines never touch or cross. Contour lines never touch or cross.
  • 5.
    What is abenchmark? What is a benchmark?  A benchmark is a point where exact A benchmark is a point where exact elevation is known and is marked elevation is known and is marked with a brass or aluminum plate. It is with a brass or aluminum plate. It is marked BM on the map with the marked BM on the map with the elevation numbers given in feet. elevation numbers given in feet.  Benchmarks are useful to help Benchmarks are useful to help determine contour lines. determine contour lines.
  • 6.
    Other Topographic Terms OtherTopographic Terms  Map scale – compares distances on Map scale – compares distances on the map with distances on earth. the map with distances on earth.  Legend – explains symbols used on Legend – explains symbols used on the map. the map.  Index contours – contour lines that Index contours – contour lines that are labeled to help you find the are labeled to help you find the contour interval. contour interval.
  • 7.
    What is acontour interval? What is a contour interval?  A contour interval is the difference in A contour interval is the difference in elevation between two contour lines elevation between two contour lines that are side by side. that are side by side.  Remember that a contour interval is Remember that a contour interval is not the distance between the two not the distance between the two lines – to get the distance you need lines – to get the distance you need to use the map scale. to use the map scale.
  • 8.
    What if mycontour lines are close What if my contour lines are close together? together?  If the contour lines are close If the contour lines are close together, then that indicates that together, then that indicates that area has a steep slope. area has a steep slope.
  • 9.
    What if mycontour lines are far What if my contour lines are far apart? apart?  If the contour lines are far apart, If the contour lines are far apart, then that indicates the land has a then that indicates the land has a gentle slope (low slope). gentle slope (low slope).
  • 10.
    What do thedark colored contour What do the dark colored contour lines mean? lines mean?  The dark colored contour lines The dark colored contour lines represent every fifth contour line to represent every fifth contour line to make it easier to read the map. make it easier to read the map.
  • 11.
    What do depressionsin the map What do depressions in the map look like? look like?  A depression, such as the inside of a A depression, such as the inside of a dead volcano, is represented by dead volcano, is represented by Hachure lines. Hachure lines.  Hachure lines are regular contour Hachure lines are regular contour lines with small segments sticking lines with small segments sticking out from it. out from it.  The first hachure line is at the same The first hachure line is at the same elevation as the contour line before elevation as the contour line before it. it.
  • 12.
    More on ContourLines More on Contour Lines  Contour lines form V’s that point Contour lines form V’s that point upstream when they cross a stream. upstream when they cross a stream.  It is important to remember that It is important to remember that they point in the opposite direction they point in the opposite direction as the flow of water. as the flow of water.
  • 13.
    What do thecolors on the What do the colors on the topographic map represent? topographic map represent?  Blue lines/shapes - represent water Blue lines/shapes - represent water features, such as streams and lakes. features, such as streams and lakes.  Brown – contour lines Brown – contour lines  Black – Roads, buildings, railroads, Black – Roads, buildings, railroads, other man made objects. other man made objects.  Green – Woodland areas Green – Woodland areas  Red - Highways Red - Highways
  • 14.
    Now that Iknow what a topographic Now that I know what a topographic map is, how do I read it? map is, how do I read it?  First determine the contour interval First determine the contour interval (the distance between each contour (the distance between each contour line) line)  Then determine the map scale Then determine the map scale (usually at the bottom of the map) (usually at the bottom of the map)  Identify any hills or depressions Identify any hills or depressions  Use the legend to identify man made Use the legend to identify man made features. features.
  • 15.
    Reading a topographicmap cont. Reading a topographic map cont.  Look for areas where the contour Look for areas where the contour lines are close together – they lines are close together – they indicate a steep area. indicate a steep area.  Look for areas where the contour Look for areas where the contour lines are spread apart – they indicate lines are spread apart – they indicate a gentle slope. a gentle slope.
  • 16.
    Review Questions Review Questions How are contour lines drawn on How are contour lines drawn on maps? maps?  How does a contour map show How does a contour map show whether a slope is gentle or steep? whether a slope is gentle or steep?  What is a benchmark? What is a benchmark?  How is a benchmark shown on a How is a benchmark shown on a map? map?  How is distance measured on a How is distance measured on a contour map? contour map?