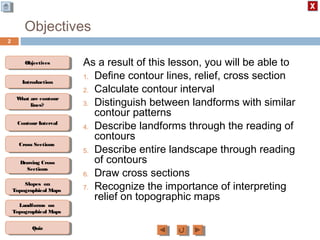
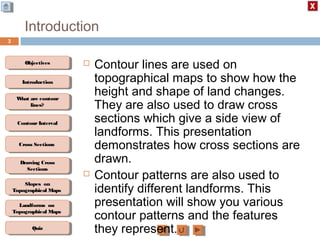
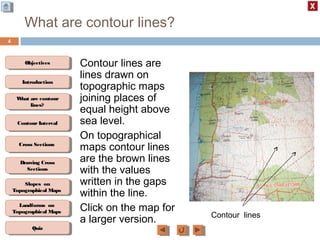
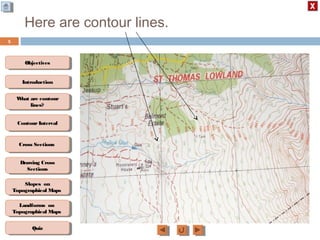
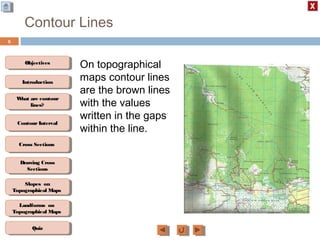
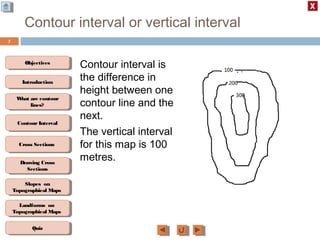
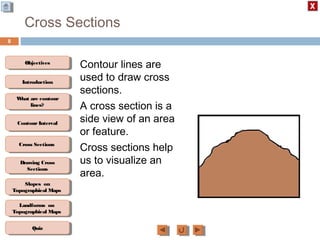
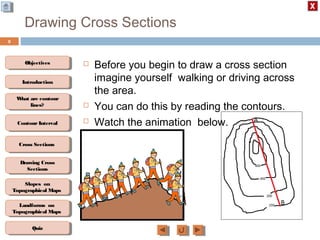
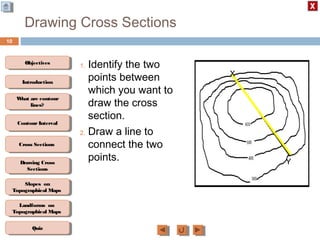
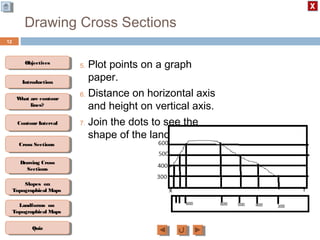
This document describes how to read and interpret contour lines on topographic maps. It contains the following key points:
1. Contour lines connect points of equal elevation and are used to depict the shape and elevation changes of landforms.
2. Cross-sections can be drawn from contour lines to show the side profile of landforms between two points.
3. The spacing and shapes of contour lines indicate different landforms - closely spaced lines indicate steep slopes while widely spaced lines show gentle slopes. Common landforms like hills, valleys, ridges and plateaus each have distinguishing contour patterns.
4. Interpreting contour lines allows describing the overall landscape and calculating elevation changes across an area. The document provides instructions
Topographic maps provide three-dimensional information about landforms and structures through the use of contour lines. Contour lines connect points of equal elevation and allow the reader to determine elevation, slope steepness, and identify natural and manmade features of the landscape. Topographic maps are used by engineers, the military, and for recreational activities like hiking.
Topographic maps use contour lines to represent elevation and slope of land. Contour lines connect points of equal elevation and never cross. Closer lines indicate steeper slopes while widely spaced lines show more gentle slopes. Index contours are bold lines labeled with the elevation. A benchmark is a point of known exact elevation marked as B.M. on maps. Map scale relates distances on a map to actual distances on land and can be ratio, graphical, or verbal.
This document provides information about topographic maps, including:
1. Topographic maps show elevation, shape of the earth's surface using contour lines connecting points of equal elevation. Features like water, terrain, and human structures are shown through different colors and patterns.
2. Contour lines indicate elevation changes - closely spaced lines show steep slopes, widely spaced show gentle slopes. Contour lines never cross or branch. When crossing streams, they bend upstream. Closed contours indicate hills and depressions.
3. Topographic profiles show elevation changes along a line, often with vertical exaggeration to emphasize details. Gradient is the steepness of a slope. Constructing profiles involves connecting elevation points along a contour line slice
Topographic maps show physical characteristics of an area such as rivers, streams, mountains, roads, and man-made structures. They use contour lines to indicate elevation and slope of the land, with closer lines representing a steeper slope. Elevation is noted in feet or meters and contour intervals show the change in elevation between lines. Features such as hills, summits, and depressions are represented symbolically.
Topographic maps model changes in Earth's elevation and indicate both natural and cultural features. Contour lines connect points of equal elevation, with closer lines indicating steeper terrain and farther lines indicating gentler slopes. Index contours are marked with the elevation and allow determining the elevation of surrounding lines. Different colors on topo maps represent vegetation and land use. Map scales and legends provide information on distances and symbols. Map series consist of maps with the same dimensions.
A topographic map represents land features through contour lines and symbols. Contour lines join points of equal elevation, with the interval between lines indicating changes in altitude. Contour lines that are closer together signify steeper slopes, while lines farther apart show more gentle slopes. Additional symbols convey features like streams, ridges, valleys, and mountain passes. Topographic maps provide detailed elevation information to understand the three-dimensional landscape of an area.
This document discusses map scale and projections. It defines scale as the relationship between distances on a map and in reality. Scale can be indicated graphically using a bar scale or fractionally as a ratio. Larger scale maps show smaller areas in greater detail while smaller scale maps show larger areas with less detail. Map projections transfer the spherical Earth onto a flat surface, inevitably introducing some distortion of shapes, sizes or distances. Different projections prioritize conformality, equivalence or other properties depending on the map's intended use.
GEOGRAPHIC SKILLS: DOT MAPS. A dot distribution map, or dot density map, is a map type that uses a dot symbol to show the presence of a feature or a phenomenon. Dot maps rely on a visual scatter to show spatial pattern.
The document discusses map reading and interpretation. It covers relief representation using contour lines on maps, drainage patterns, and human-made features. Students will learn about contour lines, how they represent 3D relief on 2D maps, and how to draw contour lines and cross sections. Contour lines connect points of equal elevation and come in three types: index lines with elevation numbers every fifth line, intermediate lines between the index lines, and supplementary dashed lines for half-interval changes in elevation.
- A map scale indicates the relationship between distances on a map and in real life, allowing for accurate representations though smaller or larger than reality.
- There are three types of map scales: word scale, linear scale, and ratio scale. A word scale states the distance represented by 1 cm, a linear scale graphically shows a distance, and a ratio scale compares map units to real-world units.
- Ratio scales can be difficult to comprehend, so they are often converted to a word scale using a system like metrics. For example, 1:25,000,000 could be changed to 1 cm = 250 km.
- Maps are categorized as large or small scale depending on the level of detail. Small scale
The document discusses topographic maps and their numbering systems in India. It provides details on:
1) Topographic maps represent relief and also show features like transportation and settlements. They contain information like names, scales, and features.
2) In India, the Survey of India prepares topographic maps. Maps are part of two series - the India and Adjacent Country Series and the International Map of the World Series.
3) The India and Adjacent Country Series covers India in grids numbered from 40-92 that are divided into degree, quadrant, and special sheets at various scales with contour intervals.
The document presents a presentation on karst topography given by Ahmad Raza. It defines karst topography as areas with limestone or dolomite bedrock that have distinctive landforms formed by the dissolution of bedrock by water. It discusses the worldwide distribution of karst areas and the conditions required for karst formation. Key erosional landforms of karst include sinkholes, dolines, swallow holes, and caves. Depositional landforms include stalactites, stalagmites, and columns. Karst landscapes progress through youth, mature, and old stages as surface streams disappear underground over time. Karst is important for engineering projects, water resource studies, and paleoclimate research.
This document discusses different types of map projections used to represent the spherical earth on a flat surface. It describes how all projections involve some distortion of properties like shapes, areas, distances or directions. The key types are conformal, equivalent, and equidistant projections. It explains the concepts of projection surfaces like cones, cylinders and planes, as well as variables like the light source and orientation. Specific common projections are also outlined, such as Mercator, Lambert conformal conic, and azimuthal equidistant, along with their characteristic distortions and uses.
Topography, landform and geomorphology-Geomorhology ChapterKaium Chowdhury
This document provides definitions and information about topography, landforms, and geomorphology. It defines topography as the elevation and relief of the Earth's surface, landforms as the topographic features, and geomorphology as the study of earth surface processes and landforms. It discusses various landforms including those formed by tectonic, depositional, weathering, erosion, and mass wasting processes. It also covers related topics like uniformitarianism, the genetic classification of landforms, crustal orders of relief, and important deformation processes like folding and faulting.
This document provides an overview of cartography. It begins with definitions of cartography and discusses the importance and history of maps. The history section outlines some of the earliest maps from ancient civilizations like Babylonia, Egypt, and Greece. It also describes important contributions from figures like Ptolemy, including his world map and map projections. The document emphasizes that cartography has progressed from early conceptual maps to more accurate representations incorporating scientific principles.
Contour lines on a topographical map represent imaginary lines connecting points of equal elevation above or below a datum. The vertical distance between contour lines is called the contour interval. Index contours are drawn with a heavier line every fifth contour to aid identification of elevations. Intermediate contours fall between index contours. Contour lines can be marked in the field using a homemade A-frame leveling device to identify points of equal height and indicate slope. The spacing of contour lines depends on the steepness of the slope, with closer lines used for steeper slopes to prevent soil erosion.
This document provides an overview of cadastre and cadastral surveying. It discusses the basic components of a cadastre including cadastral surveying and mapping, land registration, and property taxation. It also describes parcel index maps, parcel maps, land tenure types, cadastral databases, the role of surveyors, procedures for cadastral surveying, and key aspects of boundaries and their demarcation. The overall purpose of cadastre and cadastral surveying is to precisely define and record land parcels to support land registration and ownership.
The document discusses how topographic maps in India are organized and identified using a hierarchical system of map sheets with different scales. Topographic maps are divided into million sheet sections at 1:1,000,000 scale, degree sheets at 1:250,000 scale, toposheets at 1:50,000 scale, and further subdivided toposheets at 1:25,000 scale that are identified by letters and numbers corresponding to their location and scale. This system allows precise identification of location for any place shown on topographic maps in India.
Coastal land forms .erosional and depositional landformsselman ulfaris
1) Coastal landforms are shaped by wave erosion and deposition. Waves erode cliffs and deposit sediment to form features like beaches, bars, and spits.
2) Erosional landforms include sea cliffs, arches, stacks, and caves which are carved out of rock by wave action. Depositional landforms are beaches, bars, barriers and hooks built up from sediment deposited by waves and currents.
3) Tides and currents influence coastal landforms by transporting sediment and changing the level and reach of wave energy along the shoreline.
This topic includes representation of topography by various non mathematical and mathematical methods.
Pictorial method (Hachure lines, Hill shading)
Mathematical method (Spot heights,Bench marks, Trigonometrical stations, Layer tint or altitude tints, Contour lines )
Combination of different methods
There are several types of maps that show different kinds of information. Political maps depict boundaries between countries and states. Physical maps show natural features like mountains, rivers, and oceans without man-made additions. Thematic maps represent single variables like climate, population, or elevation through different colors or symbols. Topographic maps use contour lines to illustrate the shape and elevation of landforms.
Topographic maps show elevation and surface features of land using contour lines to connect points of equal height. Contour lines never cross and indicate slope - closely spaced lines mean steep slopes while lines far apart indicate flat land. Topographic maps are used to understand the shape and elevation of the land.
This document discusses the definition, nature, and scope of cartography. It can be summarized as follows:
1) Cartography is the science and art of making maps. It combines elements of geography, earth science, and communication to graphically portray spatial information about the earth or other celestial bodies.
2) Cartography relies on techniques from fields like surveying, remote sensing, and geography to collect and generalize data, which is then designed and constructed into maps to convey messages and facts to users.
3) Advances in technology like satellites, computers, and the internet have significantly impacted cartographic processes by providing new data sources, analysis tools, and modes of map production and sharing. However, traditional
The document discusses settlement site and situation, defining site as the location a settlement is built on and situation as where the settlement is located in relation to surrounding features. It asks the reader to identify and explain the site and situation factors responsible for the location and growth of Bratislava, Slovakia. Specifically, it asks the reader to identify site factors that influenced Bratislava's original growth and situation factors that have contributed to its continued development into a major city.
The document provides information on key concepts related to maps and map reading, including:
1) Maps are graphical representations of physical and cultural features on Earth's surface, with symbols used to denote features. Scale allows large areas to be shown on small maps and is expressed verbally, as a ratio, or with a bar scale.
2) Grid references use a system of eastings and northings to precisely locate features on maps divided into grids. Contour lines and spot heights indicate land elevation and relief. Hachures and shading are also used to represent relief.
3) Maps use colors to represent different features - green for forests, blue for water, etc. Settlement patterns, drainage patterns, transportation
This document discusses key geographical skills and investigations, including topographical map reading skills, geographical data techniques, and geographical investigations. It covers topics such as reading topographical maps, interpreting scales, measuring distances, describing relief features, identifying landforms, calculating gradients, interpreting map symbols, describing patterns of vegetation and land use, and explaining relationships between relief and land use. It also discusses using photographs, satellite images, and different types of graphs to depict and analyze geographical data.
This document provides an introduction to maps and map elements. It discusses the basic components of maps including titles, scales, legends, and directions. It also describes different types of maps such as general reference maps, thematic maps, and topographic maps. Topographic maps are explained in detail, including how they use contour lines to show elevation changes and terrain features. The key elements of contour maps like contour intervals and index contours are defined. Finally, the document outlines the purposes and uses of contour maps for engineering projects.
This document provides an introduction to maps and map elements. It discusses the basic components of maps including titles, scales, legends, and directions. It also describes different map types such as general reference maps, thematic maps, and topographic maps. Topographic maps are explained in detail, including how they use contour lines to show elevation changes and terrain features. The key elements of contour maps like contour intervals and index contours are defined. Finally, the document outlines the purposes and uses of contour maps for engineering projects.
This document provides an overview of maps and map elements. It discusses the different types of maps including general purpose maps, thematic maps, and topographic maps. It describes the basic elements of maps such as titles, scales, legends, and directions. Contour lines and how to read elevation and slope from topographic maps are explained in detail. The purpose and uses of contour maps for engineering projects are also summarized.
This chapter discusses key geographical skills like map reading, interpreting data representations, and conducting fieldwork investigations. It covers topics such as reading grid references, compass directions, scales, measuring distances, interpreting reliefs and landforms on maps, and analyzing photographs and satellite images. Various types of graphs like line graphs, bar graphs, pie charts, and climographs are introduced to represent geographical data. The three phases of fieldwork - pre-fieldwork, during fieldwork, and post-fieldwork - are also outlined.
The document provides information on map interpretation and contour maps. It begins with an introduction to maps and their basic elements such as title, key, scales, and contours. It then discusses contour patterns and how to interpret topographic features from contour maps such as ridges, valleys, slopes, and elevations. Contour maps represent elevations using contour lines that connect points of equal height. Contour maps are useful for engineering projects to determine optimal site selection and design of structures based on the topography.
A map is a representation of all or part of the Earth drawn on a flat surface at a specific scale that uses symbols and colors to represent selected features of an area. Maps allow for accurate planning of journeys by showing landmarks, routes, and distances. There are different types of maps including general reference maps, thematic maps that illustrate a particular theme, and topographic maps that show landscape topography through contour lines.
A map is a representation of all or part of the Earth's surface drawn to scale. Maps use symbols and colors to represent features like landforms, roads, and vegetation. Contour lines connect points of equal elevation, allowing maps to depict three-dimensional terrain in two dimensions. Contour maps are useful for engineering projects to evaluate sites, trace grades, and calculate earthworks.
A topographic map is a map that uses contour lines to illustrate the surface features of a place such as its relative elevations and the shapes of its landforms. Contour lines connect points of equal elevation and the closer the lines are to each other the steeper the elevation change. A topographic map's contour interval specifies the difference in elevation between successive contour lines. Topographic maps are useful for navigation, geographic analysis and engineering design.
This document provides an overview of how to use maps and compasses for orienteering. It discusses key map elements like scale, contour lines, directions, and distance measurements. It also explains how to use a compass to determine directions between points and measure distances on a map using a bar scale. The document aims to teach basic map reading and navigation skills.
By the end of the lesson students should be able to:
-explain how height is shown on maps
-recognise slope types
-some will identify landscape features from looking at contours
Topographic maps use contour lines to represent the shape and elevation of land. Contour lines connect points of equal elevation and never touch or cross. Closely spaced lines indicate steep slopes, while widely spaced lines show gentle slopes. A contour interval is the elevation difference between lines. Topographic maps also use colors, symbols and labels to depict features like water, vegetation and man-made objects. Benchmarks provide exact elevation references and are marked on maps with their altitude in feet.
This document provides information on map projections. It defines map projection as a systematic transformation of locations on Earth onto a plane. It discusses the three main types of projections: planar, cylindrical, and conic. Planar projections center on a point and are accurate near the center, cylindrical projections are rolled onto a cylinder and accurate along the equator, and conic projections use a cone and are suited to limited east-west areas near the equator. It also discusses properties like shape, area, direction, and distance distortions that occur in projections and notes no projection is perfect. Common projections like Mercator, UTM, and Robinson are described.
Contour maps: preparation and understanding.VIVEK CHAUHAN
The theme behind preparation of contour maps, various projections of topographical features, the processor making them and methods used in their making.
This presentation is for Grades 6 and 7. It is based on the Edexcel Curriculum. This is a geography ppt on Contour lines. Hope this helps you to teach your classes.
A topographic map uses contour lines to represent the elevation and shape of the land. Contour lines connect points of equal elevation and indicate the steepness of slopes by their proximity - close lines mean a steep slope, while lines far apart indicate a gentle slope. A benchmark provides an exact elevation reference point marked on the map. Additional symbols and colors provide further information about features such as water, vegetation, and man-made structures. Topographic maps allow users to understand elevation changes over an area and measure distances using the map scale.
The document discusses topographical maps, which show important natural and cultural features such as relief, vegetation, water bodies, and transportation networks. Topographical maps are prepared at large scales by national mapping organizations in each country, such as the Survey of India in India. They are prepared in series at different scales, with the same reference points, scale, projections, symbols, and colors. Contours are the primary method used for depicting relief on topographical maps, with closer contours indicating steeper slopes and farther contours indicating more gentle slopes. Cultural features such as settlements, buildings, roads, and railways are also shown through standardized symbols and colors. Topographical maps provide important information and are useful for geographers in understanding the landscape, drainage
The document discusses topographical maps, which show important natural and cultural features such as relief, vegetation, water bodies, and transportation networks. Topographical maps are prepared at large scales by national mapping organizations in each country, such as the Survey of India in India. They are prepared in series at different scales, with the same reference points, scale, projections, symbols, and colors. Contours are the primary method used for depicting relief on topographical maps, with closer contours indicating steeper slopes and farther contours indicating more gentle slopes. Cultural features such as settlements, buildings, roads, and railways are also shown through standardized symbols and colors. Topographical maps provide important information and are useful for geographers in understanding terrain and land use
Similar to Geography M2 Drawing cross section (20)
This document provides information about study resources for exams, including quick study options with over 400 YouTube videos and 200 slideshare presentations covering 11 subjects, as well as comprehensive studying with 250 lessons per subject broken into modules and over 30,000 test items. Users can create an account to access these resources through a Moodle online learning platform by searching courses or topics.
This document outlines the key concepts and examples for matrices including: addition and subtraction of matrices with the same dimensions; scalar multiplication by multiplying each element of the matrix by the scalar; matrix multiplication where the number of columns of the first matrix equals the number of rows of the second matrix; determinants of 2x2 matrices; inverse matrices for non-singular 2x2 matrices; solving systems of equations using matrices; and geometric transformations using matrices including rotation, reflection, translation and examples of applying transformations.
This document contains 6 presentations on vectors:
1) Identifying equivalent and opposite vectors in a diagram
2) Calculating components of vectors
3) Writing vector expressions in terms of other vectors
4) Illustrating vector addition and subtraction on a grid
5) Expressing vectors in terms of other vectors using properties of midpoints
6) Expressing vectors in terms of other vectors and proving collinearity using properties of parallelograms
Math unit36 contructions and enlargementseLearningJa
This document discusses geometric transformations including lines of symmetry, rotational symmetry, enlargements, and finding the scale factor and center of enlargement. Lines of symmetry and orders of rotational symmetry are identified for different shapes. Enlargements are performed using given scale factors and centers. The ratio of areas for different enlargements is calculated. Scale factors and centers of enlargement are determined for shapes.
This document covers trigonometric concepts and problems involving right-angled triangles, bearings, and trigonometric functions. It includes 7 presentations on finding angles in right triangles using trig functions, problems using trigonometry including elevation and depression, the sine rule, cosine rule, problems with bearings, and trig functions. Examples are provided for each topic to demonstrate how to set up and solve various trigonometric problems.
This document covers the topics of congruence, similarity, and ratios between similar shapes. It includes 4 tests for determining if triangles are congruent based on side lengths and angles. It also discusses identifying similar shapes and using corresponding parts of similar triangles to determine unknown lengths and angles. Finally, it examines how linear dimensions, areas, and volumes are scaled between similar cuboids based on common scale factors.
Math unit32 angles, circles and tangentseLearningJa
This document contains 8 presentations on the topics of angles, circles, and tangents. It includes definitions, results, and examples related to compass bearings, angles formed with circles, properties of circles and tangents, and the relationships between angles on circles and chords. Practice problems are provided for students to apply the concepts to geometric diagrams.
Math unit29 using graphs to solve equationseLearningJa
This document discusses using graphs to solve equations. It covers solving simultaneous equations by graphing the lines and finding their intersection point. It also discusses graphs of quadratic, cubic, and reciprocal functions, including their key characteristics and shapes. Examples of each type of function are shown. The document concludes by discussing using graphs to find specific values or intervals related to equations.
This document contains 6 presentations on functions, mappings, and domains:
1) It introduces functions, mappings, and domains.
2) It further explores functions, mappings, and domains with examples.
3) It provides another example and asks about domain and range.
4) It covers composite functions, finding functions of other functions.
5) It introduces the concept of inverse functions.
6) It gives another example of finding the inverse of a function.
This document covers straight lines and their properties including positive and negative gradient, the relationship between perpendicular lines, using graphs to determine speed and distance, and finding equations of lines. It provides examples of calculating gradient, determining if two lines are perpendicular, finding speed from a distance-time graph, and deriving equations of lines given points or being parallel/perpendicular to another line. The content builds understanding of key concepts involving straight lines through worked examples.
This document discusses solving inequalities and linear programming problems. It covers inequalities on a number line, solving linear inequalities, inequalities involving quadratic terms, using a graphical approach, and linear programming problems. Examples are provided for illustrating inequalities on number lines, solving various types of inequalities, finding the region defined by inequality constraints on a graph, and analyzing a linear programming problem about profit from cricket club uniform sales to determine the minimum possible profit.
This document contains 6 presentations on the topic of coordinates:
1. Positive coordinates and plotting points in a plane
2. Writing coordinates of points and identifying locations
3. Plotting straight lines by connecting points
4. Plotting curves by connecting points in a smooth curve
5. Finding the midpoint of a line segment by averaging the x and y coordinates
6. Three-dimensional coordinates by extending points into the z-axis
This document contains summaries of 8 presentations about formulas:
1. Using formulas to calculate the perimeter and area of a rectangle given the length and width.
2. Constructing a formula to calculate an engineer's charge based on a fixed fee plus an hourly rate multiplied by hours worked.
3. Reviewing rules for performing calculations with negative numbers.
4. Using information provided to calculate temperature differences between various cities.
5. Substituting values into a formula to calculate the length of a metal rod at different temperatures.
6. Substituting values into a more complex formula involving fractions to calculate a focal length.
7. Rewriting a formula connecting Celsius and Fahrenheit
This document outlines 8 presentations covering algebraic concepts taught in Unit 22. The presentations include simplifying expressions, solving simple and linear equations, equations in context, algebraic manipulation, and algebraic fractions. Each presentation provides example problems and solutions to illustrate the concepts and skills covered.
This document contains explanations and examples related to probability concepts. It includes 4 presentations: 1) Simple Probability, 2) Probabilities, 3) Determining Probabilities, and 4) Misconceptions. The presentations provide examples of calculating probabilities of events, common probability misconceptions, and explanations for why the misconceptions are incorrect.
The document contains information about measures of variation and distributions, including:
1) A table showing the age distribution of Nigeria's population in 1991, with the lower quartile around 11 years, median around 24 years, and upper quartile around 40.5 years.
2) A table with test marks for 70 students, including constructing a cumulative frequency curve and determining that 28 students passed with a mark over 47.
3) Box and whisker plots are constructed to represent the goals scored in football matches by two teams, comparing their median, quartiles, and range.
4) Standard deviation is defined as a measure of spread from the mean, and the standard deviations of three data sets S1, S2,
Math unit20 probability of one or more eventseLearningJa
This document is a presentation on probability of two or more events. It includes sections on probability outcomes for rolling a dice and flipping a coin simultaneously, rolling two dice and adding the scores, using tree diagrams to calculate probabilities of outcomes from rolling two dice or drawing balls from containers. It also addresses common misconceptions about probability, such as assuming the number of possible outcomes corresponds to the probability of a specific outcome, or that order matters in independent events. The presentation provides examples and prompts users to complete probability calculations to demonstrate their understanding of fundamental probability concepts involving two or more random events.
The document discusses different data presentation methods including pie charts, line graphs, histograms, and histograms with unequal class intervals. It provides examples of how to represent various data sets visually using these different graph types, including steps for constructing the graphs, calculating values, and interpreting the results.
This document contains 4 presentations on volume, sectors, and arcs. The first presentation defines the formulas for calculating the volumes of cubes, cuboids, cylinders, and triangular prisms. The second presentation covers the relationships between mass, volume, and density. The third presentation provides the formulas for finding the areas of sectors and arc lengths of circles. The final presentation defines the volume formulas for pyramids, cones, and spheres and includes an example problem calculating the height of a cone with the same volume and radius as a sphere.
This slide is special for master students (MIBS & MIFB) in UUM. Also useful for readers who are interested in the topic of contemporary Islamic banking.
Executive Directors Chat Leveraging AI for Diversity, Equity, and InclusionTechSoup
Let’s explore the intersection of technology and equity in the final session of our DEI series. Discover how AI tools, like ChatGPT, can be used to support and enhance your nonprofit's DEI initiatives. Participants will gain insights into practical AI applications and get tips for leveraging technology to advance their DEI goals.
LAND USE LAND COVER AND NDVI OF MIRZAPUR DISTRICT, UPRAHUL
This Dissertation explores the particular circumstances of Mirzapur, a region located in the
core of India. Mirzapur, with its varied terrains and abundant biodiversity, offers an optimal
environment for investigating the changes in vegetation cover dynamics. Our study utilizes
advanced technologies such as GIS (Geographic Information Systems) and Remote sensing to
analyze the transformations that have taken place over the course of a decade.
The complex relationship between human activities and the environment has been the focus
of extensive research and worry. As the global community grapples with swift urbanization,
population expansion, and economic progress, the effects on natural ecosystems are becoming
more evident. A crucial element of this impact is the alteration of vegetation cover, which plays a
significant role in maintaining the ecological equilibrium of our planet.Land serves as the foundation for all human activities and provides the necessary materials for
these activities. As the most crucial natural resource, its utilization by humans results in different
'Land uses,' which are determined by both human activities and the physical characteristics of the
land.
The utilization of land is impacted by human needs and environmental factors. In countries
like India, rapid population growth and the emphasis on extensive resource exploitation can lead
to significant land degradation, adversely affecting the region's land cover.
Therefore, human intervention has significantly influenced land use patterns over many
centuries, evolving its structure over time and space. In the present era, these changes have
accelerated due to factors such as agriculture and urbanization. Information regarding land use and
cover is essential for various planning and management tasks related to the Earth's surface,
providing crucial environmental data for scientific, resource management, policy purposes, and
diverse human activities.
Accurate understanding of land use and cover is imperative for the development planning
of any area. Consequently, a wide range of professionals, including earth system scientists, land
and water managers, and urban planners, are interested in obtaining data on land use and cover
changes, conversion trends, and other related patterns. The spatial dimensions of land use and
cover support policymakers and scientists in making well-informed decisions, as alterations in
these patterns indicate shifts in economic and social conditions. Monitoring such changes with the
help of Advanced technologies like Remote Sensing and Geographic Information Systems is
crucial for coordinated efforts across different administrative levels. Advanced technologies like
Remote Sensing and Geographic Information Systems
9
Changes in vegetation cover refer to variations in the distribution, composition, and overall
structure of plant communities across different temporal and spatial scales. These changes can
occur natural.
How to Make a Field Mandatory in Odoo 17Celine George
In Odoo, making a field required can be done through both Python code and XML views. When you set the required attribute to True in Python code, it makes the field required across all views where it's used. Conversely, when you set the required attribute in XML views, it makes the field required only in the context of that particular view.
How to Fix the Import Error in the Odoo 17Celine George
An import error occurs when a program fails to import a module or library, disrupting its execution. In languages like Python, this issue arises when the specified module cannot be found or accessed, hindering the program's functionality. Resolving import errors is crucial for maintaining smooth software operation and uninterrupted development processes.
A review of the growth of the Israel Genealogy Research Association Database Collection for the last 12 months. Our collection is now passed the 3 million mark and still growing. See which archives have contributed the most. See the different types of records we have, and which years have had records added. You can also see what we have for the future.
How to Setup Warehouse & Location in Odoo 17 InventoryCeline George
In this slide, we'll explore how to set up warehouses and locations in Odoo 17 Inventory. This will help us manage our stock effectively, track inventory levels, and streamline warehouse operations.
ISO/IEC 27001, ISO/IEC 42001, and GDPR: Best Practices for Implementation and...PECB
Denis is a dynamic and results-driven Chief Information Officer (CIO) with a distinguished career spanning information systems analysis and technical project management. With a proven track record of spearheading the design and delivery of cutting-edge Information Management solutions, he has consistently elevated business operations, streamlined reporting functions, and maximized process efficiency.
Certified as an ISO/IEC 27001: Information Security Management Systems (ISMS) Lead Implementer, Data Protection Officer, and Cyber Risks Analyst, Denis brings a heightened focus on data security, privacy, and cyber resilience to every endeavor.
His expertise extends across a diverse spectrum of reporting, database, and web development applications, underpinned by an exceptional grasp of data storage and virtualization technologies. His proficiency in application testing, database administration, and data cleansing ensures seamless execution of complex projects.
What sets Denis apart is his comprehensive understanding of Business and Systems Analysis technologies, honed through involvement in all phases of the Software Development Lifecycle (SDLC). From meticulous requirements gathering to precise analysis, innovative design, rigorous development, thorough testing, and successful implementation, he has consistently delivered exceptional results.
Throughout his career, he has taken on multifaceted roles, from leading technical project management teams to owning solutions that drive operational excellence. His conscientious and proactive approach is unwavering, whether he is working independently or collaboratively within a team. His ability to connect with colleagues on a personal level underscores his commitment to fostering a harmonious and productive workplace environment.
Date: May 29, 2024
Tags: Information Security, ISO/IEC 27001, ISO/IEC 42001, Artificial Intelligence, GDPR
-------------------------------------------------------------------------------
Find out more about ISO training and certification services
Training: ISO/IEC 27001 Information Security Management System - EN | PECB
ISO/IEC 42001 Artificial Intelligence Management System - EN | PECB
General Data Protection Regulation (GDPR) - Training Courses - EN | PECB
Webinars: https://pecb.com/webinars
Article: https://pecb.com/article
-------------------------------------------------------------------------------
For more information about PECB:
Website: https://pecb.com/
LinkedIn: https://www.linkedin.com/company/pecb/
Facebook: https://www.facebook.com/PECBInternational/
Slideshare: http://www.slideshare.net/PECBCERTIFICATION
Walmart Business+ and Spark Good for Nonprofits.pdfTechSoup
"Learn about all the ways Walmart supports nonprofit organizations.
You will hear from Liz Willett, the Head of Nonprofits, and hear about what Walmart is doing to help nonprofits, including Walmart Business and Spark Good. Walmart Business+ is a new offer for nonprofits that offers discounts and also streamlines nonprofits order and expense tracking, saving time and money.
The webinar may also give some examples on how nonprofits can best leverage Walmart Business+.
The event will cover the following::
Walmart Business + (https://business.walmart.com/plus) is a new shopping experience for nonprofits, schools, and local business customers that connects an exclusive online shopping experience to stores. Benefits include free delivery and shipping, a 'Spend Analytics” feature, special discounts, deals and tax-exempt shopping.
Special TechSoup offer for a free 180 days membership, and up to $150 in discounts on eligible orders.
Spark Good (walmart.com/sparkgood) is a charitable platform that enables nonprofits to receive donations directly from customers and associates.
Answers about how you can do more with Walmart!"
A workshop hosted by the South African Journal of Science aimed at postgraduate students and early career researchers with little or no experience in writing and publishing journal articles.
South African Journal of Science: Writing with integrity workshop (2024)
Geography M2 Drawing cross section
1. Geography Module #2 Unit #2 Lesson #10
DESCRIBING
LANDSCAPE ON
TOPOGRAPHIC MAPS
BEGIN
2. ObjectivesObjectives
What are contour
lines?
What are contour
lines?
ContourIntervalContour Interval
Cross SectionsCross Sections
Drawing Cross
Sections
Drawing Cross
Sections
QuizQuiz
IntroductionIntroduction
Slopes on
Topographical Maps
Slopes on
Topographical Maps
Landforms on
Topographical Maps
Landforms on
Topographical Maps
Objectives
As a result of this lesson, you will be able to
1. Define contour lines, relief, cross section
2. Calculate contour interval
3. Distinguish between landforms with similar
contour patterns
4. Describe landforms through the reading of
contours
5. Describe entire landscape through reading
of contours
6. Draw cross sections
7. Recognize the importance of interpreting
relief on topographic maps
2
3. ObjectivesObjectives
What are contour
lines?
What are contour
lines?
ContourIntervalContour Interval
Cross SectionsCross Sections
Drawing Cross
Sections
Drawing Cross
Sections
QuizQuiz
IntroductionIntroduction
Slopes on
Topographical Maps
Slopes on
Topographical Maps
Landforms on
Topographical Maps
Landforms on
Topographical Maps
Introduction
Contour lines are used on
topographical maps to show how the
height and shape of land changes.
They are also used to draw cross
sections which give a side view of
landforms. This presentation
demonstrates how cross sections are
drawn.
Contour patterns are also used to
identify different landforms. This
presentation will show you various
contour patterns and the features
they represent.
3
4. ObjectivesObjectives
What are contour
lines?
What are contour
lines?
ContourIntervalContour Interval
Cross SectionsCross Sections
Drawing Cross
Sections
Drawing Cross
Sections
QuizQuiz
IntroductionIntroduction
Slopes on
Topographical Maps
Slopes on
Topographical Maps
Landforms on
Topographical Maps
Landforms on
Topographical Maps
What are contour lines?
Contour lines are
lines drawn on
topographic maps
joining places of
equal height above
sea level.
On topographical
maps contour lines
are the brown lines
with the values
written in the gaps
within the line.
Click on the map for
a larger version. Contour lines
4
5. ObjectivesObjectives
What are contour
lines?
What are contour
lines?
ContourIntervalContour Interval
Cross SectionsCross Sections
Drawing Cross
Sections
Drawing Cross
Sections
QuizQuiz
IntroductionIntroduction
Slopes on
Topographical Maps
Slopes on
Topographical Maps
Landforms on
Topographical Maps
Landforms on
Topographical Maps
Here are contour lines.
Contour lines are
lines drawn on
topographic maps
joining places of
equal height above
sea level.
5
6. ObjectivesObjectives
What are contour
lines?
What are contour
lines?
ContourIntervalContour Interval
Cross SectionsCross Sections
Drawing Cross
Sections
Drawing Cross
Sections
QuizQuiz
IntroductionIntroduction
Slopes on
Topographical Maps
Slopes on
Topographical Maps
Landforms on
Topographical Maps
Landforms on
Topographical Maps
Contour Lines
On topographical
maps contour lines
are the brown lines
with the values
written in the gaps
within the line.
6
7. ObjectivesObjectives
What are contour
lines?
What are contour
lines?
ContourIntervalContour Interval
Cross SectionsCross Sections
Drawing Cross
Sections
Drawing Cross
Sections
QuizQuiz
IntroductionIntroduction
Slopes on
Topographical Maps
Slopes on
Topographical Maps
Landforms on
Topographical Maps
Landforms on
Topographical Maps
Contour interval or vertical interval
Contour interval is
the difference in
height between one
contour line and the
next.
The vertical interval
for this map is 100
metres.
7
8. ObjectivesObjectives
What are contour
lines?
What are contour
lines?
ContourIntervalContour Interval
Cross SectionsCross Sections
Drawing Cross
Sections
Drawing Cross
Sections
QuizQuiz
IntroductionIntroduction
Slopes on
Topographical Maps
Slopes on
Topographical Maps
Landforms on
Topographical Maps
Landforms on
Topographical Maps
Cross Sections
Contour lines are
used to draw cross
sections.
A cross section is a
side view of an area
or feature.
Cross sections help
us to visualize an
area.
8
9. ObjectivesObjectives
What are contour
lines?
What are contour
lines?
ContourIntervalContour Interval
Cross SectionsCross Sections
Drawing Cross
Sections
Drawing Cross
Sections
QuizQuiz
IntroductionIntroduction
Slopes on
Topographical Maps
Slopes on
Topographical Maps
Landforms on
Topographical Maps
Landforms on
Topographical Maps
Drawing Cross Sections
9
Before you begin to draw a cross section
imagine yourself walking or driving across
the area.
You can do this by reading the contours.
Watch the animation below.
10. ObjectivesObjectives
What are contour
lines?
What are contour
lines?
ContourIntervalContour Interval
Cross SectionsCross Sections
Drawing Cross
Sections
Drawing Cross
Sections
QuizQuiz
IntroductionIntroduction
Slopes on
Topographical Maps
Slopes on
Topographical Maps
Landforms on
Topographical Maps
Landforms on
Topographical Maps
Drawing Cross Sections
1. Identify the two
points between
which you want to
draw the cross
section.
2. Draw a line to
connect the two
points.
10
X
Y
11. ObjectivesObjectives
What are contour
lines?
What are contour
lines?
ContourIntervalContour Interval
Cross SectionsCross Sections
Drawing Cross
Sections
Drawing Cross
Sections
QuizQuiz
IntroductionIntroduction
Slopes on
Topographical Maps
Slopes on
Topographical Maps
Landforms on
Topographical Maps
Landforms on
Topographical Maps
Drawing Cross Sections
3. Lay edge of plain
sheet of paper
along the line and
mark starting point
and end point.
4. Mark and attach
value to each
contour line that
touches the edge of
the paper
11
12. ObjectivesObjectives
What are contour
lines?
What are contour
lines?
ContourIntervalContour Interval
Cross SectionsCross Sections
Drawing Cross
Sections
Drawing Cross
Sections
QuizQuiz
IntroductionIntroduction
Slopes on
Topographical Maps
Slopes on
Topographical Maps
Landforms on
Topographical Maps
Landforms on
Topographical Maps
Drawing Cross Sections
5. Plot points on a graph
paper.
6. Distance on horizontal axis
and height on vertical axis.
7. Join the dots to see the
shape of the land
12
13. ObjectivesObjectives
What are contour
lines?
What are contour
lines?
ContourIntervalContour Interval
Cross SectionsCross Sections
Drawing Cross
Sections
Drawing Cross
Sections
QuizQuiz
IntroductionIntroduction
Slopes on
Topographical Maps
Slopes on
Topographical Maps
Landforms on
Topographical Maps
Landforms on
Topographical Maps
Drawing Cross Sections
8. Enclose the cross section.
9. Shade the area.
10. Label the cross section.
11. Give it a title.
12. Include the horizontal scale and vertical
scale.
13
14. ObjectivesObjectives
What are contour
lines?
What are contour
lines?
ContourIntervalContour Interval
Cross SectionsCross Sections
Drawing Cross
Sections
Drawing Cross
Sections
QuizQuiz
IntroductionIntroduction
Slopes on
Topographical Maps
Slopes on
Topographical Maps
Landforms on
Topographical Maps
Landforms on
Topographical Maps
Slopes on a Topographical Map
A steep slope or a
scarp slope is
shown by
contours that are
close together.
14
Steep slope
15. ObjectivesObjectives
What are contour
lines?
What are contour
lines?
ContourIntervalContour Interval
Cross SectionsCross Sections
Drawing Cross
Sections
Drawing Cross
Sections
QuizQuiz
IntroductionIntroduction
Slopes on
Topographical Maps
Slopes on
Topographical Maps
Landforms on
Topographical Maps
Landforms on
Topographical Maps
Slopes on a Topographical Map
15
A gentle slope or a dip slope is shown
by contours that are far apart.
Gentle slope
16. ObjectivesObjectives
What are contour
lines?
What are contour
lines?
ContourIntervalContour Interval
Cross SectionsCross Sections
Drawing Cross
Sections
Drawing Cross
Sections
QuizQuiz
IntroductionIntroduction
Slopes on
Topographical Maps
Slopes on
Topographical Maps
Landforms on
Topographical Maps
Landforms on
Topographical Maps
Landforms on Topographic Map
Co nicalHill
16
Conical Hill - Contour
Pattern
Conical Hill
Conical hills are so called because they are
shaped like cones and taper to a point.
The space within the innermost contour is
small.
17. ObjectivesObjectives
What are contour
lines?
What are contour
lines?
ContourIntervalContour Interval
Cross SectionsCross Sections
Drawing Cross
Sections
Drawing Cross
Sections
QuizQuiz
IntroductionIntroduction
Slopes on
Topographical Maps
Slopes on
Topographical Maps
Landforms on
Topographical Maps
Landforms on
Topographical Maps
Round -topped Hill
17
A round –topped hill is represented by
concentric contour lines with increasing values
toward the centre.
The outer contours are not always circular. The
space within the innermost contour is
comparatively large.
Round-topped Hill
Contour Pattern
Round-topped Hill
Contour Pattern
Round-topped HillRound-topped Hill
18. ObjectivesObjectives
What are contour
lines?
What are contour
lines?
ContourIntervalContour Interval
Cross SectionsCross Sections
Drawing Cross
Sections
Drawing Cross
Sections
QuizQuiz
IntroductionIntroduction
Slopes on
Topographical Maps
Slopes on
Topographical Maps
Landforms on
Topographical Maps
Landforms on
Topographical Maps
Flat -topped Hill
18
Flat-topped Hill
ContourPattern
Flat-topped Hill
ContourPattern
Flat-topped HillFlat-topped Hill
The innermost (highest) contour line encloses
a wide space. The contours are not usually
circular.
19. ObjectivesObjectives
What are contour
lines?
What are contour
lines?
ContourIntervalContour Interval
Cross SectionsCross Sections
Drawing Cross
Sections
Drawing Cross
Sections
QuizQuiz
IntroductionIntroduction
Slopes on
Topographical Maps
Slopes on
Topographical Maps
Landforms on
Topographical Maps
Landforms on
Topographical Maps
Plateau
A plateau is a large highland area with an
almost flat top.
19
20. ObjectivesObjectives
What are contour
lines?
What are contour
lines?
ContourIntervalContour Interval
Cross SectionsCross Sections
Drawing Cross
Sections
Drawing Cross
Sections
QuizQuiz
IntroductionIntroduction
Slopes on
Topographical Maps
Slopes on
Topographical Maps
Landforms on
Topographical Maps
Landforms on
Topographical Maps
Ridge
A ridge is a long narrow strip of highland.
Contours are elongated, almost parallel.
20
21. ObjectivesObjectives
What are contour
lines?
What are contour
lines?
ContourIntervalContour Interval
Cross SectionsCross Sections
Drawing Cross
Sections
Drawing Cross
Sections
QuizQuiz
IntroductionIntroduction
Slopes on
Topographical Maps
Slopes on
Topographical Maps
Landforms on
Topographical Maps
Landforms on
Topographical Maps
Valley
21
A valley is a lowland between two highlands.
Contour lines point to higher land.
22. ObjectivesObjectives
What are contour
lines?
What are contour
lines?
ContourIntervalContour Interval
Cross SectionsCross Sections
Drawing Cross
Sections
Drawing Cross
Sections
QuizQuiz
IntroductionIntroduction
Slopes on
Topographical Maps
Slopes on
Topographical Maps
Landforms on
Topographical Maps
Landforms on
Topographical Maps
Gorge
22
A ravine is a very
narrow steep-sided
valley.
The contours are
very close together.
A very deep ravine is
called a gorge.
23. ObjectivesObjectives
What are contour
lines?
What are contour
lines?
ContourIntervalContour Interval
Cross SectionsCross Sections
Drawing Cross
Sections
Drawing Cross
Sections
QuizQuiz
IntroductionIntroduction
Slopes on
Topographical Maps
Slopes on
Topographical Maps
Landforms on
Topographical Maps
Landforms on
Topographical Maps
Matching Exercise - 1
23
Click on the contour pattern that matches the picture on
the left. The correct answer will be highlighted in green
and chime heard.
24. ObjectivesObjectives
What are contour
lines?
What are contour
lines?
ContourIntervalContour Interval
Cross SectionsCross Sections
Drawing Cross
Sections
Drawing Cross
Sections
QuizQuiz
IntroductionIntroduction
Slopes on
Topographical Maps
Slopes on
Topographical Maps
Landforms on
Topographical Maps
Landforms on
Topographical Maps
Matching Exercise - 2
24
Click on the contour pattern that matches the picture on
the left. The correct answer will be highlighted in green
and a chime heard.
25. ObjectivesObjectives
What are contour
lines?
What are contour
lines?
ContourIntervalContour Interval
Cross SectionsCross Sections
Drawing Cross
Sections
Drawing Cross
Sections
QuizQuiz
IntroductionIntroduction
Slopes on
Topographical Maps
Slopes on
Topographical Maps
Landforms on
Topographical Maps
Landforms on
Topographical Maps
Feedback - Matching Exercise
25
26. ObjectivesObjectives
What are contour
lines?
What are contour
lines?
ContourIntervalContour Interval
Cross SectionsCross Sections
Drawing Cross
Sections
Drawing Cross
Sections
QuizQuiz
IntroductionIntroduction
Slopes on
Topographical Maps
Slopes on
Topographical Maps
Landforms on
Topographical Maps
Landforms on
Topographical Maps
End of Quiz
You have reached the end of the
quiz.
If you wish to review this lesson, go to
the first slide.
If you have finished viewing the
lesson, click the Close (X) button.
26
Editor's Notes
Read this before viewing as slide show.
Note. If you are using PowerPoint 2007, before you begin, look for the Security Warning below the ribbon, above this slide and click the Options button. In the Security Alert box, click “Enable This Content”. If the Security Warning does not appear, then view the presentation as Slide Show.
If you are using PowerPoint 2013, look below the ribbon. If you see a Security Warning, click Enable Content before viewing in Slide Show View.