
Recommended
More Related Content
What's hot
What's hot (20)
Viewers also liked
Viewers also liked (14)
Similar to Currency high lights 31.01.17
Similar to Currency high lights 31.01.17 (20)
Recently uploaded
Recently uploaded (20)
Currency high lights 31.01.17
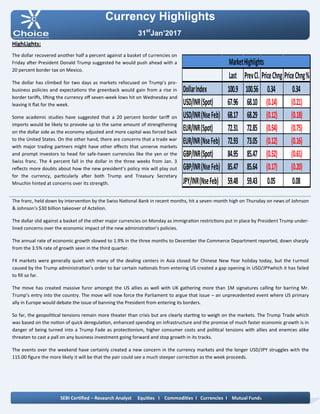
- 1. Currency Highlights 31st Jan’2017 HighLights: The dollar recovered another half a percent against a basket of currencies on Friday after President Donald Trump suggested he would push ahead with a 20 percent border tax on Mexico. The dollar has climbed for two days as markets refocused on Trump’s pro- business policies and expectations the greenback would gain from a rise in border tariffs, lifting the currency off seven-week lows hit on Wednesday and leaving it flat for the week. Some academic studies have suggested that a 20 percent border tariff on imports would be likely to provoke up to the same amount of strengthening on the dollar side as the economy adjusted and more capital was forced back to the United States. On the other hand, there are concerns that a trade war with major trading partners might have other effects that unnerve markets and prompt investors to head for safe-haven currencies like the yen or the Swiss franc. The 4 percent fall in the dollar in the three weeks from Jan. 3 reflects more doubts about how the new president’s policy mix will play out for the currency, particularly after both Trump and Treasury Secretary Mnuchin hinted at concerns over its strength. The franc, held down by intervention by the Swiss National Bank in recent months, hit a seven-month high on Thursday on news of Johnson & Johnson's $30 billion takeover of Actelion. The dollar slid against a basket of the other major currencies on Monday as immigration restrictions put in place by President Trump under- lined concerns over the economic impact of the new administration's policies. The annual rate of economic growth slowed to 1.9% in the three months to December the Commerce Department reported, down sharply from the 3.5% rate of growth seen in the third quarter. FX markets were generally quiet with many of the dealing centers in Asia closed for Chinese New Year holiday today, but the turmoil caused by the Trump administration’s order to bar certain nationals from entering US created a gap opening in USD/JPYwhich it has failed to fill so far. The move has created massive furor amongst the US allies as well with UK gathering more than 1M signatures calling for barring Mr. Trump’s entry into the country. The move will now force the Parliament to argue that issue – an unprecedented event where US primary ally in Europe would debate the issue of banning the President from entering its borders. So far, the geopolitical tensions remain more theater than crisis but are clearly starting to weigh on the markets. The Trump Trade which was based on the notion of quick deregulation, enhanced spending on infrastructure and the promise of much faster economic growth is in danger of being turned into a Trump Fade as protectionism, higher consumer costs and political tensions with allies and enemies alike threaten to cast a pall on any business investment going forward and stop growth in its tracks. The events over the weekend have certainly created a new concern in the currency markets and the longer USD/JPY struggles with the 115.00 figure the more likely it will be that the pair could see a much steeper correction as the week proceeds. SEBI Certified – Research Analyst Equities I Commodities I Currencies I Mutual Funds Last PrevCl. PriceChng PriceChng% DollarIndex 100.9 100.56 0.34 0.34 USD/INR(Spot) 67.96 68.10 (0.14) (0.21) USD/INR(NseFeb) 68.17 68.29 (0.12) (0.18) EUR/INR(Spot) 72.31 72.85 (0.54) (0.75) EUR/INR(NseFeb) 72.93 73.05 (0.12) (0.16) GBP/INR(Spot) 84.95 85.47 (0.52) (0.61) GBP/INR(NseFeb) 85.47 85.64 (0.17) (0.20) JPY/INR(NseFeb) 59.48 59.43 0.05 0.08 MarketHighlights
- 2. Technical View: On hourly chart, the pair has given breakdown of its horizontal trend line at 60.20 levels. The price has given breakdown of its rising trend line at 60 levels on hourly chart. Moreover, prices have been trading below its 21 HSMA which gives the sign of bearishness in the prices. On daily chart momentum indicator RSI is trading below 40 levels which indicates down side momentum can be seen in the prices. In addition, momentum indicator MACD has shown neg- ative crossover which suggest lack of strength in the prices on hourly chart. So for trading perspective, one could JPYINR sell in the range of 59.70 with SL of 60 for target of 59 levels. Pivot levels for the Day Technical View: The pair has been moving in its rising channel pattern and prices have been hovering around of its lower band of channel pattern at 68.05 levels on hourly chart. The price has given breakout of its falling trend line at 68.10 levels on hourly chart. Moreover, prices have been trading above its 21 HSMA which gives the sign of bullishness in the prices. A momentum indicator RSI has shown bullish range shift at 50 levels, which suggest further positive momentum can be seen in the prices. In addition, momentum indicator MACD has shown positive crossover and moving above its signal line on hourly chart. So for trading perspective, one could buy USDINR in range 68.10 with SL of 67.80 for target of 68.60. Currency Highlights 31st Jan’2017 USDINR JPYINR SEBI Certified – Research Analyst Equities I Commodities I Currencies I Mutual Funds S3 S2 S1 Pivot R1 R2 R3 USDINR 67.91 68.06 68.11 68.21 68.26 68.36 68.51 JPYINR 58.81 59.19 59.33 59.57 59.71 59.95 60.33
- 3. Pivot levels for the Day Currency Highlights 31st Jan’2017 GBPINR EURINR Technical View: The price has taken support of its rising channel pattern at 72.70 levels on hourly chart. The EURINR pair has faced strong resistance of its horizontal trend line at 72.90 levels on hourly chart. The pair has been trading below its 21 HSMA on hourly chart, which suggest further weakness can be seen in the prices. On daily chart momentum oscillator RSI has been mov- ing below 50 levels on hourly chart, which suggest bearishness in the prices. A momentum indicator MACD has shown negative crossover on hourly chart, which support our bearish view to the prices. For now we can expect prices should move lower to- wards 72.30 levels in the coming trading session. Technical View: The pair has been moving in its rising channel pattern and prices have been taking support of its lower band of channel pattern at 83.50 levels on daily chart. The prices has given breakout of its horizontal trend line at 84.60 levels on daily chart. Moreover, prices have been trading above 50 DSMA, which suggest short term trend looks up. Moreover, momentum indicator MACD has given posi- tive cross over on daily chart, which gives the sign of bullishness in the prices. The momentum indictor RSI has been trading above 60 levels on daily chart, which suggest the possibilities of further upside momentum in the prices. For now we expect prices should move higher towards 86.20 levels coming trading sessions. SEBI Certified – Research Analyst Equities I Commodities I Currencies I Mutual Funds S3 S2 S1 Pivot R1 R2 R3 GBPINR 84.45 85.03 85.25 85.61 85.83 86.19 86.77 EURINR 71.84 72.49 72.71 73.14 73.36 73.79 74.44
- 4. Currency Highlights SEBI Certified – Research Analyst Equities I Commodities I Currencies I Mutual Funds 31st Jan’2017 Economic Indicators Date Time Data Prior Expected Impact 31.01.17 Tentative Monetary Policy Statement More hawkish than expected = Good for currency; JPYINR 31.01.17 Tentative BOJ Outlook Report More hawkish than expected = Good for currency; JPYINR 31.01.17 Tentative BOJ Policy Rate -0.10% -0.10% Actual > Forecast = Good for currency; JPYINR 31.01.17 12:00 PM BOJ Press Conference More hawkish than expected = Good for currency; JPYINR 31.01.17 1:30 PM ECB President Draghi Speaks More hawkish than expected = Good for currency; EURINR 31.01.17 08:30 PM CB Consumer Confidence 113.7 112.6 Actual > Forecast = Good for currency; USDINR
- 5. Currency Highlights 30th Jan’2017 SEBI Certified – Research Analyst Equities I Commodities I Currencies I Mutual Funds Amit Pathania Digitally signed by Amit Pathania DN: cn=Amit Pathania, o=Choice Equity Broking Pvt. ltd, ou=Research Department, email=amit.pathania@choiceindia.com, c=IN Date: 2017.01.30 18:13:43 +05'30'