1. 29th Oct’14 Currency Highlights
USDINR
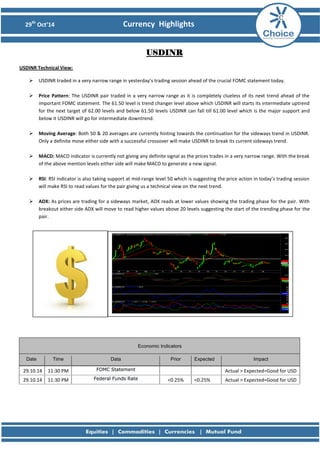
USDINR Technical View:
USDINR traded in a very narrow range in yesterday’s trading session ahead of the crucial FOMC statement today.
Price Pattern: The USDINR pair traded in a very narrow range as it is completely clueless of its next trend ahead of the important FOMC statement. The 61.50 level is trend changer level above which USDINR will starts its intermediate uptrend for the next target of 62.00 levels and below 61.50 levels USDINR can fall till 61.00 level which is the major support and below it USDINR will go for intermediate downtrend.
Moving Average: Both 50 & 20 averages are currently hinting towards the continuation for the sideways trend in USDINR. Only a definite move either side with a successful crossover will make USDINR to break its current sideways trend.
MACD: MACD indicator is currently not giving any definite signal as the prices trades in a very narrow range. With the break of the above mention levels either side will make MACD to generate a new signal.
RSI: RSI indicator is also taking support at mid-range level 50 which is suggesting the price action in today’s trading session will make RSI to read values for the pair giving us a technical view on the next trend.
ADX: As prices are trading for a sideways market, ADX reads at lower values showing the trading phase for the pair. With breakout either side ADX will move to read higher values above 20 levels suggesting the start of the trending phase for the pair.
Economic Indicators Date Time Data Prior Expected Impact
29.10.14
11:30 PM FOMC Statement
Actual > Expected=Good for USD
29.10.14
11:30 PM Federal Funds Rate
<0.25%
<0.25%
Actual > Expected=Good for USD
2. 29th Oct’14 Currency Highlights
EURINR
EURINR Technical View:
The downtrend remains intact for EURINR pair as the there is no sign of reversal.
Price Pattern: EURINR continues remain in the sideways trend as prices are failing to stay higher. In the today trading session EURINR take major clue from the USDINR trend and if USDINR fails to reverse for uptrend then EURINR prices will observe a major selling.
Moving Average: Prices continues to trade below the both averages which makes the pair bearish. As mention earlier till there is no successive crossover of both the averages downtrend to remain intact.
MACD: MACD indicator buy signal continues but it will better to act on new sell signal generated by MACD as the trend remains down providing an opportunity to act in-line with the current downtrend.
RSI: Since momentum is weak RSI is failing to read values above the mid-range level 50 which suggest the downtrend remains valid. RSI if reads values above 50 levels but again fails and reverse to read below the 50 levels then this will confirm the pair is ready to make new lows.
ADX: ADX indicator is now showing the trading phase for the pair as it is failing to read for the trending phase. With a definitive price action in today’s trading session will only make ADX to read higher values confirming the trending phase for the pair.
Economic Indicators Date Time Data Prior Expected Impact
29.10.14
03:00 PM German 10-y Bond Auction
No Consistent Effect
3. 29th Oct’14 Currency Highlights
GBPINR
GBPINR Technical View:
The GBPINR remains in the strong sideways trend and looking for a breakout either side.
Price Pattern: GBPINR continues for a sideways trend as the prices are trading in a very narrow range. Today’s trading session will be very important as GBPINR will take its major clue from the USDINR trend deciding which side it will breakout.
Moving Average: For the sideways trend prices continues to trades above and below 50 & 20 EMA’s on hourly basis .Till there is no definite crossover signal generated by the averages the sideways trend to remain intact for the pair.
MACD: MACD indicator is at the over brought level suggesting it may reverse to generate a sell signal. This will give us early hint for the breakout may happen downward but only the price action will confirm the breakout is genuine or not..
RSI: Momentum indicator RSI continues to take support at the mid-range 50 levels. Once RSI breaks the 50 levels then it will be the first indication for the upcoming weakness in the pair and if RSI continues to read above the 50 levels then we can anticipate the breakout may happen in upward direction.
ADX: ADX indicator is acting in-line with the current sideways trend showing the trading phase for the pair. Till there is no breakout of prices for either upside or downside, ADX will continue to show trading phase for the pair.
4. 29th Oct’14 Currency Highlights
Economic Indicators Date Time Data Prior Expected Impact
29.10.14
03:00 PM Net Lending to Individuals m/m
3.2B
2.8B
Actual > Expected=Good for GBP
29.10.14
03:00 PM M4 Money Supply m/m
0.3%
0.5%
Actual > Expected=Good for GBP
29.10.14
03:00 PM Mortgage Approvals
64K
63K
Actual > Expected=Good for GBP
29.10.14
11:00 PM MPC Member Haldane Speaks
More Hawkish=Good for GBP
5. 29th Oct’14 Currency Highlights
JPYINR
JPYINR Technical View:
Like EURINR pair, JPYINR continues its strong intermediate downtrend.
Price Pattern: The price pattern of JPYINR continues to remain bearish showing no sign of reversal. Prices are also getting pressure from the weak yen and if USDINR fails to reverse for uptrend then JPYINR will be the weakest currency pair.
Moving Average: As the prices remains to trade and close below the both averages showing no sign of reversal. Here prices are facing resistance of the upper 50 EMA which suggest the pair is sell on rise.
MACD: Now the only signal to take from the MACD indicator will be sell signal as the intermediate trend is down .As mention earlier it will be better to act on this sell signal to get a higher probability trade setup.
RSI: RSI momentum is weak as it is failing to read values above the mid-range 50 levels. This makes the pair outlook bearish till RSI continues to read values below the mid-range 50 levels.
ADX: ADX continues its trending phase for JPYINR pair which suggest the large range and higher volatility to be observed in today’s trading session.
Economic Indicators Date Time Data Prior Expected Impact
29.10.14
05:20 AM Prelim Industrial Production m/m
-1.9%
2.3%
Actual > Expected=Good for JPY
7. 29th Oct’14 Currency Highlights
Disclaimer
This is solely for information of clients of Choice India and does not construe to be an investment advice. It is also not intended as an offer or solicitation for the purchase and sale of any financial instruments. Any action taken by you on the basis of the information contained herein is your responsibility alone and Choice India its subsidiaries or its employees or associates will not be liable in any manner for the consequences of such action taken by you. We have exercised due diligence in checking the correctness and authenticity of the information contained in this recommendation, but Choice India or any of its subsidiaries or associates or employees shall not be in any way responsible for any loss or damage that may arise to any person from any inadvertent error in the information contained in this recommendation or any action taken on basis of this information. Technical analysis studies market psychology, price patterns and volume levels. It is used to forecast future price and market movements. Technical analysis is complementary to fundamental analysis and news sources. The recommendations issued herewith might be contrary to recommendations issued by Choice India in the company research undertaken as the recommendations stated in this report is derived purely from technical analysis. Choice India has based this document on information obtained from sources it believes to be reliable but which it has not independently verified; Choice India makes no guarantee, representation or warranty and accepts no responsibility or liability as to its accuracy or completeness. The opinions contained within the report are based upon publicly available information at the time of publication and are subject to change without notice. The information and any disclosures provided herein are in summary form and have been prepared for informational purposes. The recommendations and suggested price levels are intended purely for trading purposes. The recommendations are valid for the day of the report however trading trends and volumes might vary substantially on an intraday basis and the recommendations may be subject to change. The information and any disclosures provided herein may be considered confidential. Any use, distribution, modification, copying, forwarding or disclosure by any person is strictly prohibited. The information and any disclosures provided herein do not constitute a solicitation or offer to purchase or sell any security or other financial product or instrument. The current performance may be unaudited. Past performance does not guarantee future returns. There can be no assurance that investments will achieve any targeted rates of return, and there is no guarantee against the loss of your entire investment.
POTENTIAL CONFLICT OF INTEREST DISCLOSURE (as on date of report) Disclosure of interest statement – • Analyst interest of the stock /Instrument(s): - No. • Firm interest of the stock / Instrument (s): - No.