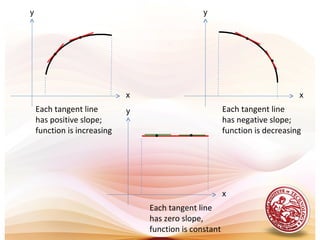
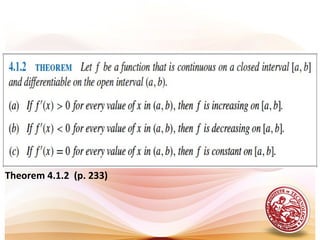
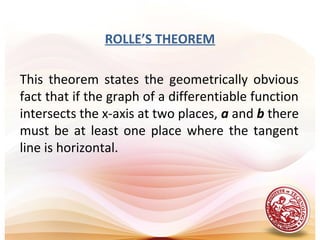
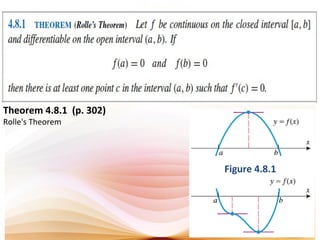
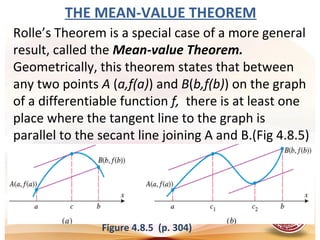
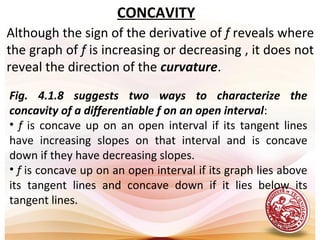
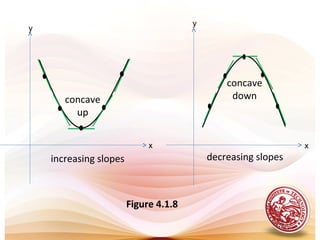
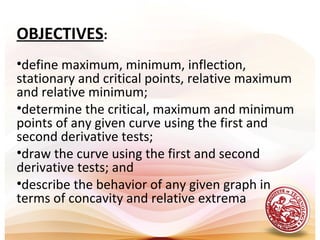
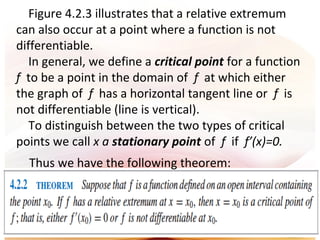
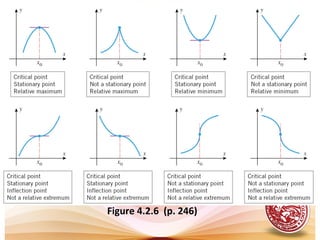
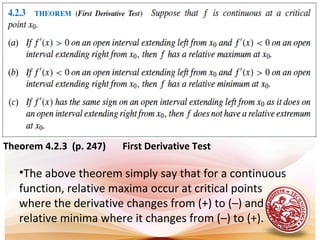
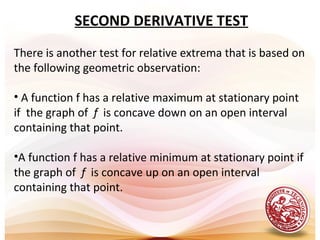
This document discusses analysis of functions including derivatives, extrema, and graphing. It defines key concepts such as increasing and decreasing functions, concavity, points of inflection, stationary points, and relative maxima and minima. It presents Rolle's theorem and the mean value theorem. Examples demonstrate finding critical points and determining the behavior of functions based on the signs of the first and second derivatives. The first and second derivative tests are introduced to identify relative extrema at critical points.

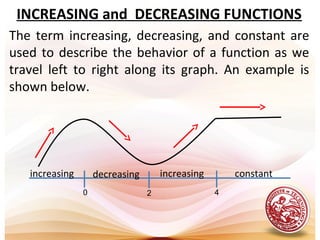
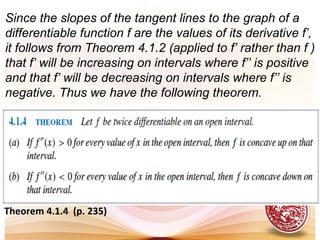
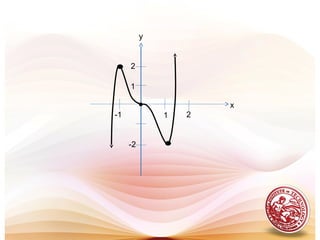
![.gsindecreaandgsinincreais3x4xf(x)whichonintervalstheFind.1 2
+−=
y
( ) ( )
( ) ( ]
( ) [ )
+∞⇒>>
∞⇒<<
−=−=
2,onincreasingisf2xwhen0x'f
,2-ondecreasingisf2xwhen0x'f
thus
2x24x2x'f
-1
2
3
x
3x4x)x(f 2
+−=
increasing
decreasing
EXAMPLE:](https://image.slidesharecdn.com/l19increasingdecreasingfunctions-151123061558-lva1-app6891/85/L19-increasing-amp-decreasing-functions-9-320.jpg)
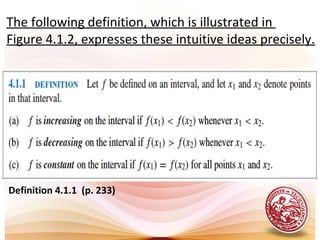
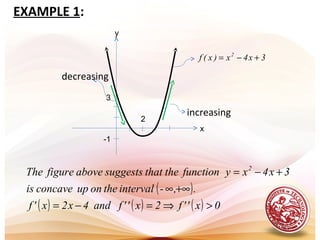
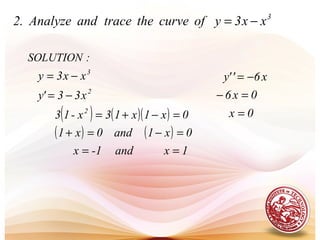
![.gsindecreaandgsinincreaisxf(x)whichonintervalstheFind.2 3
=
3
x)x(f =
( )
( ) ( ]
( ) [ )
+∞⇒>>
∞⇒<>
=
0,onincreasingisf0xwhen0x'f
,0-onincreasingisf0xwhen0x'f
thus
x3x'f 2
increasing
increasing
y
-4
3
4
x
-3](https://image.slidesharecdn.com/l19increasingdecreasingfunctions-151123061558-lva1-app6891/85/L19-increasing-amp-decreasing-functions-10-320.jpg)
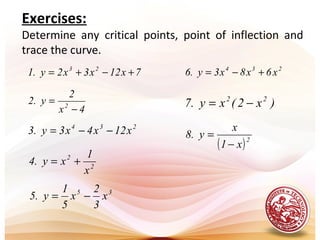
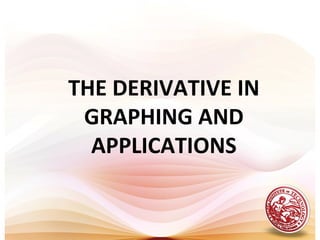
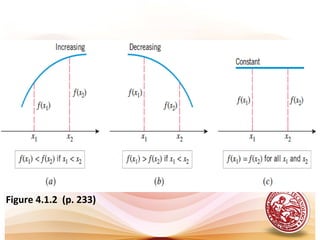
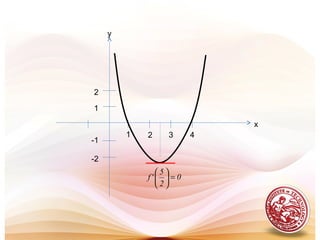
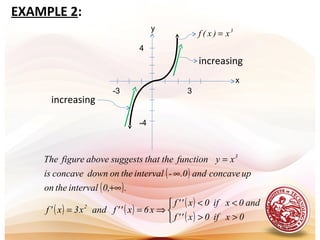
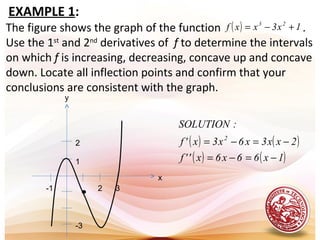
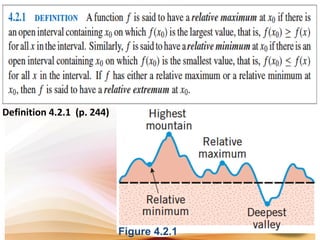
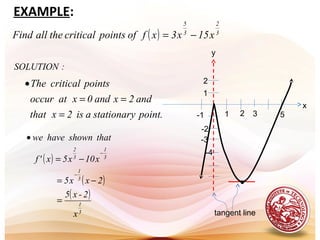
![EXAMPLE:
Find the two x-intercepts of the function
and confirm that f’(c) = 0 at some point between those
intercepts.
( ) 4x5xxf 2
+−=
Solution:
( ) ( )( )
[ ]
( ) ( )
( )
( ) ( ) .0cf'whichat1,4
intervaltheonpointais
2
5
cso,
2
5
x;05x2xf'
0.cf'thatsuch1,4intervaltheincpointoneleast
atofexistencetheguaranteedareweThus.1,4intervalthe
onsatisfiedareTheoremsRolle'ofhypothesesthe,everywhere
abledifferentiandcontinuousisfpolynomialthesince4x
and1xareintercepts-xtheso,4x1x4x5xxf 2
=
===−=
=
=
=−−=+−=](https://image.slidesharecdn.com/l19increasingdecreasingfunctions-151123061558-lva1-app6891/85/L19-increasing-amp-decreasing-functions-14-320.jpg)
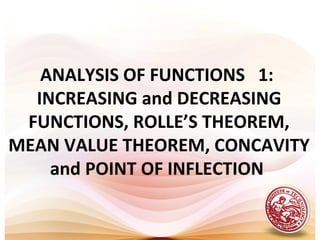
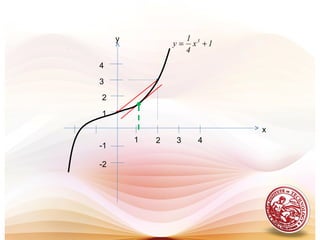
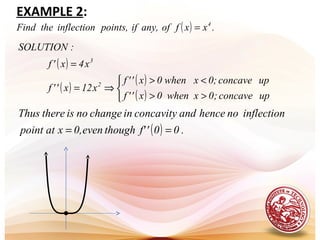
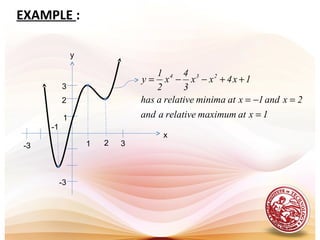
![EXAMPLE:
Show that the function satisfies the hypotheses
of the mean-value theorem over the interval [0,2], and
find all values of c in the interval (0,2) at which the tangent
line to the graph of f is parallel to the secant line joining
the points (0,f(0)) and (2,f(2)).
( ) 1x
4
1
xf 3
+=
Solution:
[ ] ( )
( ) ( ) ( ) ( ) ( ) ( )
( ) ( ) ( )
( ).0,2intervaltheinlies1.15only,15.1
3
32
3
4
cTherefore
4c3
02
13
4
c3
ab
afbf
cf'Thus
4
c3
cf'and,
4
x3
xf'32fbf,10fafBut
2.band0awithdsatisfieareTheoremValue-Meantheofhypotheses
theso,0,2onabledifferentiand0,2oncontinuousisfparticularIn
.polynomialaisitbecauseeverywhereiabledifferentandcontinuousisf
2
2
22
+±≈±=±=
=⇒
−
−
=⇒
−
−
=
==⇒====
==](https://image.slidesharecdn.com/l19increasingdecreasingfunctions-151123061558-lva1-app6891/85/L19-increasing-amp-decreasing-functions-18-320.jpg)
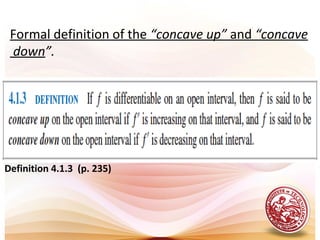
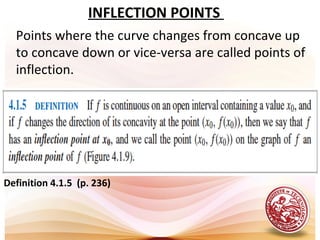
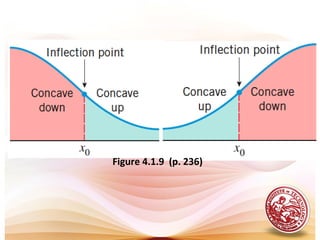
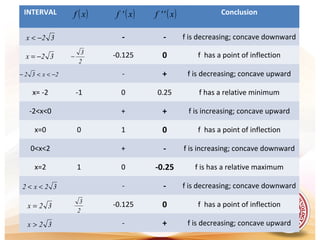
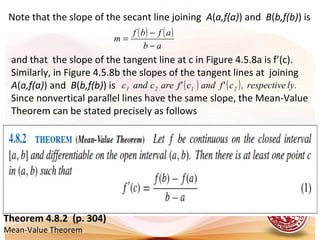
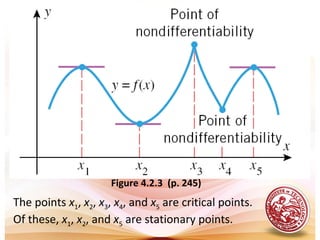
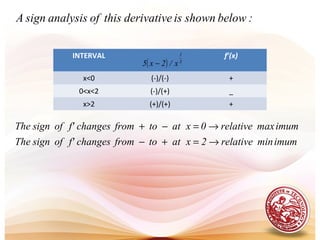
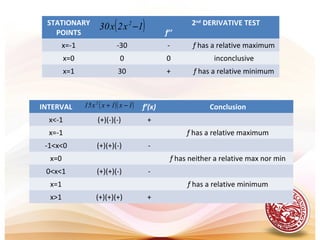
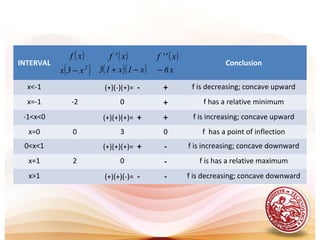
![INTERVAL (3x)(x-2) f’(x) CONCLUSION
x<0 (-)(-) + f is increasing on
0<x<2 (+)(-) - f is decreasing on
x>2 (+)(+) + f is increasing on
( ]0,∞−
[ ]2,0
[ )+∞,2
INTERVAL (6)(x-1) f’’(x) CONCLUSION
x<1 (-) - f is concave down on
x>1 (+) + f is concave up on ( )+∞,1
( )1,∞−
The 2nd
table shows that there is a point of inflection at x=1,
since f changes from concave up to concave down at that point.
The point of inflection is (1,-1).](https://image.slidesharecdn.com/l19increasingdecreasingfunctions-151123061558-lva1-app6891/85/L19-increasing-amp-decreasing-functions-29-320.jpg)
![( )( ) ( )( )( )( )
( )
( ) ( ) ( )( )
( ) ( ) ( )[ ]
( )( )
( )( )
( )( )
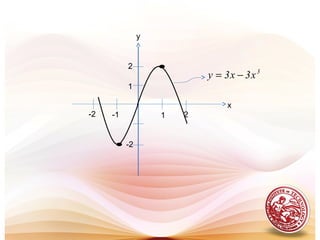
32xand0x
012xx4x8
024x2x44x-
016x4x28x44x-
016x4x42x44x-
016x4x4x4x8x4
x4
x2x4216x4x8x4
''y
22
22
222
222
2222
42
222
±==
=−+
=+−+
=+−++
=+−+++
=+−+−−+
+
++−−−+
=](https://image.slidesharecdn.com/l19increasingdecreasingfunctions-151123061558-lva1-app6891/85/L19-increasing-amp-decreasing-functions-53-320.jpg)