Downloaded 18 times

![6
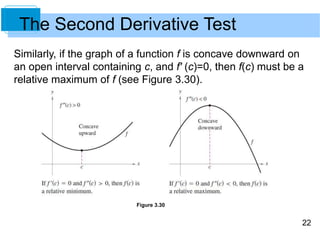
The following graphical interpretation of concavity is useful.
1. Let f be differentiable on an open interval I. If the graph
of f is concave upward on I, then the graph of f lies
above all of its tangent lines on I. [See Figure 3.23(a).]
Figure 3.23(a)
Concavity](https://image.slidesharecdn.com/larcalc10ch03sec4-140831021511-phpapp01/85/Lar-calc10-ch03_sec4-6-320.jpg)
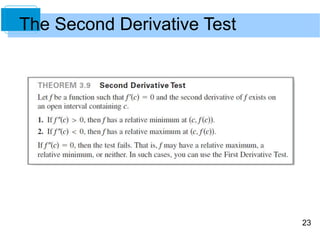
![7
2. Let f be differentiable on an open interval I. If the graph
of f is concave downward on I, then the graph of f lies
below all of its tangent lines on I. [See Figure 3.23(b).]
Figure 3.23(b)
Concavity](https://image.slidesharecdn.com/larcalc10ch03sec4-140831021511-phpapp01/85/Lar-calc10-ch03_sec4-7-320.jpg)
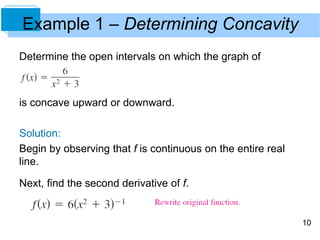
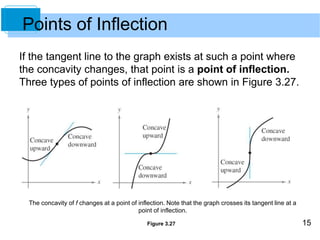
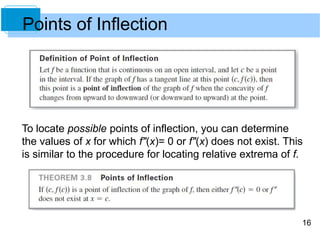
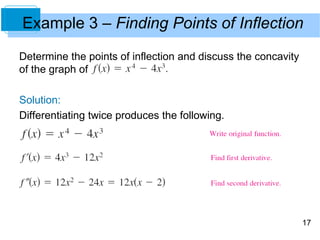
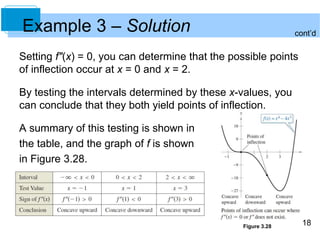
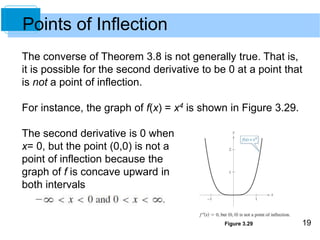


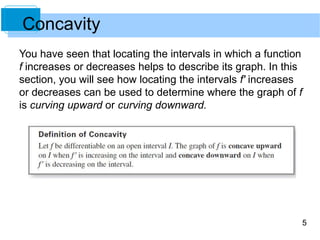
This document discusses techniques for determining concavity, points of inflection, and extrema of functions using the first and second derivatives. It defines concavity and how to determine intervals where a function is concave upward or downward using the second derivative test. Points of inflection are identified as points where the concavity changes. Examples demonstrate how to apply these concepts to find concave intervals, points of inflection, and relative extrema of various functions.