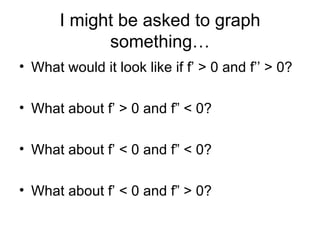
This document discusses concepts related to using the first and second derivatives to analyze functions and graph their behavior, including:
- Concave up and down shapes defined by increasing/decreasing rate of change
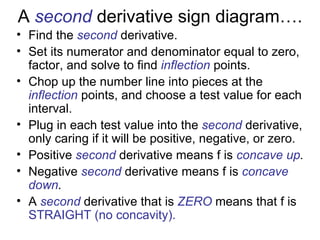
- Inflection points occurring where concavity changes
- The second derivative indicating the rate of change of the rate of change (concavity) of the original function
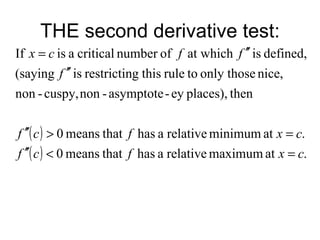
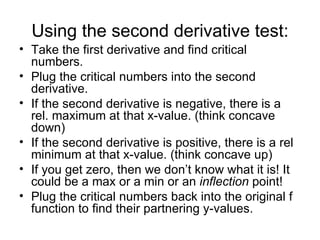
- Using the second derivative test to determine if critical points are relative maxima or minima based on the concavity.
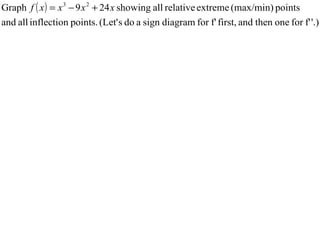
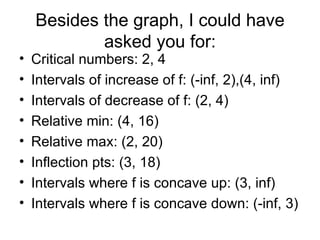
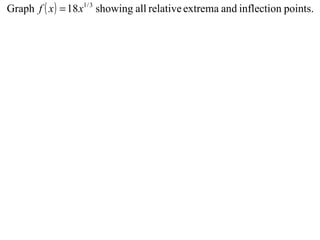
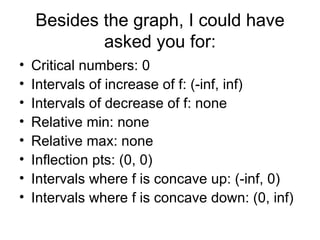
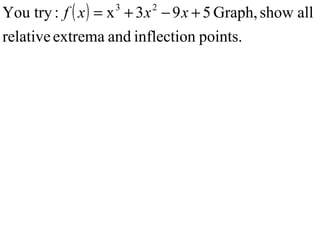
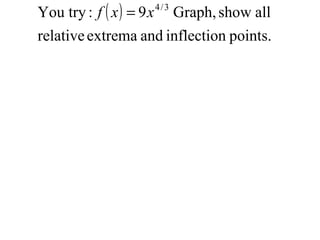
It provides examples of applying these concepts to specific functions through determining critical points, inflection points, intervals of increasing/decreasing behavior, and concavity. It also demonstrates graphing functions based on this analysis