fundamentals of corporate finance 11th canadian edition test bank.docx
Currency high lights 22.12.16
1. Currency Highlights
22nd
Dec’2016
HighLights:
Indian Rupee recovered from lows & rose to 67.91 on Wednesday
US Existing Home Sales jumped to 5.61 million in previous month
Euro Zone Consumer Confidence at negative 5-level in November
UK’s Public Sector Net Borrowing at surplus 12.2 bn Pounds in Nov
Indian Rupee recovered from its low and appreciated around 13 paise
to end at 67.91 against the US dollar on Wednesday. The currency ap-
preciated on account of selling of dollars from exporters and bankers.
Further, gains in the currencies of Asian peers led to positive move-
ment in the currency.
However, weak domestic market sentiments capped sharp upside in
the currency. So far this year, foreign institutional investors have
bought $3.9 billion in equities and sold $6.84 billion in debt.
Indian Rupee moved in the range of 67.793 to 68.035 in Wednesday’s
trade. The Reserve Bank of India (RBI) fixed reference rate for the dol-
lar was seen at 67.8724 and Euro stood at 70.6077 as on 21st Dec’16 .
For the month of December 2016, FII outflows in equities totalled at Rs.2062.59crores ($302.87 million) as on 21st December
2016. Year to date basis, net capital inflows stood at Rs.26679.88crores ($4068.94 million) as on 21st December 2016.
US Dollar Index declined around 0.3 percent in Wednesday’s trading session as investors wind up there position ahead of the
year-end holidays. However, rise in risk aversion in global market sentiments which led to increase in demand for the low
yielding currency coupled with favourable economic data from the country cushioned sharp fall in the currency.
US Existing Home Sales jumped to 5.61 million in November as against a rise of 5.57 million in October.
Euro against dollar rose around 0.4 percent on Wednesday on account of weakness in the dollar index. However, sharp upside
in the currency was capped due to unfavourable economic data from the region along with weak global market sentiments.
Belgian National Bank of Belgium (NBB) Business Climate plunged by 0.2-mark in December as against a drop of 1.8-level in
November. Euro Zone Consumer Confidence was at negative 5-level in November from a decline of 6-mark in October.
The Sterling Pound declined around 0.1 percent in Wednesday’s trade as a result of unfavourable economic data from the
country coupled with weak global market sentiments. However, weakness in the dollar index restricted sharp downside in the
currency.
UK’s Public Sector Net Borrowing was at a surplus of 12.2 billion Pounds in November from a surplus of 4.3 billion Pounds in
October.
The Japanese Yen against dollar appreciated around 0.3 percent in Wednesday’s trading session due to rise in risk aversion in
global market sentiments which led to increase in demand for the low yielding currency. Japan’s Industries Activity grew by 0.2
percent in the month of October.
SEBI Certified – Research Analyst Equities I Commodities I Currencies I Mutual Funds
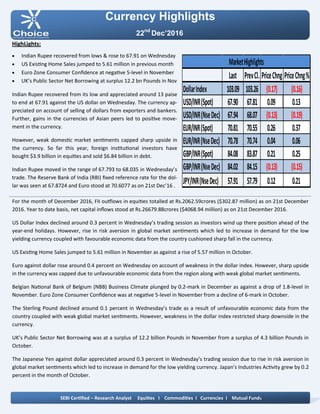
Last PrevCl. PriceChng PriceChng%
DollarIndex 103.09 103.26 (0.17) (0.16)
USD/INR(Spot) 67.90 67.81 0.09 0.13
USD/INR(NseDec) 67.94 68.07 (0.13) (0.19)
EUR/INR(Spot) 70.81 70.55 0.26 0.37
EUR/INR(NseDec) 70.78 70.74 0.04 0.06
GBP/INR(Spot) 84.08 83.87 0.21 0.25
GBP/INR(NseDec) 84.02 84.15 (0.13) (0.15)
JPY/INR(NseDec) 57.91 57.79 0.12 0.21
MarketHighlights
2. Technical View:
On daily chart JPYINR price has shown breakdown of its
falling wedge pattern at 62 levels. The price has given
breakdown of its horizontal trend line at 58.50 levels on
daily chart.
Moreover, prices have been trading below its 21 DEMA
which gives the sign of bearishness in the prices.
On daily chart momentum indicator RSI is trading below
40 levels which suggest further weakness can be seen in
the prices.
In addition, momentum indicator MACD has shown neg-
ative crossover and remained below signal line on daily
chart.
So for trading perspective, one could JPYINR sell in the
range of 57.95 with SL of 58.30 for target of 57.30 levels.
Pivot levels for the Day
Technical View:
The pair has shown breakout of its falling trend line at
67.50 levels on daily chart. On daily chart USDINR price
has retested its falling trend line at 67.20 levels.
On daily chart price has taken support of its 61.80% Fib-
onacci retracement levels.
Moreover, prices have been trading above its 50 DEMA
which gives the sign of bullishness in the prices.
A momentum indicator RSI has been trading above 40
levels, which suggest further positive momentum can be
seen in the prices.
In addition, momentum indicator MACD has shown
positive crossover on hourly chart.
So for trading perspective, one could buy USDINR in
range 67.90 with SL of 67.60 for target of 68.40.
Currency Highlights
22nd
Dec’2016
USDINR JPYINR
SEBI Certified – Research Analyst Equities I Commodities I Currencies I Mutual Funds
S3 S2 S1 Pivot R1 R2 R3
USDINR 67.65 67.79 67.86 67.93 68.00 68.07 68.21
JPYINR 57.43 57.64 57.77 57.85 57.98 58.06 58.27
3. Pivot levels for the Day
Currency Highlights
22nd
Dec’2016
GBPINR EURINR
Technical View:
The price has shown breakdown of its falling channel a
pattern at 72 levels on daily chart. The EURINR pair has
shown horizontal trend line at 72.50 levels on daily
chart.
The pair has been trading below its 21 DEMA on daily
chart, which suggest further weakness can be seen in
the prices.
On daily chart momentum oscillator RSI has remained
below 50 which suggest bearishness in the prices.
A momentum indicator MACD has shown negative
crossover on daily chart, which add more bearishness
in the prices.
For now we can expect prices should move lower to-
wards 70.15 levels in the coming trading session.
Technical View:
The price has shown breakdown of its rising channel
pattern at 85 levels on daily chart. The pair has been
facing resistance of its falling trend line at 86.10 levels
on daily chart. The prices have been facing resistance of
its horizontal line at 86 levels.
Moreover, prices have been trading below 50 DEMA,
which suggest short term trend looks negative.
Moreover, momentum indicator MACD has given nega-
tive cross over on daily chart, which gives the sign of
bearishness in the prices.
The momentum indictor RSI has been trading below 60
levels on daily chart, which suggest the possibilities of
further weakness in the prices.
For now we expect prices should move lower towards
83.40 levels coming trading sessions.
SEBI Certified – Research Analyst Equities I Commodities I Currencies I Mutual Funds
S3 S2 S1 Pivot R1 R2 R3
GBPINR 83.05 83.53 83.77 84.01 84.25 84.49 84.97
EURINR 70.21 70.49 70.63 70.77 70.91 71.05 71.33
4. Currency Highlights
SEBI Certified – Research Analyst Equities I Commodities I Currencies I Mutual Funds
22nd
Dec’2016
Economic Indicators
Date Time Data Prior Expected Impact
22.12.16 07:00 PM Core Durable Goods Orders
m/m
0.8% 0.2% Actual > Forecast = Good
for currency; USDINR
22.12.16 07:00 PM Final GDP q/q 3.2% 3.3% Actual > Forecast = Good
for currency; USDINR
22.12.16 07:00 PM Unemployment Claims 254K 255K Actual < Forecast = Good
for currency; USDINR
22.12.16 08:30 PM Personal Spending m/m 0.3% 0.4% Actual > Forecast = Good
for currency; USDINR
22.12.16 08:30 PM CB Leading Index m/m 0.1% 0.2% Actual > Forecast = Good
for currency; USDINR
5. Currency Highlights
22nd
Dec’2016
SEBI Certified – Research Analyst Equities I Commodities I Currencies I Mutual Funds
Anish Vyas
Digitally signed by Anish Vyas
DN: cn=Anish Vyas, o=Choice Merchandise
Broking Pvt. Ltd, ou=Sr. Research Associate,
email=anish.vyas@choiceindia.com, c=IN
Date: 2016.12.22 09:19:59 +05'30'