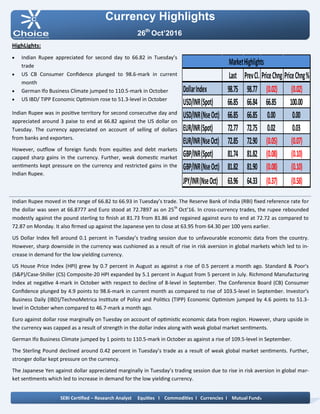
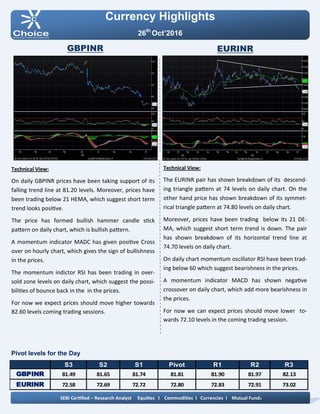
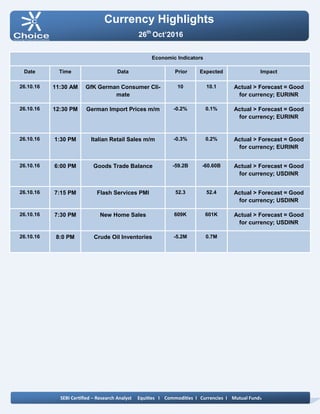
Currency Highlights
26th
Oct’2016
HighLights:
 Indian Rupee appreciated for second day to 66.82 in Tuesday’s
trade
 US CB Consumer Confidence plunged to 98.6-mark in current
month
 German Ifo Business Climate jumped to 110.5-mark in October
 US IBD/ TIPP Economic Optimism rose to 51.3-level in October
Indian Rupee was in positive territory for second consecutive day and
appreciated around 3 paise to end at 66.82 against the US dollar on
Tuesday. The currency appreciated on account of selling of dollars
from banks and exporters.
However, outflow of foreign funds from equities and debt markets
capped sharp gains in the currency. Further, weak domestic market
sentiments kept pressure on the currency and restricted gains in the
Indian Rupee.
Indian Rupee moved in the range of 66.82 to 66.93 in Tuesday’s trade. The Reserve Bank of India (RBI) fixed reference rate for
the dollar was seen at 66.8777 and Euro stood at 72.7897 as on 25th
Oct’16. In cross-currency trades, the rupee rebounded
modestly against the pound sterling to finish at 81.73 from 81.86 and regained against euro to end at 72.72 as compared to
72.87 on Monday. It also firmed up against the Japanese yen to close at 63.95 from 64.30 per 100 yens earlier.
US Dollar Index fell around 0.1 percent in Tuesday’s trading session due to unfavourable economic data from the country.
However, sharp downside in the currency was cushioned as a result of rise in risk aversion in global markets which led to in-
crease in demand for the low yielding currency.
US House Price Index (HPI) grew by 0.7 percent in August as against a rise of 0.5 percent a month ago. Standard & Poor's
(S&P)/Case-Shiller (CS) Composite-20 HPI expanded by 5.1 percent in August from 5 percent in July. Richmond Manufacturing
Index at negative 4-mark in October with respect to decline of 8-level in September. The Conference Board (CB) Consumer
Confidence plunged by 4.9 points to 98.6-mark in current month as compared to rise of 103.5-level in September. Investor's
Business Daily (IBD)/TechnoMetrica Institute of Policy and Politics (TIPP) Economic Optimism jumped by 4.6 points to 51.3-
level in October when compared to 46.7-mark a month ago.
Euro against dollar rose marginally on Tuesday on account of optimistic economic data from region. However, sharp upside in
the currency was capped as a result of strength in the dollar index along with weak global market sentiments.
German Ifo Business Climate jumped by 1 points to 110.5-mark in October as against a rise of 109.5-level in September.
The Sterling Pound declined around 0.42 percent in Tuesday’s trade as a result of weak global market sentiments. Further,
stronger dollar kept pressure on the currency.
The Japanese Yen against dollar appreciated marginally in Tuesday’s trading session due to rise in risk aversion in global mar-
ket sentiments which led to increase in demand for the low yielding currency.
SEBI Certified – Research Analyst Equities I Commodities I Currencies I Mutual Funds
Last PrevCl. PriceChng PriceChng%
DollarIndex 98.75 98.77 (0.02) (0.02)
USD/INR(Spot) 66.85 66.84 66.85 100.00
USD/INR(NseOct) 66.85 66.85 0.00 0.00
EUR/INR(Spot) 72.77 72.75 0.02 0.03
EUR/INR(NseOct) 72.85 72.90 (0.05) (0.07)
GBP/INR(Spot) 81.74 81.82 (0.08) (0.10)
GBP/INR(NseOct) 81.82 81.90 (0.08) (0.10)
JPY/INR(NseOct) 63.96 64.33 (0.37) (0.58)
MarketHighlights
Technical View:
On daily chart JPYINR prices have been trading in sym-
metrical triangle pattern and shown breakdown of its
symmetrical triangle pattern. However, price has formed
bearish candle stick on daily chart.
Moreover, price has shown breakdown of its rising trend
line at 65 levels. On the other hand price has shown
breakdown of its rising trend line at 65.60 levels on daily
chart.
Furthermore, prices have been trading below its 21 DE-
MA, which suggest short term trend is negative.
On daily chart momentum indicator RSI is trading below
at 45 levels which suggest further weakness in the pric-
es.
So for trading perspective, one could use sell in the
range of 64.10 with SL of 64.45 for target of 63.40 levels.
Pivot levels for the Day
Technical View:
The pair has been trading in falling wedge pattern from
past few months and prices have been facing resistance
of its upper band at 67 levels. On daily USDINR prices
have been trading in falling channel formation from past
few weeks and prices have been facing resistance at up-
per band of channel pattern at 67.05 levels.
On the other hand, prices have been facing resistance of
horizontal trend line at 66.95 levels on daily chart.
Moreover, prices have been trading below 50 DEMA
which gives the sign of bearishness in the prices.
A momentum indictor RSI has traded below 60 levels,
which suggest further weakness in the prices.
In addition, momentum indicator MACD has shown neg-
ative crossover on daily chart.
So for trading perspective, one could sell in range 66.95
with SL of 67.25 for target of 66.30.
Currency Highlights
26th
Oct’2016
USDINR JPYINR
SEBI Certified – Research Analyst Equities I Commodities I Currencies I Mutual Funds
S3 S2 S1 Pivot R1 R2 R3
USDINR 66.67 66.77 66.81 66.87 66.91 66.97 67.07
JPYINR 63.59 63.80 63.88 64.01 64.09 64.22 64.43
Pivot levels for the Day
Currency Highlights
26th
Oct’2016
GBPINR EURINR
Technical View:
The EURINR pair has shown breakdown of its descend-
ing triangle pattern at 74 levels on daily chart. On the
other hand price has shown breakdown of its symmet-
rical triangle pattern at 74.80 levels on daily chart.
Moreover, prices have been trading below its 21 DE-
MA, which suggest short term trend is down. The pair
has shown breakdown of its horizontal trend line at
74.70 levels on daily chart.
On daily chart momentum oscillator RSI have been trad-
ing below 60 which suggest bearishness in the prices.
A momentum indicator MACD has shown negative
crossover on daily chart, which add more bearishness in
the prices.
For now we can expect prices should move lower to-
wards 72.10 levels in the coming trading session.
Technical View:
On daily GBPINR prices have been taking support of its
falling trend line at 81.20 levels. Moreover, prices have
been trading below 21 HEMA, which suggest short term
trend looks positive.
The price has formed bullish hammer candle stick
pattern on daily chart, which is bullish pattern.
A momentum indicator MADC has given positive Cross
over on hourly chart, which gives the sign of bullishness
in the prices.
The momentum indictor RSI has been trading in over-
sold zone levels on daily chart, which suggest the possi-
bilities of bounce back in the in the prices.
For now we expect prices should move higher towards
82.60 levels coming trading sessions.
SEBI Certified – Research Analyst Equities I Commodities I Currencies I Mutual Funds
S3 S2 S1 Pivot R1 R2 R3
GBPINR 81.49 81.65 81.74 81.81 81.90 81.97 82.13
EURINR 72.58 72.69 72.72 72.80 72.83 72.91 73.02
Currency Highlights
SEBI Certified – Research Analyst Equities I Commodities I Currencies I Mutual Funds
26th
Oct’2016
Economic Indicators
Date Time Data Prior Expected Impact
26.10.16 11:30 AM GfK German Consumer Cli-
mate
10 10.1 Actual > Forecast = Good
for currency; EURINR
26.10.16 12:30 PM German Import Prices m/m -0.2% 0.1% Actual > Forecast = Good
for currency; EURINR
26.10.16 1:30 PM Italian Retail Sales m/m -0.3% 0.2% Actual > Forecast = Good
for currency; EURINR
26.10.16 6:00 PM Goods Trade Balance -59.2B -60.60B Actual > Forecast = Good
for currency; USDINR
26.10.16 7:15 PM Flash Services PMI 52.3 52.4 Actual > Forecast = Good
for currency; USDINR
26.10.16 7:30 PM New Home Sales 609K 601K Actual > Forecast = Good
for currency; USDINR
26.10.16 8:0 PM Crude Oil Inventories -5.2M 0.7M
Currency Highlights
26th
Oct’2016
SEBI Certified – Research Analyst Equities I Commodities I Currencies I Mutual Funds
Amit Pathania
Digitally signed by Amit Pathania
DN: cn=Amit Pathania, o=Choice Equity Broking Pvt. ltd, ou=Research
Department, email=amit.pathania@choiceindia.com, c=IN
Date: 2016.10.26 09:07:04 +05'30'

Currency high lights 26.10.16

  • 1.
    Currency Highlights 26th Oct’2016 HighLights:  IndianRupee appreciated for second day to 66.82 in Tuesday’s trade  US CB Consumer Confidence plunged to 98.6-mark in current month  German Ifo Business Climate jumped to 110.5-mark in October  US IBD/ TIPP Economic Optimism rose to 51.3-level in October Indian Rupee was in positive territory for second consecutive day and appreciated around 3 paise to end at 66.82 against the US dollar on Tuesday. The currency appreciated on account of selling of dollars from banks and exporters. However, outflow of foreign funds from equities and debt markets capped sharp gains in the currency. Further, weak domestic market sentiments kept pressure on the currency and restricted gains in the Indian Rupee. Indian Rupee moved in the range of 66.82 to 66.93 in Tuesday’s trade. The Reserve Bank of India (RBI) fixed reference rate for the dollar was seen at 66.8777 and Euro stood at 72.7897 as on 25th Oct’16. In cross-currency trades, the rupee rebounded modestly against the pound sterling to finish at 81.73 from 81.86 and regained against euro to end at 72.72 as compared to 72.87 on Monday. It also firmed up against the Japanese yen to close at 63.95 from 64.30 per 100 yens earlier. US Dollar Index fell around 0.1 percent in Tuesday’s trading session due to unfavourable economic data from the country. However, sharp downside in the currency was cushioned as a result of rise in risk aversion in global markets which led to in- crease in demand for the low yielding currency. US House Price Index (HPI) grew by 0.7 percent in August as against a rise of 0.5 percent a month ago. Standard & Poor's (S&P)/Case-Shiller (CS) Composite-20 HPI expanded by 5.1 percent in August from 5 percent in July. Richmond Manufacturing Index at negative 4-mark in October with respect to decline of 8-level in September. The Conference Board (CB) Consumer Confidence plunged by 4.9 points to 98.6-mark in current month as compared to rise of 103.5-level in September. Investor's Business Daily (IBD)/TechnoMetrica Institute of Policy and Politics (TIPP) Economic Optimism jumped by 4.6 points to 51.3- level in October when compared to 46.7-mark a month ago. Euro against dollar rose marginally on Tuesday on account of optimistic economic data from region. However, sharp upside in the currency was capped as a result of strength in the dollar index along with weak global market sentiments. German Ifo Business Climate jumped by 1 points to 110.5-mark in October as against a rise of 109.5-level in September. The Sterling Pound declined around 0.42 percent in Tuesday’s trade as a result of weak global market sentiments. Further, stronger dollar kept pressure on the currency. The Japanese Yen against dollar appreciated marginally in Tuesday’s trading session due to rise in risk aversion in global mar- ket sentiments which led to increase in demand for the low yielding currency. SEBI Certified – Research Analyst Equities I Commodities I Currencies I Mutual Funds Last PrevCl. PriceChng PriceChng% DollarIndex 98.75 98.77 (0.02) (0.02) USD/INR(Spot) 66.85 66.84 66.85 100.00 USD/INR(NseOct) 66.85 66.85 0.00 0.00 EUR/INR(Spot) 72.77 72.75 0.02 0.03 EUR/INR(NseOct) 72.85 72.90 (0.05) (0.07) GBP/INR(Spot) 81.74 81.82 (0.08) (0.10) GBP/INR(NseOct) 81.82 81.90 (0.08) (0.10) JPY/INR(NseOct) 63.96 64.33 (0.37) (0.58) MarketHighlights
  • 2.
    Technical View: On dailychart JPYINR prices have been trading in sym- metrical triangle pattern and shown breakdown of its symmetrical triangle pattern. However, price has formed bearish candle stick on daily chart. Moreover, price has shown breakdown of its rising trend line at 65 levels. On the other hand price has shown breakdown of its rising trend line at 65.60 levels on daily chart. Furthermore, prices have been trading below its 21 DE- MA, which suggest short term trend is negative. On daily chart momentum indicator RSI is trading below at 45 levels which suggest further weakness in the pric- es. So for trading perspective, one could use sell in the range of 64.10 with SL of 64.45 for target of 63.40 levels. Pivot levels for the Day Technical View: The pair has been trading in falling wedge pattern from past few months and prices have been facing resistance of its upper band at 67 levels. On daily USDINR prices have been trading in falling channel formation from past few weeks and prices have been facing resistance at up- per band of channel pattern at 67.05 levels. On the other hand, prices have been facing resistance of horizontal trend line at 66.95 levels on daily chart. Moreover, prices have been trading below 50 DEMA which gives the sign of bearishness in the prices. A momentum indictor RSI has traded below 60 levels, which suggest further weakness in the prices. In addition, momentum indicator MACD has shown neg- ative crossover on daily chart. So for trading perspective, one could sell in range 66.95 with SL of 67.25 for target of 66.30. Currency Highlights 26th Oct’2016 USDINR JPYINR SEBI Certified – Research Analyst Equities I Commodities I Currencies I Mutual Funds S3 S2 S1 Pivot R1 R2 R3 USDINR 66.67 66.77 66.81 66.87 66.91 66.97 67.07 JPYINR 63.59 63.80 63.88 64.01 64.09 64.22 64.43
  • 3.
    Pivot levels forthe Day Currency Highlights 26th Oct’2016 GBPINR EURINR Technical View: The EURINR pair has shown breakdown of its descend- ing triangle pattern at 74 levels on daily chart. On the other hand price has shown breakdown of its symmet- rical triangle pattern at 74.80 levels on daily chart. Moreover, prices have been trading below its 21 DE- MA, which suggest short term trend is down. The pair has shown breakdown of its horizontal trend line at 74.70 levels on daily chart. On daily chart momentum oscillator RSI have been trad- ing below 60 which suggest bearishness in the prices. A momentum indicator MACD has shown negative crossover on daily chart, which add more bearishness in the prices. For now we can expect prices should move lower to- wards 72.10 levels in the coming trading session. Technical View: On daily GBPINR prices have been taking support of its falling trend line at 81.20 levels. Moreover, prices have been trading below 21 HEMA, which suggest short term trend looks positive. The price has formed bullish hammer candle stick pattern on daily chart, which is bullish pattern. A momentum indicator MADC has given positive Cross over on hourly chart, which gives the sign of bullishness in the prices. The momentum indictor RSI has been trading in over- sold zone levels on daily chart, which suggest the possi- bilities of bounce back in the in the prices. For now we expect prices should move higher towards 82.60 levels coming trading sessions. SEBI Certified – Research Analyst Equities I Commodities I Currencies I Mutual Funds S3 S2 S1 Pivot R1 R2 R3 GBPINR 81.49 81.65 81.74 81.81 81.90 81.97 82.13 EURINR 72.58 72.69 72.72 72.80 72.83 72.91 73.02
  • 4.
    Currency Highlights SEBI Certified– Research Analyst Equities I Commodities I Currencies I Mutual Funds 26th Oct’2016 Economic Indicators Date Time Data Prior Expected Impact 26.10.16 11:30 AM GfK German Consumer Cli- mate 10 10.1 Actual > Forecast = Good for currency; EURINR 26.10.16 12:30 PM German Import Prices m/m -0.2% 0.1% Actual > Forecast = Good for currency; EURINR 26.10.16 1:30 PM Italian Retail Sales m/m -0.3% 0.2% Actual > Forecast = Good for currency; EURINR 26.10.16 6:00 PM Goods Trade Balance -59.2B -60.60B Actual > Forecast = Good for currency; USDINR 26.10.16 7:15 PM Flash Services PMI 52.3 52.4 Actual > Forecast = Good for currency; USDINR 26.10.16 7:30 PM New Home Sales 609K 601K Actual > Forecast = Good for currency; USDINR 26.10.16 8:0 PM Crude Oil Inventories -5.2M 0.7M
  • 5.
    Currency Highlights 26th Oct’2016 SEBI Certified– Research Analyst Equities I Commodities I Currencies I Mutual Funds Amit Pathania Digitally signed by Amit Pathania DN: cn=Amit Pathania, o=Choice Equity Broking Pvt. ltd, ou=Research Department, email=amit.pathania@choiceindia.com, c=IN Date: 2016.10.26 09:07:04 +05'30'