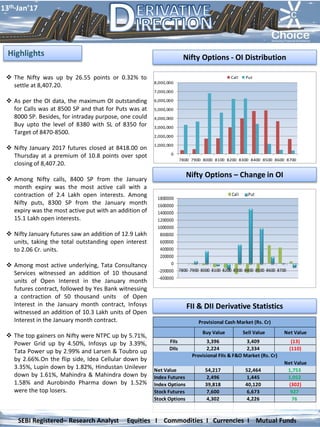
1. Nifty Options - OI Distribution
The Nifty was up by 26.55 points or 0.32% to
settle at 8,407.20.
As per the OI data, the maximum OI outstanding
for Calls was at 8500 SP and that for Puts was at
8000 SP. Besides, for intraday purpose, one could
Buy upto the level of 8380 with SL of 8350 for
Target of 8470-8500.
Nifty January 2017 futures closed at 8418.00 on
Thursday at a premium of 10.8 points over spot
closing of 8,407.20.
Among Nifty calls, 8400 SP from the January
month expiry was the most active call with a
contraction of 2.4 Lakh open interests. Among
Nifty puts, 8300 SP from the January month
expiry was the most active put with an addition of
15.1 Lakh open interests.
Nifty January futures saw an addition of 12.9 Lakh
units, taking the total outstanding open interest
to 2.06 Cr. units.
Among most active underlying, Tata Consultancy
Services witnessed an addition of 10 thousand
units of Open Interest in the January month
futures contract, followed by Yes Bank witnessing
a contraction of 50 thousand units of Open
Interest in the January month contract, Infosys
witnessed an addition of 10.3 Lakh units of Open
Interest in the January month contract.
The top gainers on Nifty were NTPC up by 5.71%,
Power Grid up by 4.50%, Infosys up by 3.39%,
Tata Power up by 2.99% and Larsen & Toubro up
by 2.66%.On the flip side, Idea Cellular down by
3.35%, Lupin down by 1.82%, Hindustan Unilever
down by 1.61%, Mahindra & Mahindra down by
1.58% and Aurobindo Pharma down by 1.52%
were the top losers.
Nifty Options – Change in OI
Highlights
FII & DII Derivative Statistics
13th Jan’17
SEBI Registered– Research Analyst Equities I Commodities I Currencies I Mutual Funds
0
1,000,000
2,000,000
3,000,000
4,000,000
5,000,000
6,000,000
7,000,000
8,000,000
7800 7900 8000 8100 8200 8300 8400 8500 8600 8700
Call Put
Buy Value Sell Value Net Value
FIIs 3,396 3,409 (13)
DIIs 2,224 2,334 (110)
Net Value
Net Value 54,217 52,464 1,753
Index Futures 2,496 1,445 1,052
Index Options 39,818 40,120 (302)
Stock Futures 7,600 6,673 927
Stock Options 4,302 4,226 76
Provisional FIIs & F&O Market (Rs. Cr)
Provisional Cash Market (Rs. Cr)
-400000
-200000
0
200000
400000
600000
800000
1000000
1200000
1400000
1600000
1800000
7800 7900 8000 8100 8200 8300 8400 8500 8600 8700
Call Put
2. Derivative Strategy Pay- Off Chart
The India Volatility Index decreased by 1.32% and
reached 14.61.
The Nifty Put Call Ratio (PCR) finally stood at 1.40 for
January month contract .
The top five scrips with highest PCR on OI were
Marico (2.83), Pidilite Industries (2.54), Dabur India
(2.34), Maruti Suzuki India (1.88) and TVS Motor
(1.80).
India VIX v/s Nifty Chart
13th Jan’17
SEBI Registered– Research Analyst Equities I Commodities I Currencies I Mutual Funds
Short Covering
Symbol Close Price Chng % OI Chng % Buy Above
PNB 124.85 1.34 -7.06 126.09
PETRONET 371.95 1.21 -5.91 375.20
ICICIBANK 268.40 1.15 -5.33 269.87
BHARATFIN 664.2 0.81 -5.31 672.37
Short Built Up
Symbol Close Price Chng % OI Chng % Sell Below
DRREDDY 3016.45 -1.24 7.53 2987.69
LICHSGFIN 527.65 -1.38 5.64 522.65
EICHERMOT 22910.00 -1.53 4.96 22703.32
BHARATFORG 954.80 -0.22 4.62 947.85
Long Liquidation
Symbol Close Price Chng % OI Chng % Sell Below
CENTURYTEX 820.40 -2.78 -7.58 810.87
OIL 345.55 -23.79 -7.30 342.13
SRF 1636.30 -1.22 -5.69 1618.17
JINDALSTEL 80.80 -1.76 -5.21 79.41
Long Built Up
Symbol Close Price Chng % OI Chng % Buy Above
NHPC 28.35 5.98 19.18 29.15
NTPC 174.25 5.80 14.40 178.09
TATACOMM 674.90 5.97 13.39 691.63
BIOCON 1008.65 0.31 11.53 1026.74
3. Contact Us
Kkunal Parar
Sr. Research Associate
kkunal.parar@choiceindia.com
Vikas Chaudhari
Research Associate
vikas.chaudhari@choiceindia.com
www.choiceindia.comcustomercare@choiceindia.com
Disclaimer
This is solely for information of clients of Choice Broking and does not construe to be an investment advice. It is also not intended as an offer or solicitation for the purchase and sale of any financial
instruments. Any action taken by you on the basis of the information contained herein is your responsibility alone and Choice Broking its subsidiaries or its employees or associates will not be liable in
any manner for the consequences of such action taken by you. We have exercised due diligence in checking the correctness and authenticity of the information contained in this recommendation, but
Choice Broking or any of its subsidiaries or associates or employees shall not be in any way responsible for any loss or damage that may arise to any person from any inadvertent error in the
information contained in this recommendation or any action taken on basis of this information. Technical analysis studies market psychology, price patterns and volume levels. It is used to forecast
future price and market movements. Technical analysis is complementary to fundamental analysis and news sources. The recommendations issued herewith might be contrary to recommendations
issued by Choice Broking in the company research undertaken as the recommendations stated in this report is derived purely from technical analysis. Choice Broking has based this document on
information obtained from sources it believes to be reliable but which it has not independently verified; Choice Broking makes no guarantee, representation or warranty and accepts no responsibility
or liability as to its accuracy or completeness. The opinions contained within the report are based upon publicly available information at the time of publication and are subject to change without
notice. The information and any disclosures provided herein are in summary form and have been prepared for informational purposes. The recommendations and suggested price levels are intended
purely for trading purposes. The recommendations are valid for the day of the report however trading trends and volumes might vary substantially on an intraday basis and the recommendations may
be subject to change. The information and any disclosures provided herein may be considered confidential. Any use, distribution, modification, copying, forwarding or disclosure by any person is
strictly prohibited. The information and any disclosures provided herein do not constitute a solicitation or offer to purchase or sell any security or other financial product or instrument. The current
performance may be unaudited. Past performance does not guarantee future returns. There can be no assurance that investments will achieve any targeted rates of return, and there is no guarantee
against the loss of your entire investment.
POTENTIAL CONFLICT OF INTEREST DISCLOSURE (as on date of report) Disclosure of interest statement – • Analyst interest of the stock /Instrument(s): - No. • Firm interest of the stock /
Instrument (s): - No.
Kapil Shah
Research Associate
kapil.shah@choiceindia.com
Amit Pathania
Research Associate
amit.pathania@choiceindia.com
13th Jan’17
SEBI Registered– Research Analyst Equities I Commodities I Currencies I Mutual Funds
Kkunal Parar
Digitally signed by Kkunal Parar
DN: cn=Kkunal Parar, o=Choice Equity
Broking Pvt Ltd., ou=Research Dept.,
email=kkunal.parar@choiceindia.com, c=IN
Date: 2017.01.13 08:54:16 +05'30'