
Recommended
More Related Content
What's hot
What's hot (20)
Viewers also liked
Viewers also liked (20)
Similar to Aaj ka trend 05.12.16
Similar to Aaj ka trend 05.12.16 (20)
Recently uploaded
Recently uploaded (20)
Aaj ka trend 05.12.16
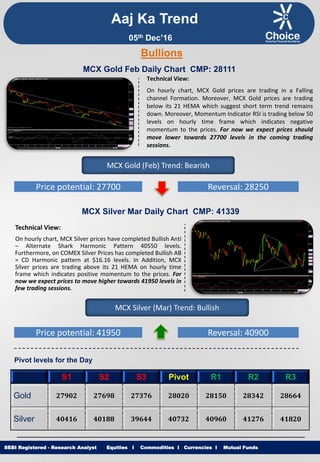
- 1. Equities I Commodities I Currencies I Mutual Funds Aaj Ka Trend Technical View: On hourly chart, MCX Gold prices are trading in a Falling channel Formation. Moreover, MCX Gold prices are trading below its 21 HEMA which suggest short term trend remains down. Moreover, Momentum Indicator RSI is trading below 50 levels on hourly time frame which indicates negative momentum to the prices. For now we expect prices should move lower towards 27700 levels in the coming trading sessions. SEBI Registered - Research Analyst Equities I Commodities I Currencies I Mutual Funds Bullions MCX Gold Feb Daily Chart CMP: 28111 MCX Gold (Feb) Trend: Bearish Price potential: 27700 Reversal: 28250 MCX Silver Mar Daily Chart CMP: 41339 Technical View: On hourly chart, MCX Silver prices have completed Bullish Anti – Alternate Shark Harmonic Pattern 40550 levels. Furthermore, on COMEX Silver Prices has completed Bullish AB = CD Harmonic pattern at $16.16 levels. In Addition, MCX Silver prices are trading above its 21 HEMA on hourly time frame which indicates positive momentum to the prices. For now we expect prices to move higher towards 41950 levels in few trading sessions. MCX Silver (Mar) Trend: Bullish Price potential: 41950 Reversal: 40900 Pivot levels for the Day S1 S2 S3 Pivot R1 R2 R3 Gold 27902 27698 27376 28020 28150 28342 28664 Silver 40416 40188 39644 40732 40960 41276 41820 05th Dec’16
- 2. Equities I Commodities I Currencies I Mutual Funds Technical View: On hourly chart, MCX Copper price are trading in rising channel formation and is trading above its Up ward slanting trend line support. Moreover, COMEX Copper prices has witnessed breakout of its Falling Wedge pattern at $2.63 levels on hourly chart. In addition MCX Copper prices are trading above its 21 HEMA. Furthermore, momentum indicator RSI is trading above 50 levels on hourly time frame. For now we expect prices to move higher towards 405 levels in coming trading sessions. SEBI Registered - Research Analyst Equities I Commodities I Currencies I Mutual Funds MCX Copper Feb Daily Chart CMP: 396.70 MCX Copper (Feb) Trend: Bullish Price potential: 405 Reversal: 390 MCX Crude Oil Dec. Daily Chart CMP: 3500 Technical View: MCX Crude Oil prices have witnessed breakout of its Ascending Triangle pattern at 3505 in hourly time frame and is trading above its trend line support. MCX Crude Oil is trading above its 50 HEMA on hourly chart. Moreover, Momentum indicator RSI is trading above 60 levels on hourly chart which suggest the positive movement in the prices. For now we expect prices to move higher 3590 towards levels in coming trading sessions. MCX Crude Oil (Dec) Trend: Bullish Price potential: 3590 Reversal: 3450 Pivot levels for the Day S1 S2 S3 Pivot R1 R2 R3 Copper 395.9 392.3 384.4 400.2 403.8 408.1 416.0 Crude 3411 3296 3115 3477 3592 3658 3839 Base Metal Energy Aaj Ka Trend 05th Dec’16
- 3. Equities I Commodities I Currencies I Mutual FundsSEBI Registered - Research Analyst Equities I Commodities I Currencies I Mutual Funds Other Base Metals & Energy S1 S2 S3 Pivot R1 R2 R3 Trend Copper 395.9 392.3 384.4 400.2 403.8 408.1 416.0 Aluminum 116.6 115.8 113.7 117.9 118.7 120.0 122.1 Lead 156.9 153.9 147.6 160.2 163.2 166.5 172.8 Nickel 758.8 753.0 738.9 767.1 772.9 781.2 795.3 Zinc 185.6 182.9 178.4 187.3 190.1 191.8 196.2 Natural Gas 231.3 222.8 209.5 236.1 244.6 249.4 262.7 Fundamental News: Gold prices fell in Asia on Friday ahead of U.S. jobs data that is seen as icing on the cake for a Fed rate hike this month. Gold prices bounced off a 10-month low on Friday, as the U.S. dollar remained slightly weaker ahead of a key U.S. employment report due to be released later in the day. U.S. oil turned lower on Friday, amid profit-taking and doubts over the potential success of the recent oil production deal although the commodity continued to hover at the $50 a barrel threshold, signaling sustained optimism. Oil prices fell 1.5 percent to steady at around $53 a barrel on Friday after the biggest weekly rally since 2009 following OPEC's decision this week to cut crude output in order to rein in a global glut. Iran threatened on Friday to retaliate against the U.S. Senate's vote to extend the Iran Sanctions Act (ISA) for 10 years, saying it violated last year's deal with six major powers that curbed its nuclear program. The surge in oil futures after OPEC agreed to cut output for the first time since 2008 ran out of steam Friday as the market paused for thought. Facing brutal urban warfare in Mosul and with their push slowed by the presence of one million residents, Iraqi commanders examined changing strategy last week to help civilians leave to give the army a free hand to strike Islamic State fighters. The dollar held steady against the other majors currencies on Friday, after the release of mixed U.S. employment data, although overall optimism over the strength of the economy continued to support the greenback near multi-year highs. Aaj Ka Trend 05th Dec’16
- 4. Equities I Commodities I Currencies I Mutual FundsSEBI Registered - Research Analyst Equities I Commodities I Currencies I Mutual Funds International Market Commodity Closing Price Gold 1179 Silver 16.79 Crude Oil 51.69 Brent Crude Oil 54.43 Natural Gas 3.454 COMEX/NYMEX/ICE ( Precious Metals & Energy) Currency & Commodity Index Currency (Spot) Current Price USD / INR 68.02 Dollar Index 100.75 EUR / USD 1.066 CRB Index* 191.69 Closing as on 02.12.16 *Closing as on 02.12.16 LME (Base Metals) ( $ per tones) Commodity Closing Price Copper 5758 Aluminum 1712 Zinc 2642 Lead 2258 Nickel 11316 SHFE (Base Metals) (Yuan per tones) Commodity Closing Price Copper 46750 Aluminum 13380 Zinc 22365 Lead 20580 Closing as on 02.12.16 Closing as on 02.12.16 LME INVENTORY DATA Aaj Ka Trend 28-Nov-16 29-Nov-16 30-Nov-16 01-Dec-16 02-Dec-16 Aluminium 26524 -3226 -5901 -4301 -5574 Copper -2951 1224 -648 1848 -2650 Lead 0 0 -101 -101 -498 Nickel -715 44 -218 175 -182 Zinc -224 -175 -249 -402 -502 05th Dec’16
- 5. Equities I Commodities I Currencies I Mutual Funds This is solely for information of clients of Choice Broking and does not construe to be an investment advice. It is also not intended as an offer or solicitation for the purchase and sale of any financial instruments. Any action taken by you on the basis of the information contained herein is your responsibility alone and Choice Broking its subsidiaries or its employees or associates will not be liable in any manner for the consequences of such action taken by you. We have exercised due diligence in checking the correctness and authenticity of the information contained in this recommendation, but Choice Broking or any of its subsidiaries or associates or employees shall not be in any way responsible for any loss or damage that may arise to any person from any inadvertent error in the information contained in this recommendation or any action taken on basis of this information. Technical analysis studies market psychology, price patterns and volume levels. It is used to forecast future price and market movements. Technical analysis is complementary to fundamental analysis and news sources. The recommendations issued herewith might be contrary to recommendations issued by Choice Broking in the company research undertaken as the recommendations stated in this report is derived purely from technical analysis. Choice Broking has based this document on information obtained from sources it believes to be reliable but which it has not independently verified; Choice Broking makes no guarantee, representation or warranty and accepts no responsibility or liability as to its accuracy or completeness. The opinions contained within the report are based upon publicly available information at the time of publication and are subject to change without notice. The information and any disclosures provided herein are in summary form and have been prepared for informational purposes. The recommendations and suggested price levels are intended purely for trading purposes. The recommendations are valid for the day of the report however trading trends and volumes might vary substantially on an intraday basis and the recommendations may be subject to change. The information and any disclosures provided herein may be considered confidential. Any use, distribution, modification, copying, forwarding or disclosure by any person is strictly prohibited. The information and any disclosures provided herein do not constitute a solicitation or offer to purchase or sell any security or other financial product or instrument. The current performance may be unaudited. Past performance does not guarantee future returns. There can be no assurance that investments will achieve any targeted rates of return, and there is no guarantee against the loss of your entire investment. POTENTIAL CONFLICT OF INTEREST DISCLOSURE (as on date of report) Disclosure of interest statement – • Analyst interest of the stock /Instrument(s): - No. • Firm interest of the stock / Instrument (s): - No. Disclaimer Contact Us Amit Pathania Research Associate amit.pathania@choiceindia.com Rohan Patil Research Associate rohan.patil@choiceindia.com www.choicebroking.incustomercare@choiceindia.com SEBI Registered - Research Analyst Equities I Commodities I Currencies I Mutual Funds Aaj Ka Trend 05th Dec’16 Neeraj Yadav Research Advisor neeraj.yadav@choiceindia.com Anish Vyas Senior Research Associate anish.vyas@choiceindia.com Amit Pathania Digitally signed by Amit Pathania DN: cn=Amit Pathania, o=Choice Equity Broking Pvt. ltd, ou=Research Department, email=amit.pathania@choiceindia.com, c=IN Date: 2016.12.03 15:53:15 +05'30'