

Recommended
More Related Content
What's hot
What's hot (20)
Viewers also liked
Viewers also liked (9)
Similar to Aaj ka trend 19.12.16
Similar to Aaj ka trend 19.12.16 (20)
Recently uploaded
Recently uploaded (20)
Aaj ka trend 19.12.16
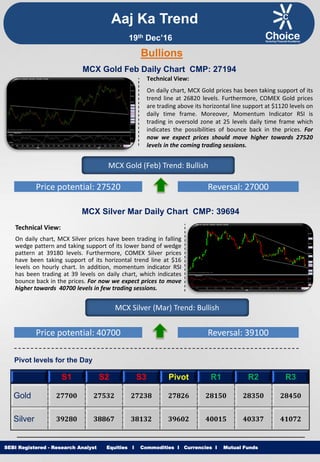
- 1. Equities I Commodities I Currencies I Mutual Funds Aaj Ka Trend Technical View: On daily chart, MCX Gold prices has been taking support of its trend line at 26820 levels. Furthermore, COMEX Gold prices are trading above its horizontal line support at $1120 levels on daily time frame. Moreover, Momentum Indicator RSI is trading in oversold zone at 25 levels daily time frame which indicates the possibilities of bounce back in the prices. For now we expect prices should move higher towards 27520 levels in the coming trading sessions. SEBI Registered - Research Analyst Equities I Commodities I Currencies I Mutual Funds Bullions MCX Gold Feb Daily Chart CMP: 27194 MCX Gold (Feb) Trend: Bullish Price potential: 27520 Reversal: 27000 MCX Silver Mar Daily Chart CMP: 39694 Technical View: On daily chart, MCX Silver prices have been trading in falling wedge pattern and taking support of its lower band of wedge pattern at 39180 levels. Furthermore, COMEX Silver prices have been taking support of its horizontal trend line at $16 levels on hourly chart. In addition, momentum indicator RSI has been trading at 39 levels on daily chart, which indicates bounce back in the prices. For now we expect prices to move higher towards 40700 levels in few trading sessions. MCX Silver (Mar) Trend: Bullish Price potential: 40700 Reversal: 39100 Pivot levels for the Day S1 S2 S3 Pivot R1 R2 R3 Gold 27700 27532 27238 27826 28150 28350 28450 Silver 39280 38867 38132 39602 40015 40337 41072 19th Dec’16
- 2. Equities I Commodities I Currencies I Mutual Funds Technical View: On hourly chart, MCX Copper price has shown breakdown of its channel pattern at 392 levels. Moreover, COMEX Copper price has witnessed breakdown of its ascending triangle pattern $2.62 levels on daily chart. In addition MCX Copper prices are trading below its 21 DEMA. Furthermore, momentum indicator MACD has shown negative crossover on daily time frame, which suggest further weakness in the momentum can be seen. For now we expect prices to move lower towards 375 levels in coming trading sessions. SEBI Registered - Research Analyst Equities I Commodities I Currencies I Mutual Funds MCX Copper Feb Hourly Chart CMP: 385.80 MCX Copper (Feb) Trend: Bearish Price potential: 375 Reversal: 392 MCX Crude Oil Dec. Daily Chart CMP: 3521 Technical View: MCX Crude Oil price have been taking support of its rising trend lien at3422 levels on hourly chart. MCX Crude Oil price has been taking support of its horizontal trend line at 3356 levels on hourly chart. MCX Crude Oil is trading above its 50 DEMA on daily chart. Moreover, Momentum indicator RSI is trading above 60 levels on daily chart which suggest the positive movement in the prices. For now we expect prices to move higher towards 3600 levels in coming trading sessions. MCX Crude Oil (Dec) Trend: Bullish Price potential: 3600 Reversal: 3480 Pivot levels for the Day S1 S2 S3 Pivot R1 R2 R3 Copper 382.1 379.0 370.9 387.1 390.2 395.2 403.3 Crude 3449 3387 3286 3488 3550 3589 3690 Base Metal Energy Aaj Ka Trend 19th Dec’16
- 3. Equities I Commodities I Currencies I Mutual FundsSEBI Registered - Research Analyst Equities I Commodities I Currencies I Mutual Funds Other Base Metals & Energy S1 S2 S3 Pivot R1 R2 R3 Trend Copper 382.1 379.0 370.9 387.1 390.2 395.2 403.3 Aluminum 116.3 115.5 113.5 117.5 118.3 119.5 121.5 Lead 149.7 147.4 141.2 153.7 156.0 159.9 166.2 Nickel 750.9 743.6 725.2 762.0 769.3 780.4 798.8 Zinc 181.7 178.9 171.9 185.8 188.6 192.8 199.7 Natural Gas 226.9 224.0 218.0 230.0 232.9 236.0 242.0 Fundamental News: Inflationary policies, by the governments of China and the U.S., will encourage speculation, resulting in increased cash flow into electronic traded funds (ETFs) related to gold, according to analysts. President-elect Donald Trump’s plans to cut taxes is expected to add trillions of dollars to the country's debt burden. The U.S. federal debt is still expected to increase from 77% of U.S. GDP at year-end 2016 to 86%, or about $23 trillion, over the next decade, driven by spending on health care for seniors and children and the indigent and retirement. This year’s decline of the Chinese and Indian jewelry markets was caused by complex confluence of events that will not repeat themselves in 2017, including the unexpected loss of Chinese consumer confidence, gold import curbs designed to restrict capital flight, a tax hike on Indian gold imports earlier this year, and a cash crisis in India. Oil traders emboldened the fact that that some foreign oil producers are adhering to their promise to pull back on output. President Obama mentioned Russian oil production briefly during his final White House press conference this afternoon, saying that the country had "no innovation" and nothing that anyone wanted to buy except "oil and some weapons." But it may have been too late in the trading day to impact prices and opinions on Friday. Prices had trended lower earlier in the day, amid news that Libya has restarted operations at two key oil fields. Aaj Ka Trend 19th Dec’16
- 4. Equities I Commodities I Currencies I Mutual FundsSEBI Registered - Research Analyst Equities I Commodities I Currencies I Mutual Funds International Market Commodity Closing Price Gold 1136 Silver 16.15 Crude Oil 52.03 Brent Crude Oil 55.32 Natural Gas 3.38 COMEX/NYMEX/ICE ( Precious Metals & Energy) Currency & Commodity Index Currency (Spot) Current Price USD / INR 67.85 Dollar Index 102.81 EUR / USD 1.04 CRB Index* 191.42 Closing as on 16.12.16 *Closing as on 16.12.16 LME (Base Metals) ( $ per tones) Commodity Closing Price Copper 5628 Aluminum 1723 Zinc 2685 Lead 2150 Nickel 11109 SHFE (Base Metals) (Yuan per tones) Commodity Closing Price Copper 46350 Aluminum 13150 Zinc 22125 Lead 20220 Closing as on 16.12.16 Closing as on 16.12.16 LME INVENTORY DATA Aaj Ka Trend 12-Dec-16 13-Dec-16 14-Dec-16 15-Dec-16 16-Dec-16 Aluminium -5750 -22151 -22201 -2751 -28074 Copper -7800 126624 19949 17174 11776 Lead 0 0 -51 -101 -49 Nickel -78 -73 1141 1669 -121 Zinc -675 -1249 -902 41 -1826 19th Dec’16
- 5. Equities I Commodities I Currencies I Mutual Funds This is solely for information of clients of Choice Broking and does not construe to be an investment advice. It is also not intended as an offer or solicitation for the purchase and sale of any financial instruments. Any action taken by you on the basis of the information contained herein is your responsibility alone and Choice Broking its subsidiaries or its employees or associates will not be liable in any manner for the consequences of such action taken by you. We have exercised due diligence in checking the correctness and authenticity of the information contained in this recommendation, but Choice Broking or any of its subsidiaries or associates or employees shall not be in any way responsible for any loss or damage that may arise to any person from any inadvertent error in the information contained in this recommendation or any action taken on basis of this information. Technical analysis studies market psychology, price patterns and volume levels. It is used to forecast future price and market movements. Technical analysis is complementary to fundamental analysis and news sources. The recommendations issued herewith might be contrary to recommendations issued by Choice Broking in the company research undertaken as the recommendations stated in this report is derived purely from technical analysis. Choice Broking has based this document on information obtained from sources it believes to be reliable but which it has not independently verified; Choice Broking makes no guarantee, representation or warranty and accepts no responsibility or liability as to its accuracy or completeness. The opinions contained within the report are based upon publicly available information at the time of publication and are subject to change without notice. The information and any disclosures provided herein are in summary form and have been prepared for informational purposes. The recommendations and suggested price levels are intended purely for trading purposes. The recommendations are valid for the day of the report however trading trends and volumes might vary substantially on an intraday basis and the recommendations may be subject to change. The information and any disclosures provided herein may be considered confidential. Any use, distribution, modification, copying, forwarding or disclosure by any person is strictly prohibited. The information and any disclosures provided herein do not constitute a solicitation or offer to purchase or sell any security or other financial product or instrument. The current performance may be unaudited. Past performance does not guarantee future returns. There can be no assurance that investments will achieve any targeted rates of return, and there is no guarantee against the loss of your entire investment. POTENTIAL CONFLICT OF INTEREST DISCLOSURE (as on date of report) Disclosure of interest statement – • Analyst interest of the stock /Instrument(s): - No. • Firm interest of the stock / Instrument (s): - No. Disclaimer Contact Us Amit Pathania Research Associate amit.pathania@choiceindia.com www.choicebroking.incustomercare@choiceindia.com SEBI Registered - Research Analyst Equities I Commodities I Currencies I Mutual Funds Aaj Ka Trend 19th Dec’16 Neeraj Yadav Research Advisor neeraj.yadav@choiceindia.com Anish Vyas Senior Research Associate anish.vyas@choiceindia.com Amit Pathania Digitally signed by Amit Pathania DN: cn=Amit Pathania, o=Choice Equity Broking Pvt. ltd, ou=Research Department, email=amit.pathania@choiceindia.com, c=IN Date: 2016.12.17 12:54:07 +05'30'