

Recommended
More Related Content
What's hot
What's hot (20)
Viewers also liked
Viewers also liked (14)
Similar to Aaj ka trend 15.12.16
Similar to Aaj ka trend 15.12.16 (18)
Recently uploaded
Recently uploaded (20)
Aaj ka trend 15.12.16
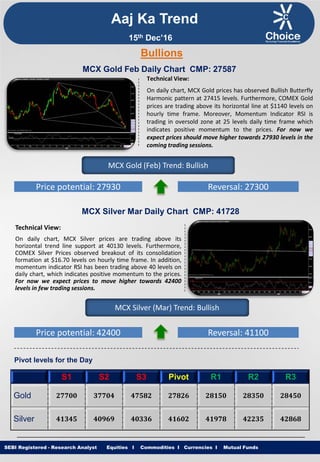
- 1. Equities I Commodities I Currencies I Mutual Funds Aaj Ka Trend Technical View: On daily chart, MCX Gold prices has observed Bullish Butterfly Harmonic pattern at 27415 levels. Furthermore, COMEX Gold prices are trading above its horizontal line at $1140 levels on hourly time frame. Moreover, Momentum Indicator RSI is trading in oversold zone at 25 levels daily time frame which indicates positive momentum to the prices. For now we expect prices should move higher towards 27930 levels in the coming trading sessions. SEBI Registered - Research Analyst Equities I Commodities I Currencies I Mutual Funds Bullions MCX Gold Feb Daily Chart CMP: 27587 MCX Gold (Feb) Trend: Bullish Price potential: 27930 Reversal: 27300 MCX Silver Mar Daily Chart CMP: 41728 Technical View: On daily chart, MCX Silver prices are trading above its horizontal trend line support at 40130 levels. Furthermore, COMEX Silver Prices observed breakout of its consolidation formation at $16.70 levels on hourly time frame. In addition, momentum indicator RSI has been trading above 40 levels on daily chart, which indicates positive momentum to the prices. For now we expect prices to move higher towards 42400 levels in few trading sessions. MCX Silver (Mar) Trend: Bullish Price potential: 42400 Reversal: 41100 Pivot levels for the Day S1 S2 S3 Pivot R1 R2 R3 Gold 27700 37704 47582 27826 28150 28350 28450 Silver 41345 40969 40336 41602 41978 42235 42868 15th Dec’16
- 2. Equities I Commodities I Currencies I Mutual Funds Technical View: On daily chart, MCX Copper price has shown breakdown of its symmetrical triangle pattern at 389.90 levels. Moreover, COMEX Copper price has witnessed breakdown of its ascending triangle pattern $2.62 levels on daily chart. In addition MCX Copper prices are trading below its 21 DEMA. Furthermore, momentum indicator RSI is trading below 60 levels on daily time frame. For now we expect prices to move lower towards 379 levels in coming trading sessions. SEBI Registered - Research Analyst Equities I Commodities I Currencies I Mutual Funds MCX Copper Feb Daily Chart CMP: 389.60 MCX Copper (Feb) Trend: Bearish Price potential: 379 Reversal: 394 MCX Crude Oil Dec. Daily Chart CMP: 3497 Technical View: MCX Crude Oil price has witnessed breakout of its ascending triangle pattern at 3500 in daily time frame. MCX Crude Oil is trading above its 50 DEMA on daily chart. In addition, NYMEX WTI Crude Oil price has shown breakout of its symmetrical triangle pattern at 52 levels on daily chart. Moreover, Momentum indicator RSI is trading above 60 levels on daily chart which suggest the positive movement in the prices. For now we expect prices to move higher 3650 towards levels in coming trading sessions. MCX Crude Oil (Dec) Trend: Bullish Price potential: 3650 Reversal: 3480 Pivot levels for the Day S1 S2 S3 Pivot R1 R2 R3 Copper 384.9 381.2 374.2 388.2 391.9 395.2 402.2 Crude 3503 3469 3399 3539 3573 3609 3679 Base Metal Energy Aaj Ka Trend 15th Dec’16
- 3. Equities I Commodities I Currencies I Mutual FundsSEBI Registered - Research Analyst Equities I Commodities I Currencies I Mutual Funds Other Base Metals & Energy S1 S2 S3 Pivot R1 R2 R3 Trend Copper 384.9 381.2 374.2 388.2 391.9 395.2 402.2 Aluminum 116.9 116.4 115.4 117.5 118.0 118.5 119.6 Lead 156.1 155.1 152.6 157.6 158.6 160.1 162.6 Nickel 763.6 756.1 742.1 770.1 777.6 784.1 798.1 Zinc 182.7 180.8 177.3 184.2 186.1 187.7 191.1 Natural Gas 234.5 230.6 224.7 236.5 240.4 242.4 248.3 Fundamental News: Gold prices rose on Wednesday with the dollar little changed as investors awaited the outcome of the Federal Reserve’s latest policy meeting later in the day. Investors will be focusing on the details of the central banks latest economic forecasts, the first since the U.S presidential election, for indications on the expected pace of rate hikes going forward. Both a strong dollar and higher interest rates are typically bearish for gold, which is denominated in dollars and struggles to compete with yield-bearing assets when borrowing costs rise. Wall Street futures pointed to a flat open on Wednesday, with markets expected to look past economic data as they await the Federal Reserve’s (Fed) decision on monetary policy. In a report, the U.S. Commerce Department said that retail sales rose 0.1% in November from the prior month, compared to expectations for a 0.3% increase. October retail sales increased 0.6%, whose figure was revised from an initial 0.8% rise. Oil prices pared back losses on Wednesday after the U.S. Energy Information Administration reported an unexpectedly large oil inventory drawdown last week. Stockpiles of gasoline and distillates also surprised to the downside, with gasoline stockpiles increasing by just 0.49 million barrels and distillates falling by 0.76 million barrels. Prices had fallen earlier in the day after the Organization of the Petroleum Exporting Countries said that a global supply overhang will grow next year unless major producers follow through on a weekend agreement to rein in output. Aaj Ka Trend 15th Dec’16
- 4. Equities I Commodities I Currencies I Mutual FundsSEBI Registered - Research Analyst Equities I Commodities I Currencies I Mutual Funds International Market Commodity Closing Price Gold 1143.46 Silver 16.78 Crude Oil 50.87 Brent Crude Oil 53.83 Natural Gas 3.577 COMEX/NYMEX/ICE ( Precious Metals & Energy) Currency & Commodity Index Currency (Spot) Current Price USD / INR 67.4450 Dollar Index 102.19 EUR / USD 1.0515 CRB Index* 191.78 Closing as on 14.12.16 *Closing as on 14.12.16 LME (Base Metals) ( $ per tones) Commodity Closing Price Copper 5722 Aluminum 1746 Zinc 2810 Lead 2316 Nickel 11420 SHFE (Base Metals) (Yuan per tones) Commodity Closing Price Copper 46920 Aluminum 12905 Zinc 22950 Lead 21090 Closing as on 14.12.16 Closing as on 14.12.16 LME INVENTORY DATA Aaj Ka Trend 07-Dec-16 08-Dec-16 12-Dec-16 13-Dec-16 14-Dec-16 Aluminium 0 -4950 -5750 -22151 -22201 Copper 0 -3575 -7800 126624 19949 Lead 0 -400 0 0 -51 Nickel 0 -60 -78 -73 1141 Zinc 0 -450 -675 -1249 -902 15th Dec’16
- 5. Equities I Commodities I Currencies I Mutual Funds This is solely for information of clients of Choice Broking and does not construe to be an investment advice. It is also not intended as an offer or solicitation for the purchase and sale of any financial instruments. Any action taken by you on the basis of the information contained herein is your responsibility alone and Choice Broking its subsidiaries or its employees or associates will not be liable in any manner for the consequences of such action taken by you. We have exercised due diligence in checking the correctness and authenticity of the information contained in this recommendation, but Choice Broking or any of its subsidiaries or associates or employees shall not be in any way responsible for any loss or damage that may arise to any person from any inadvertent error in the information contained in this recommendation or any action taken on basis of this information. Technical analysis studies market psychology, price patterns and volume levels. It is used to forecast future price and market movements. Technical analysis is complementary to fundamental analysis and news sources. The recommendations issued herewith might be contrary to recommendations issued by Choice Broking in the company research undertaken as the recommendations stated in this report is derived purely from technical analysis. Choice Broking has based this document on information obtained from sources it believes to be reliable but which it has not independently verified; Choice Broking makes no guarantee, representation or warranty and accepts no responsibility or liability as to its accuracy or completeness. The opinions contained within the report are based upon publicly available information at the time of publication and are subject to change without notice. The information and any disclosures provided herein are in summary form and have been prepared for informational purposes. The recommendations and suggested price levels are intended purely for trading purposes. The recommendations are valid for the day of the report however trading trends and volumes might vary substantially on an intraday basis and the recommendations may be subject to change. The information and any disclosures provided herein may be considered confidential. Any use, distribution, modification, copying, forwarding or disclosure by any person is strictly prohibited. The information and any disclosures provided herein do not constitute a solicitation or offer to purchase or sell any security or other financial product or instrument. The current performance may be unaudited. Past performance does not guarantee future returns. There can be no assurance that investments will achieve any targeted rates of return, and there is no guarantee against the loss of your entire investment. POTENTIAL CONFLICT OF INTEREST DISCLOSURE (as on date of report) Disclosure of interest statement – • Analyst interest of the stock /Instrument(s): - No. • Firm interest of the stock / Instrument (s): - No. Disclaimer Contact Us Amit Pathania Research Associate amit.pathania@choiceindia.com www.choicebroking.incustomercare@choiceindia.com SEBI Registered - Research Analyst Equities I Commodities I Currencies I Mutual Funds Aaj Ka Trend 15th Dec’16 Neeraj Yadav Research Advisor neeraj.yadav@choiceindia.com Anish Vyas Senior Research Associate anish.vyas@choiceindia.com Anish Vyas Digitally signed by Anish Vyas DN: cn=Anish Vyas, o=Choice Merchandise Broking Pvt. Ltd, ou=Sr. Research Associate, email=anish.vyas@choiceindia.com, c=IN Date: 2016.12.15 08:43:40 +05'30'