
Recommended
More Related Content
What's hot
What's hot (20)
Similar to Aaj ka trend 13.07.16
Similar to Aaj ka trend 13.07.16 (20)
Recently uploaded
Recently uploaded (20)
Aaj ka trend 13.07.16
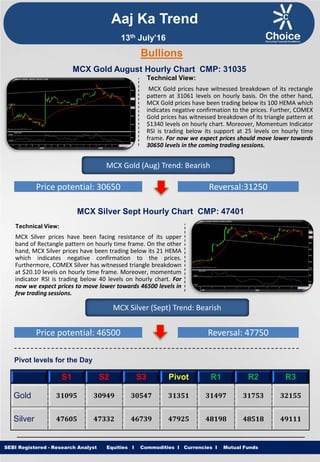
- 1. Equities I Commodities I Currencies I Mutual Funds Aaj Ka Trend Technical View: MCX Gold prices have witnessed breakdown of its rectangle pattern at 31061 levels on hourly basis. On the other hand, MCX Gold prices have been trading below its 100 HEMA which indicates negative confirmation to the prices. Further, COMEX Gold prices has witnessed breakdown of its triangle pattern at $1340 levels on hourly chart. Moreover, Momentum Indicator RSI is trading below its support at 25 levels on hourly time frame. For now we expect prices should move lower towards 30650 levels in the coming trading sessions. SEBI Registered - Research Analyst Equities I Commodities I Currencies I Mutual Funds Bullions MCX Gold August Hourly Chart CMP: 31035 MCX Gold (Aug) Trend: Bearish Price potential: 30650 Reversal:31250 MCX Silver Sept Hourly Chart CMP: 47401 Technical View: MCX Silver prices have been facing resistance of its upper band of Rectangle pattern on hourly time frame. On the other hand, MCX Silver prices have been trading below its 21 HEMA which indicates negative confirmation to the prices. Furthermore, COMEX Silver has witnessed triangle breakdown at $20.10 levels on hourly time frame. Moreover, momentum indicator RSI is trading below 40 levels on hourly chart. For now we expect prices to move lower towards 46500 levels in few trading sessions. MCX Silver (Sept) Trend: Bearish Price potential: 46500 Reversal: 47750 Pivot levels for the Day S1 S2 S3 Pivot R1 R2 R3 Gold 31095 30949 30547 31351 31497 31753 32155 Silver 47605 47332 46739 47925 48198 48518 49111 13th July’16
- 2. Equities I Commodities I Currencies I Mutual Funds Technical View: MCX Copper prices has witnessed breakout of its Falling channel Formation at 325.85 on hourly chart. On daily chart, the MCX Copper price has completed a “Bullish 5 - 0 Harmonic Pattern” at 320 levels. Furthermore, prices have been trading above its 50 HEMA on hourly chart. On the other hand, momentum indicator RSI is trading above 60 levels on hourly chart. For now we expect prices to move higher towards 337.50 levels in coming trading sessions. SEBI Registered - Research Analyst Equities I Commodities I Currencies I Mutual Funds MCX Copper Aug hourly Chart CMP: 330.15 MCX Copper (Aug) Trend: Bullish Price potential: 337.50 Reversal: 324.50 MCX Crude Oil July. Hourly Chart CMP: 3135 Technical View: MCX Crude Oil prices are facing resistance of its horizontal trend line on hourly time frame. NYMEX WTI Crude Oil prices is facing trend line resistance at $47 levels on 4 hours chart. On the other hand prices have been trading below its 100 HEMA on MCX Crude Oil hourly chart. Moreover, Momentum indicator RSI has shown Bearish range shift on daily chart. For now we expect prices to move lower towards 3045 levels in coming trading sessions. MCX Crude Oil (July) Trend: Bearish Price potential: 3045 Reversal: 3175 Pivot levels for the Day S1 S2 S3 Pivot R1 R2 R3 Copper 323.2 319.0 312.3 325.8 330.0 332.5 339.3 Crude 3043 2970 2861 3079 3152 3188 3297 Base Metal Energy Aaj Ka Trend 13th July’16
- 3. Equities I Commodities I Currencies I Mutual FundsSEBI Registered - Research Analyst Equities I Commodities I Currencies I Mutual Funds Other Base Metals & Energy S1 S2 S3 Pivot R1 R2 R3 Trend Copper 323.2 319.0 312.3 325.8 330.0 332.5 339.3 Aluminum 110.8 109.7 107.8 111.5 112.7 113.4 115.2 Lead 123.2 121.2 118.0 124.3 126.4 127.5 130.6 Nickel 684.1 670.1 647.8 692.4 706.4 714.7 737.0 Zinc 144.4 142.2 138.6 145.7 148.0 149.3 152.8 Natural Gas 180.6 178.5 174.2 182.8 184.9 187.1 191.4 Fundamental News: Gold prices struggled for direction in subdued European trade on Tuesday, as market players awaited comments from a barrage of Federal Reserve officials later in the session to judge the balance of opinion among policymakers on the prospect of further rate hikes. Both gold and silver have been buoyed by Britain’s decision to leave the European Union. Analysts believe we may be at the start of a new bull run. Gold prices were under heavy selling pressure in North American trade on Tuesday, as strong gains in global equity markets dampened demand for the yellow metal. Oil bounced off two-month lows Tuesday, with Brent recovering the $47 mark. Oil prices rallied sharply in North American trade on Tuesday, after the Organization of the Petroleum Exporting Countries forecast higher demand for its crude next year as the global surplus fades. OPEC cut its 2016 global growth forecast but upbeat on Crude Oil for 2017. OPEC cut its estimate for global growth to 3.0% from 3.1% in wake of Brexit. OPEC on Tuesday gave an upbeat outlook for the oil market in 2017, saying global demand for its crude would be higher than its current production and pointing to a supply deficit rather than a sizeable surplus that has weighed on prices. U.S. natural gas futures were lower for the second straight session on Tuesday, extending losses from the previous day as updated weather forecasting models pointed to mild temperatures across most parts of the U.S. in the weeks ahead. Aaj Ka Trend 13th July’16
- 4. Equities I Commodities I Currencies I Mutual FundsSEBI Registered - Research Analyst Equities I Commodities I Currencies I Mutual Funds International Market Commodity Closing Price Gold 1333.12 Silver 20.15 Crude Oil 46.33 Brent Crude Oil 47.94 Natural Gas 2.74 COMEX/NYMEX/ICE ( Precious Metals & Energy) Currency & Commodity Index Currency (Spot) Current Price USD / INR 67.18 Dollar Index 96.55 EUR / USD 1.1060 CRB Index* 190.22 Closing as on 12.07.16 *Closing as on 12.07.16 LME (Base Metals) ( $ per tones) Commodity Closing Price Copper 4869 Aluminum 1676 Zinc 2193.50 Lead 1868 Nickel 10490 SHFE (Base Metals) (Yuan per tones) Commodity Closing Price Copper 38570 Aluminum 12610 Zinc 17068 Lead 13150 Closing as on 12.07.16 Closing as on 12.07.16 LME INVENTORY DATA Aaj Ka Trend 06-July-16 07-July-16 08-July-16 11-July-16 12-July-16 Aluminium -6825 -5925 -5775 -7075 -6050 Copper 10525 -1825 2500 -625 12150 Lead -350 -100 -125 -125 -125 Nickel -1266 636 -936 408 384 Zinc -350 -950 -575 -650 -125 13th July’16
- 5. Equities I Commodities I Currencies I Mutual Funds This is solely for information of clients of Choice Broking and does not construe to be an investment advice. It is also not intended as an offer or solicitation for the purchase and sale of any financial instruments. Any action taken by you on the basis of the information contained herein is your responsibility alone and Choice Broking its subsidiaries or its employees or associates will not be liable in any manner for the consequences of such action taken by you. We have exercised due diligence in checking the correctness and authenticity of the information contained in this recommendation, but Choice Broking or any of its subsidiaries or associates or employees shall not be in any way responsible for any loss or damage that may arise to any person from any inadvertent error in the information contained in this recommendation or any action taken on basis of this information. Technical analysis studies market psychology, price patterns and volume levels. It is used to forecast future price and market movements. Technical analysis is complementary to fundamental analysis and news sources. The recommendations issued herewith might be contrary to recommendations issued by Choice Broking in the company research undertaken as the recommendations stated in this report is derived purely from technical analysis. Choice Broking has based this document on information obtained from sources it believes to be reliable but which it has not independently verified; Choice Broking makes no guarantee, representation or warranty and accepts no responsibility or liability as to its accuracy or completeness. The opinions contained within the report are based upon publicly available information at the time of publication and are subject to change without notice. The information and any disclosures provided herein are in summary form and have been prepared for informational purposes. The recommendations and suggested price levels are intended purely for trading purposes. The recommendations are valid for the day of the report however trading trends and volumes might vary substantially on an intraday basis and the recommendations may be subject to change. The information and any disclosures provided herein may be considered confidential. Any use, distribution, modification, copying, forwarding or disclosure by any person is strictly prohibited. The information and any disclosures provided herein do not constitute a solicitation or offer to purchase or sell any security or other financial product or instrument. The current performance may be unaudited. Past performance does not guarantee future returns. There can be no assurance that investments will achieve any targeted rates of return, and there is no guarantee against the loss of your entire investment. POTENTIAL CONFLICT OF INTEREST DISCLOSURE (as on date of report) Disclosure of interest statement – • Analyst interest of the stock /Instrument(s): - No. • Firm interest of the stock / Instrument (s): - No. Disclaimer Contact Us Amit Pathania Research Associate amit.pathania@choiceindia.com Rohan Patil Research Associate rohan.patil@choiceindia.com www.choiceindia.comcustomercare@choiceindia.com SEBI Registered - Research Analyst Equities I Commodities I Currencies I Mutual Funds Aaj Ka Trend 13th July’16 Neeraj Yadav Research Advisor neeraj.yadav@choiceindia.com Anish Vyas Senior Research Associate anish.vyas@choiceindia.com Amit Pathania Digitally signed by Amit Pathania DN: cn=Amit Pathania, o=Choice Equity Broking Pvt. ltd, ou=Research Department, email=amit.pathania@choiceindia.com, c=IN Date: 2016.07.13 08:49:34 +05'30'