Downloaded 115 times
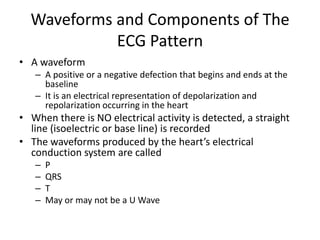
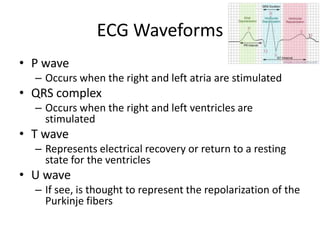
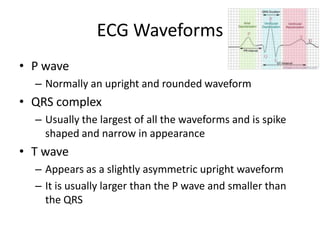
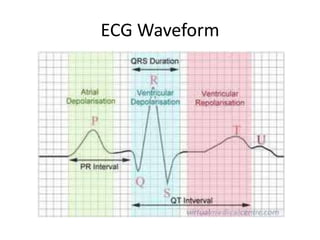
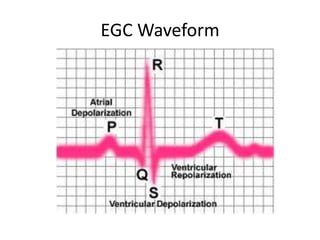
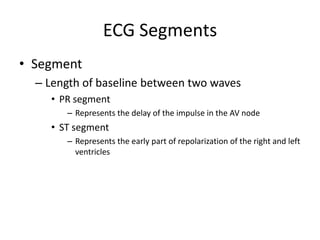
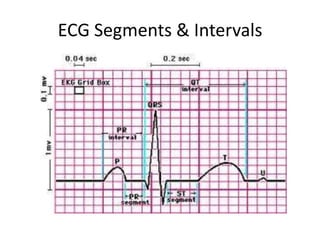
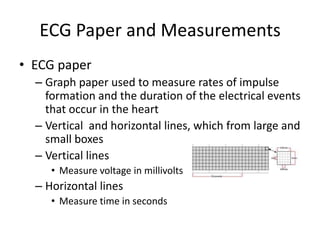
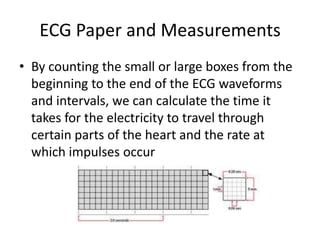
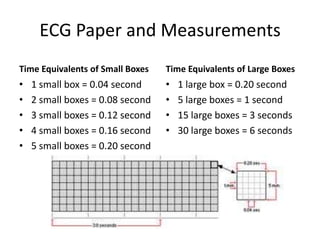
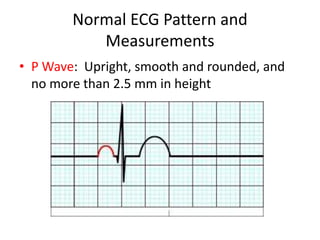
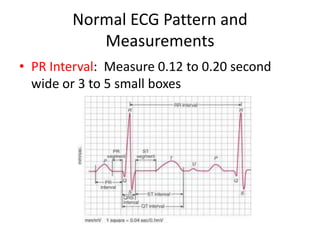
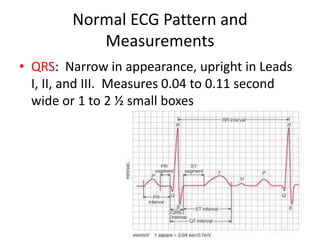
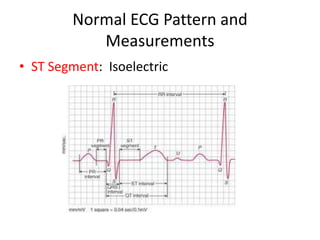
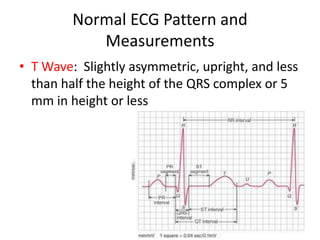
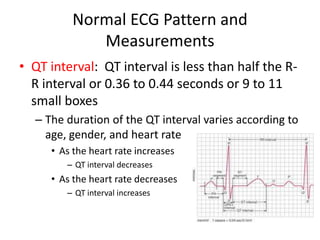
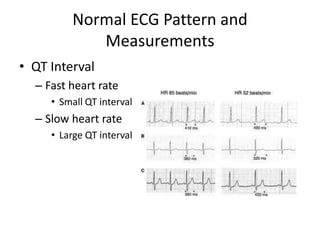
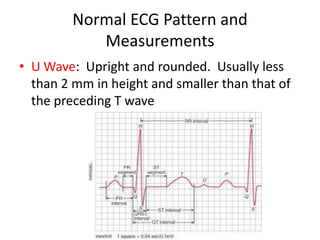
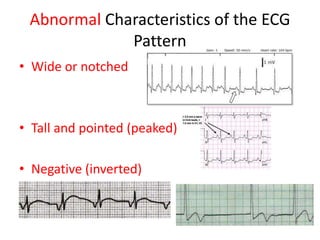
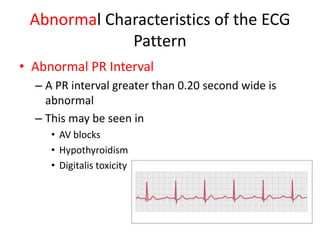
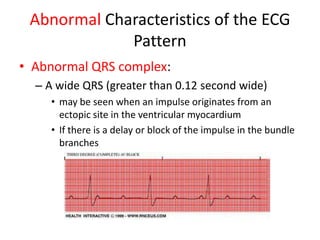
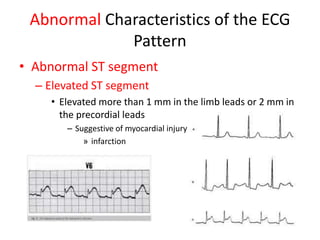
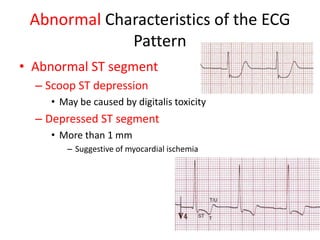
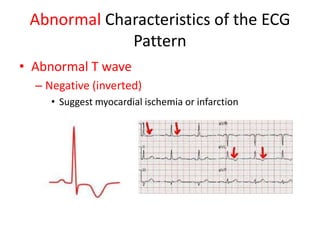
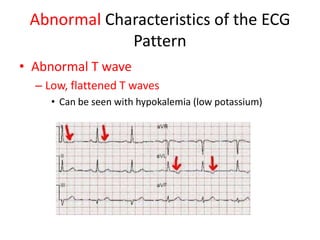
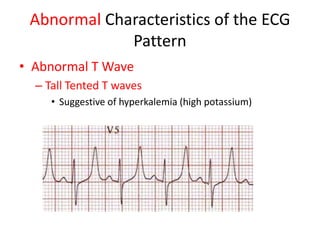
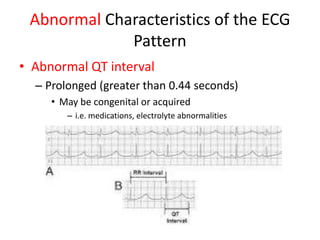
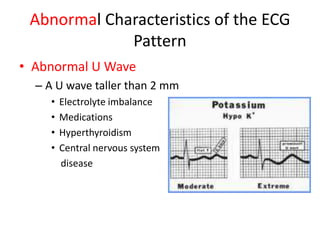
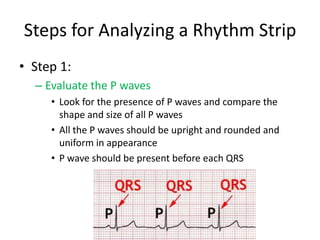
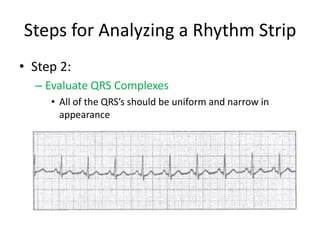
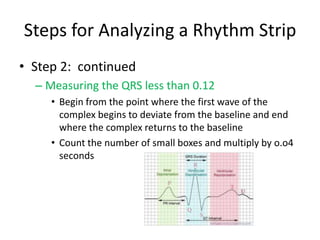
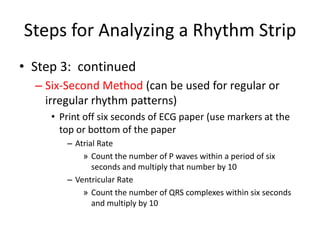
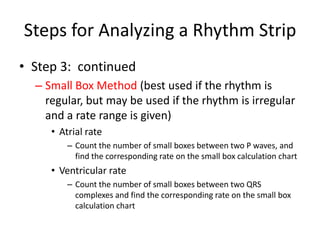

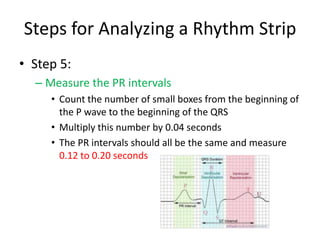
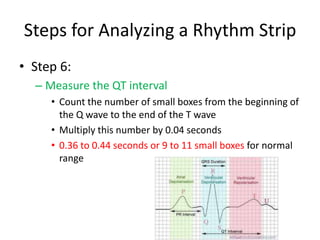

The document provides information on understanding rhythm strips and ECG patterns, including: - It defines the common waveforms that make up the ECG pattern (P, QRS, T, U waves) and segments between waves. - Normal values are provided for waveform durations and amplitudes, as well as heart rate. - Abnormal characteristics of the ECG pattern are described, such as abnormal P waves, PR interval, ST segment, T waves, and QT interval. - A 5-step process is outlined for analyzing rhythm strips, including evaluating P waves and QRS complexes, calculating heart rates, assessing rhythm regularity, and measuring PR intervals.