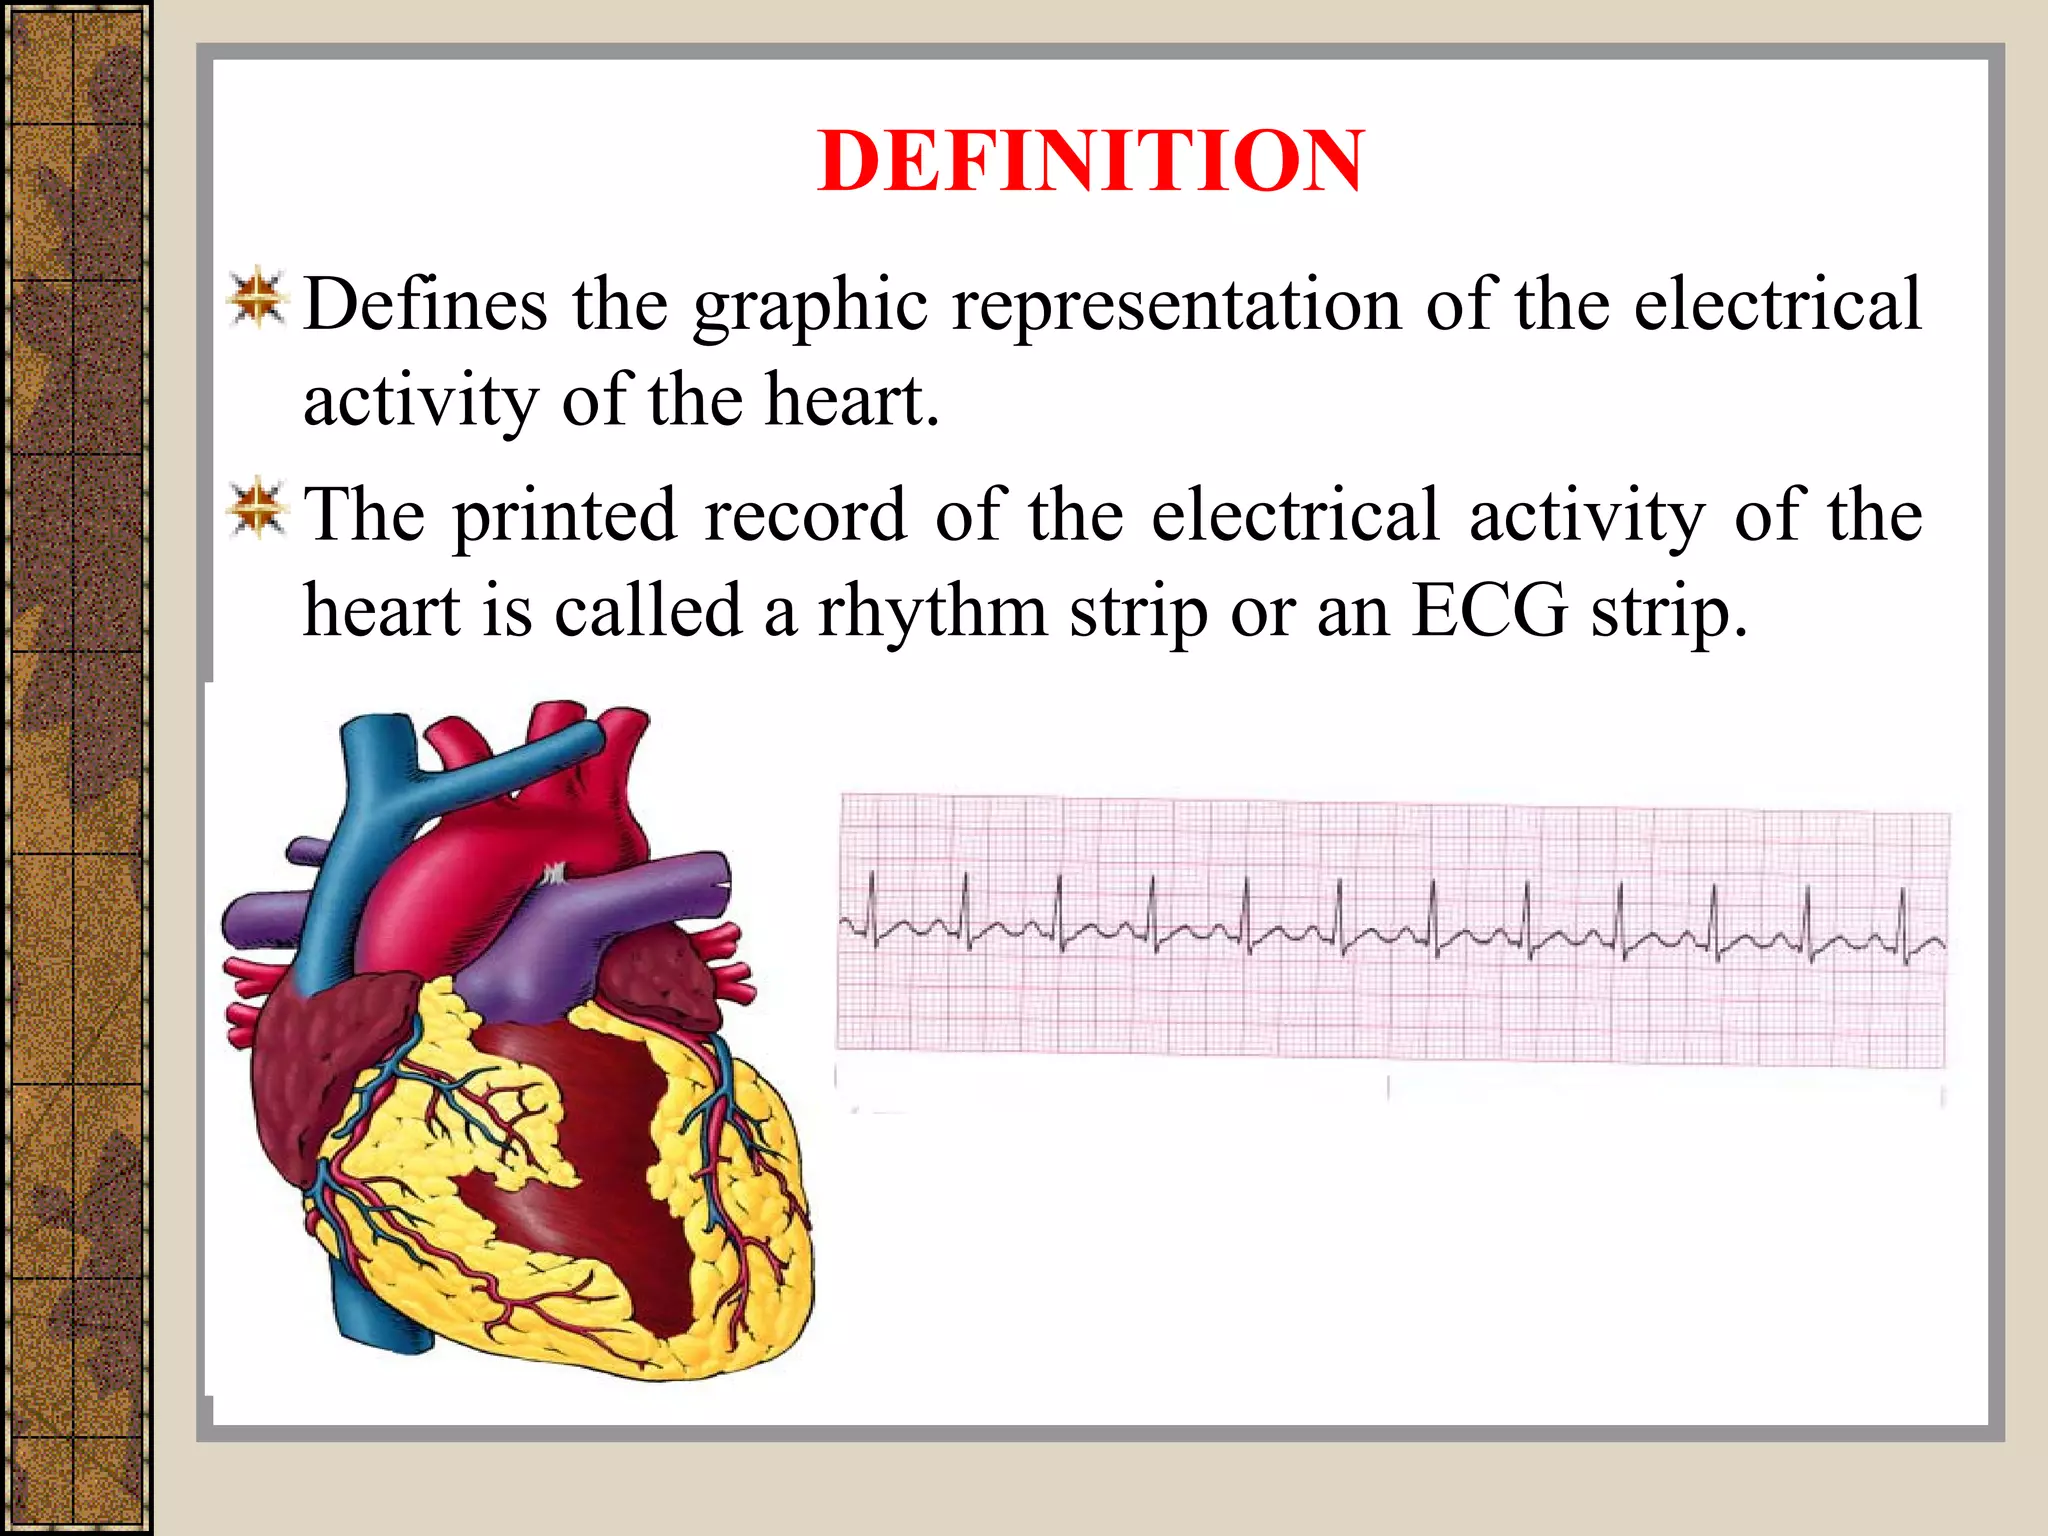
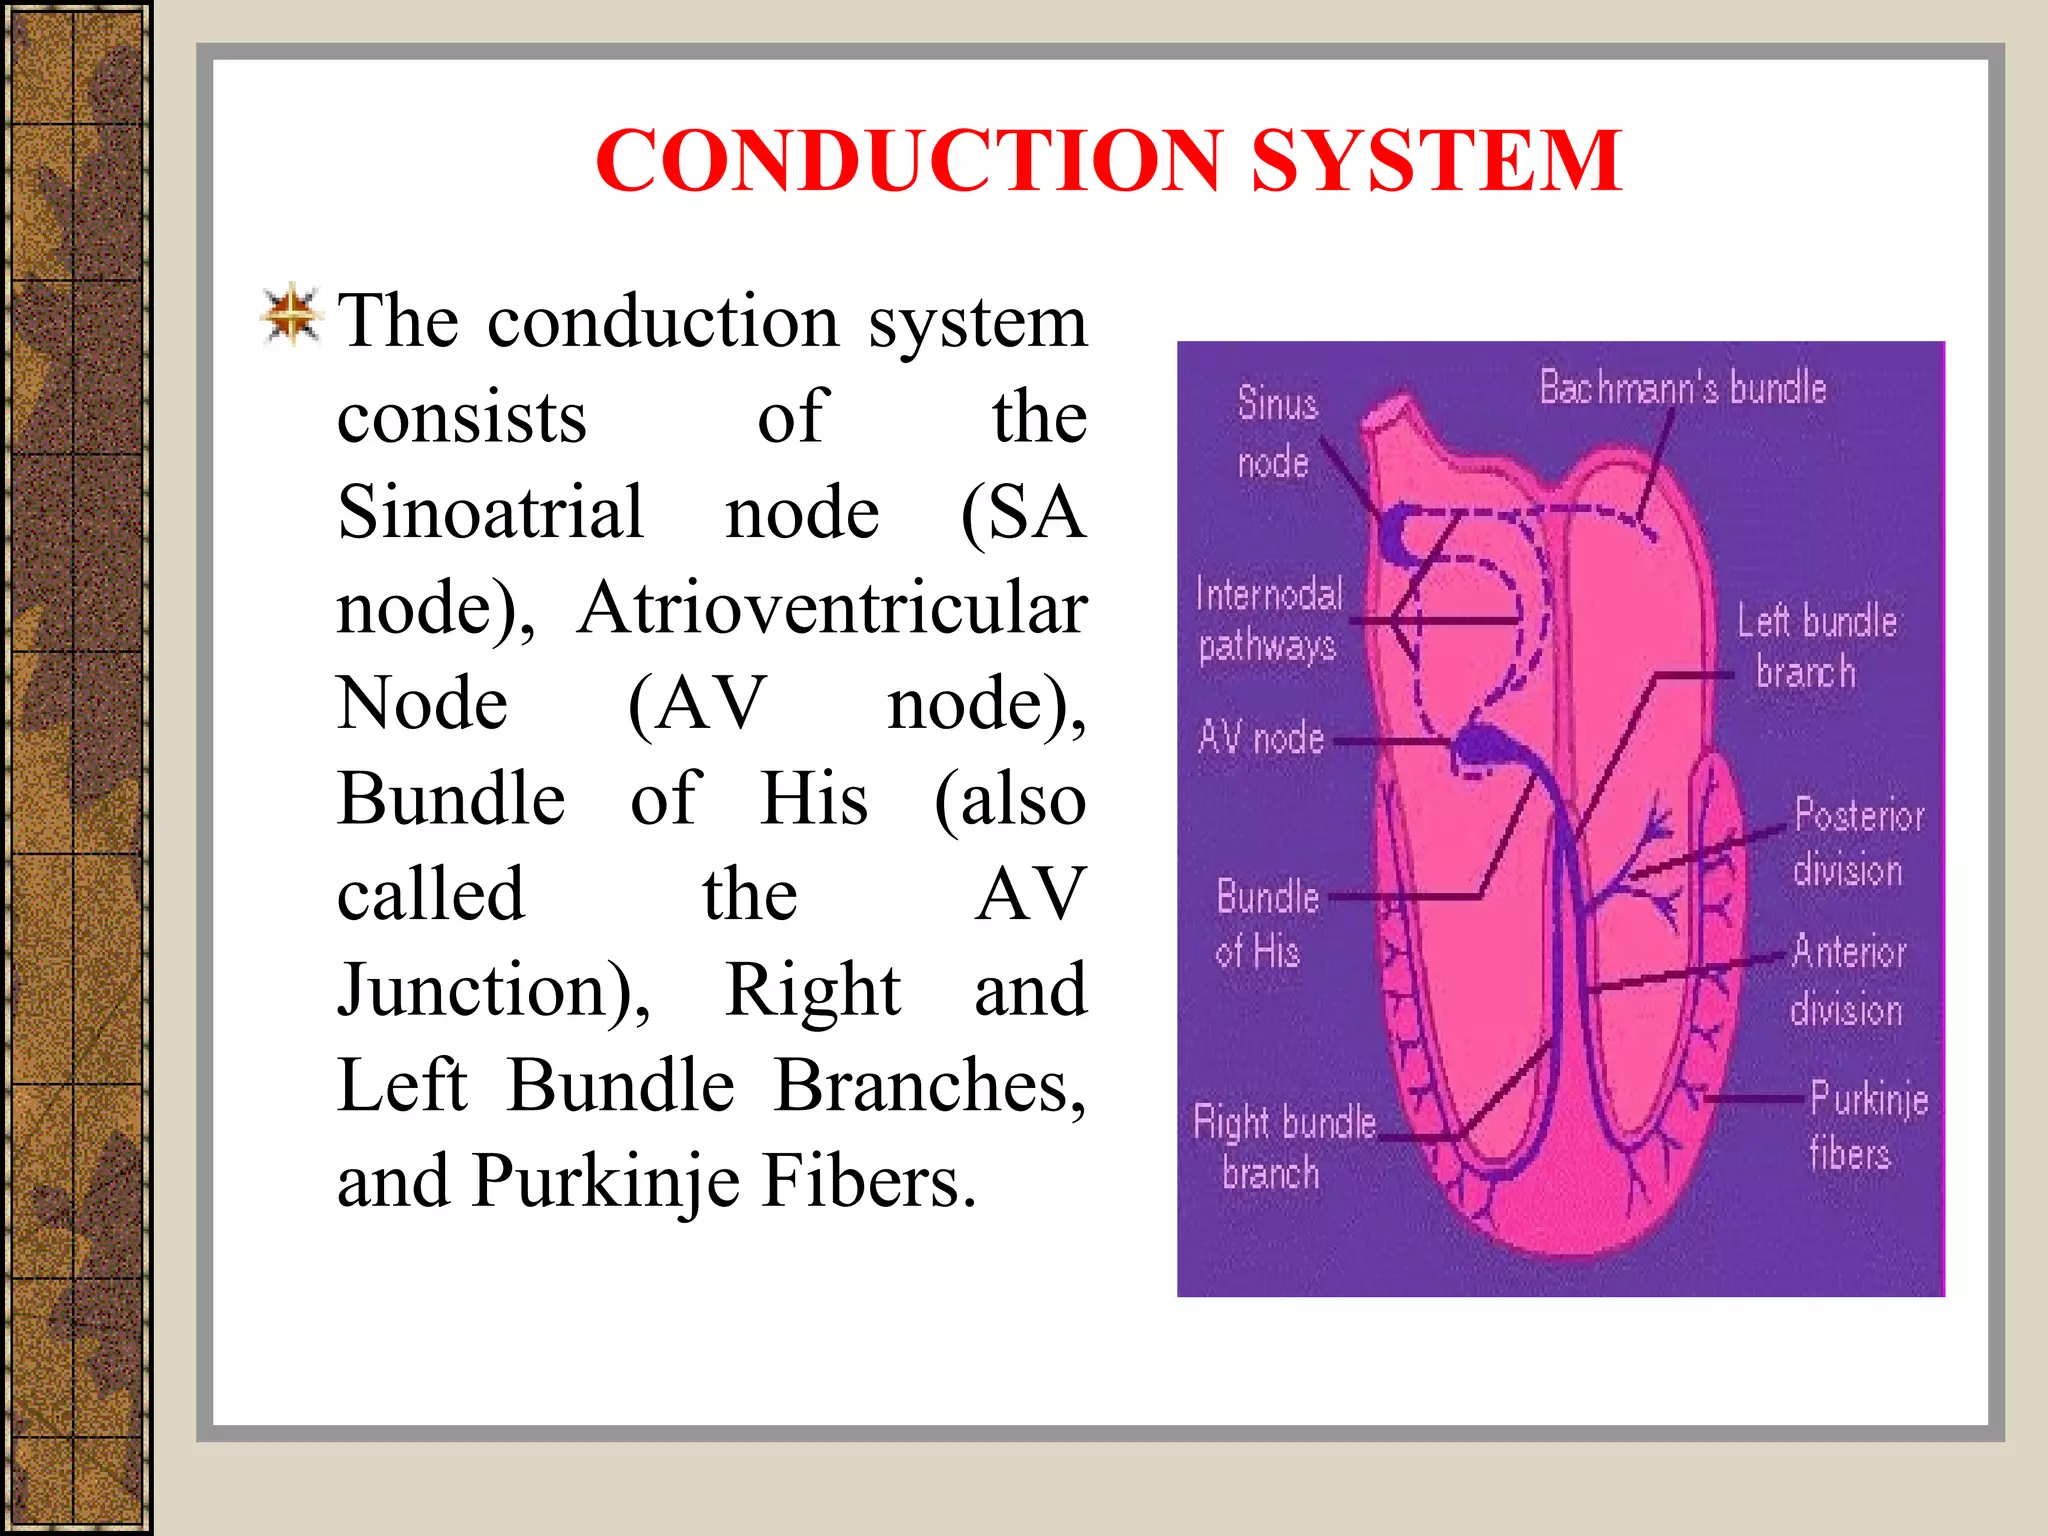
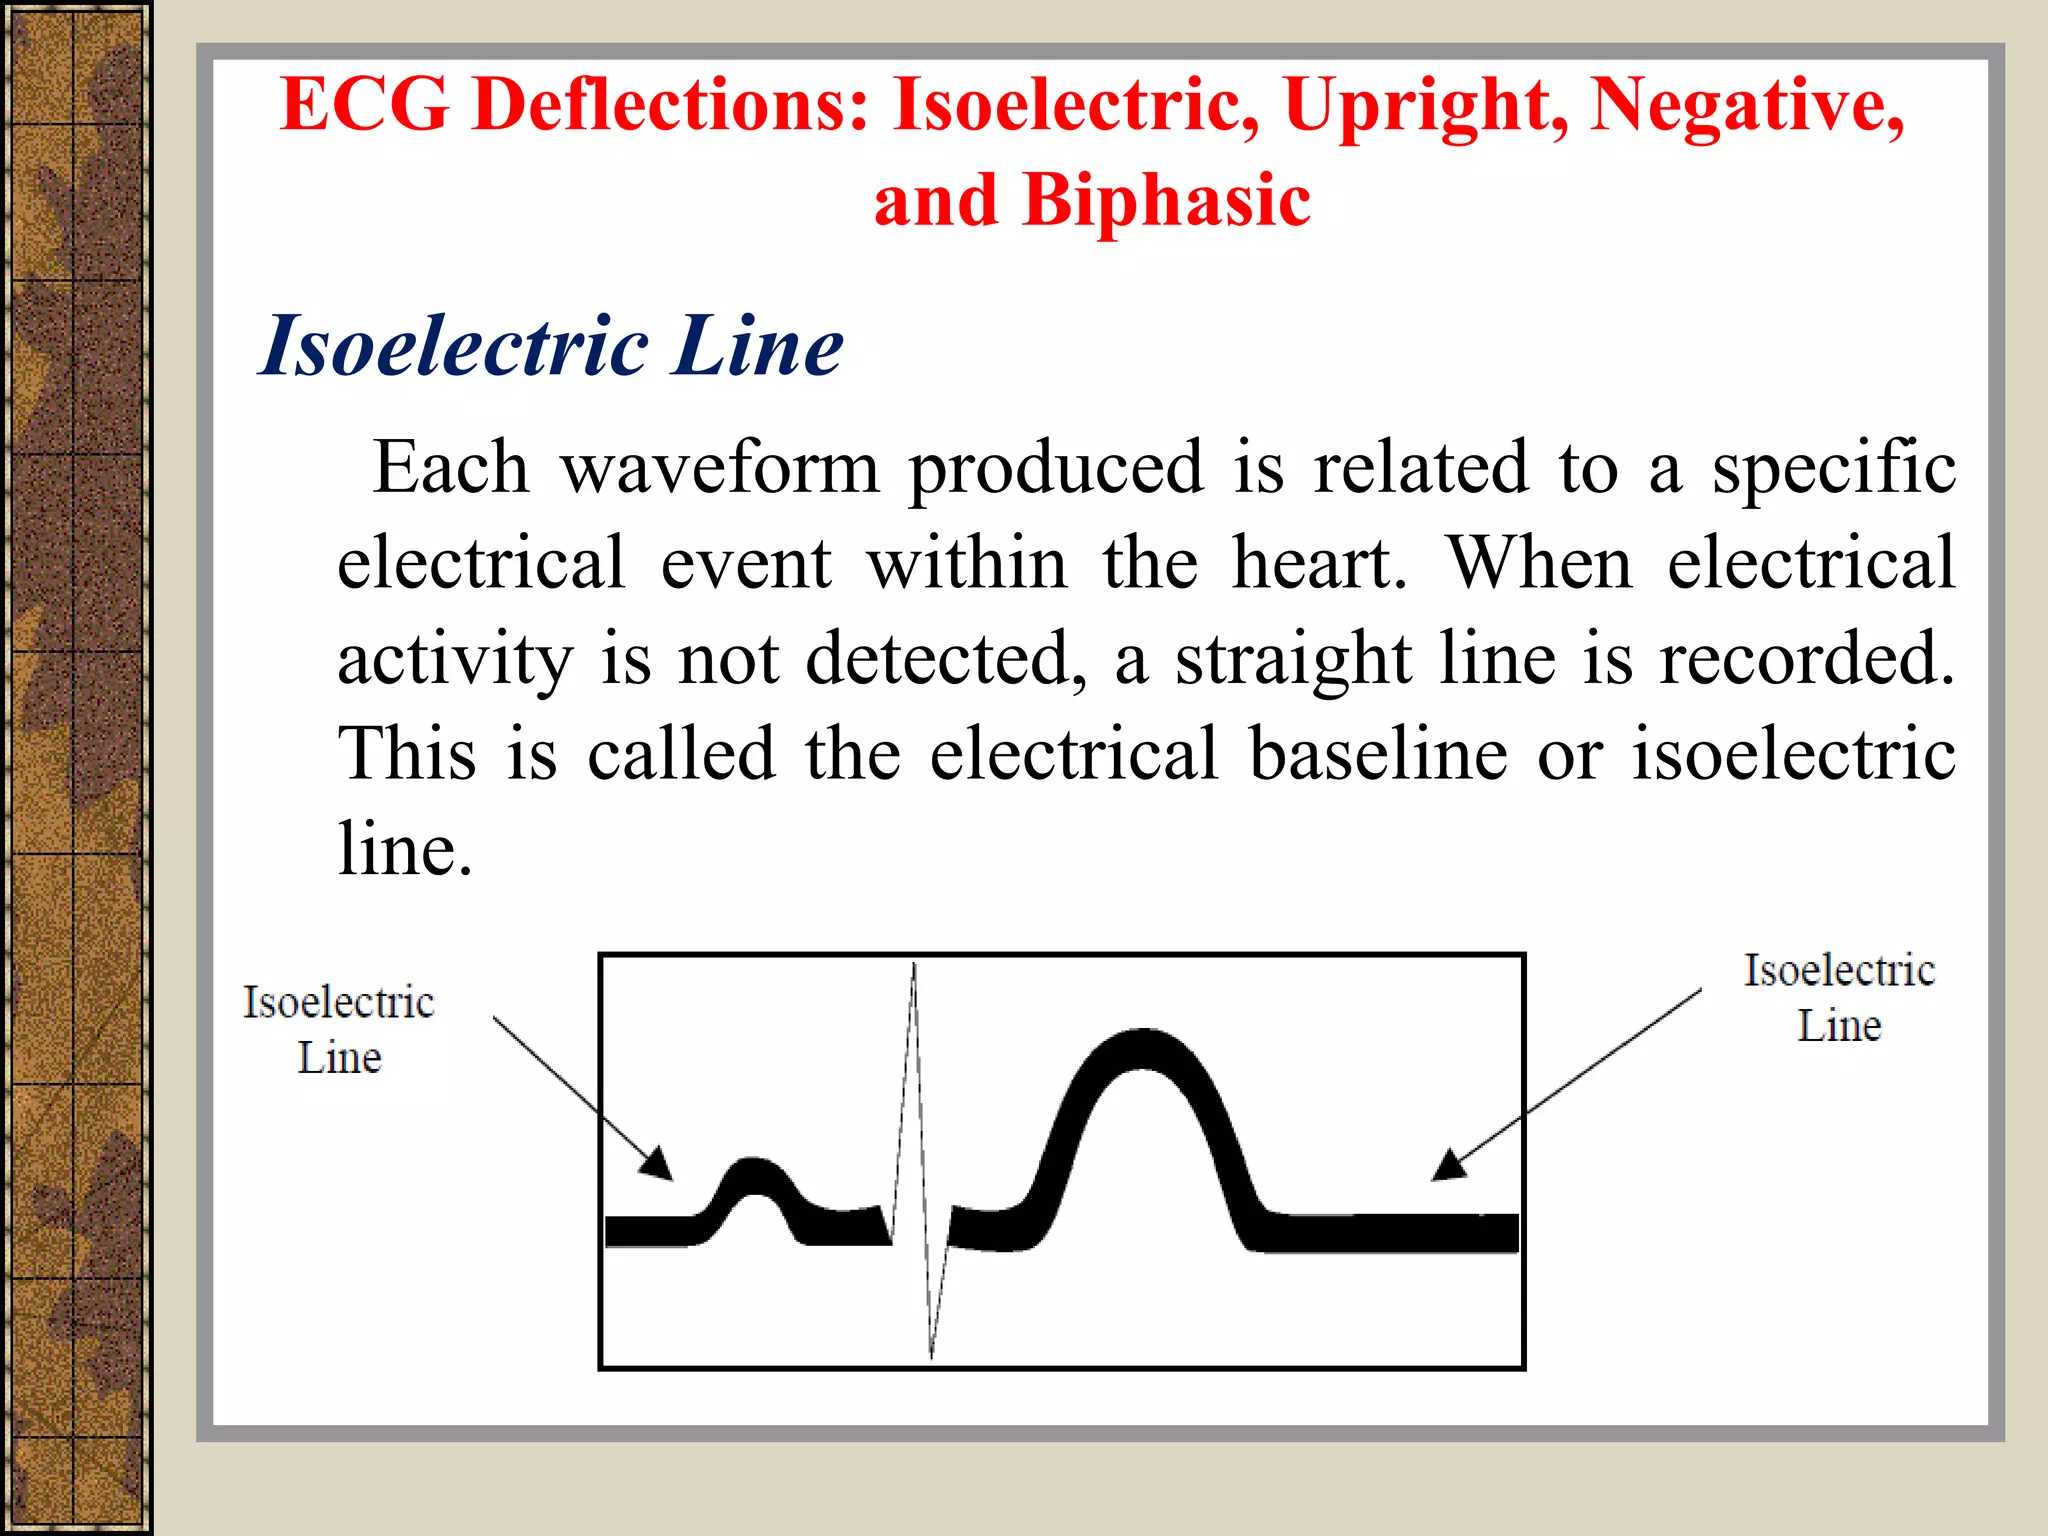
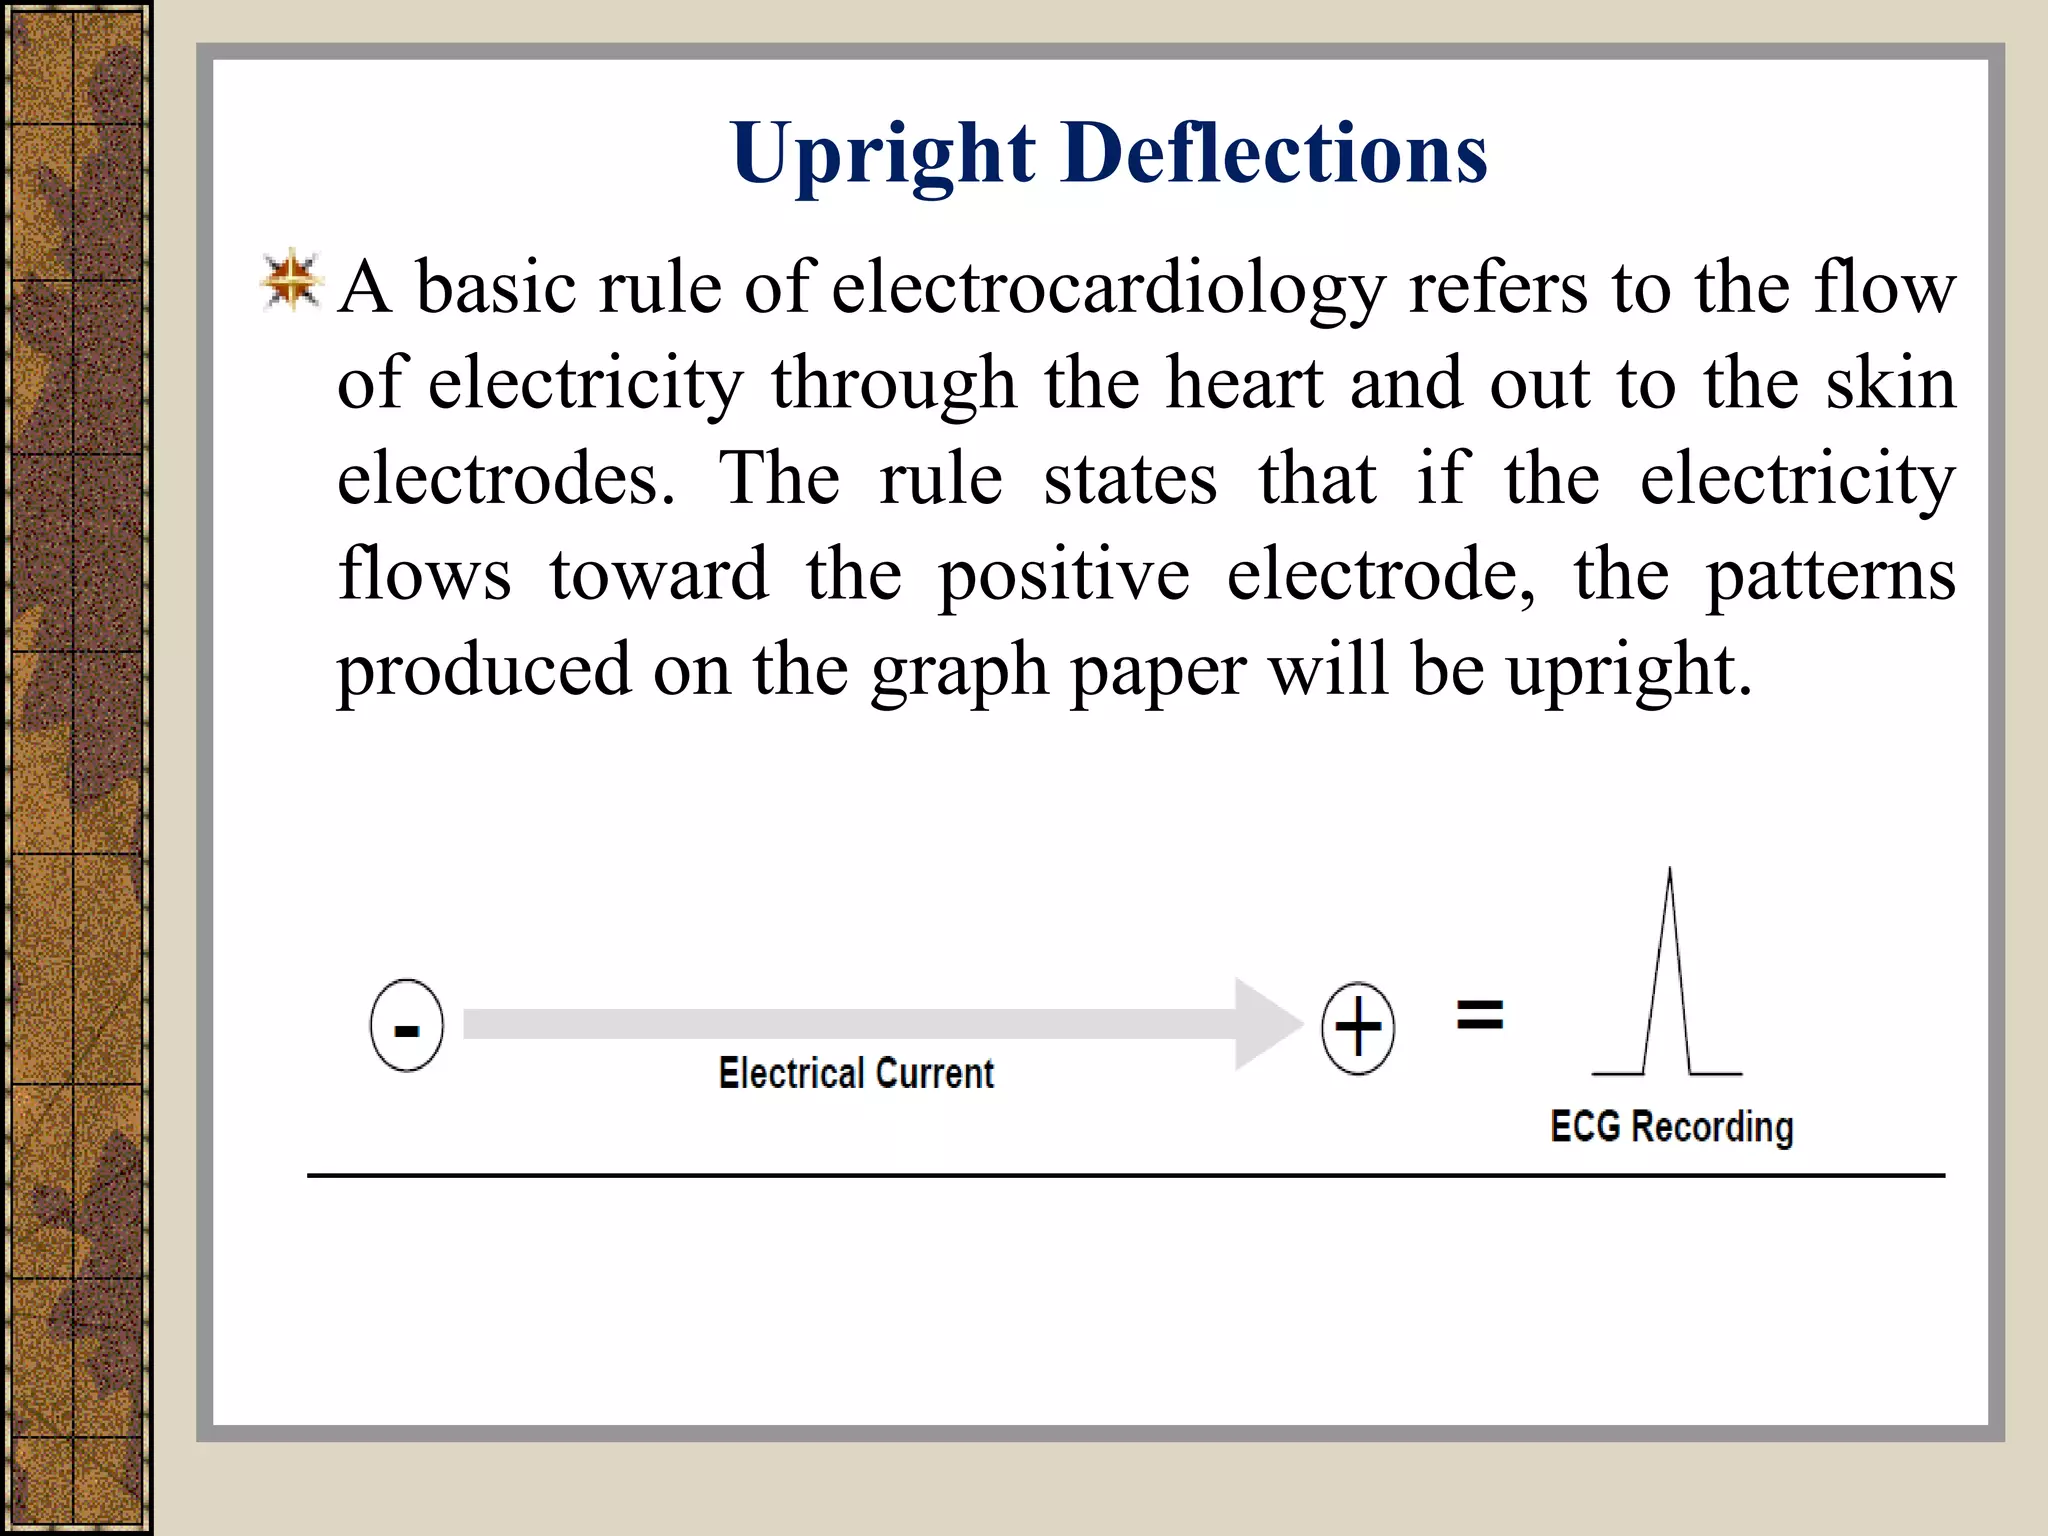
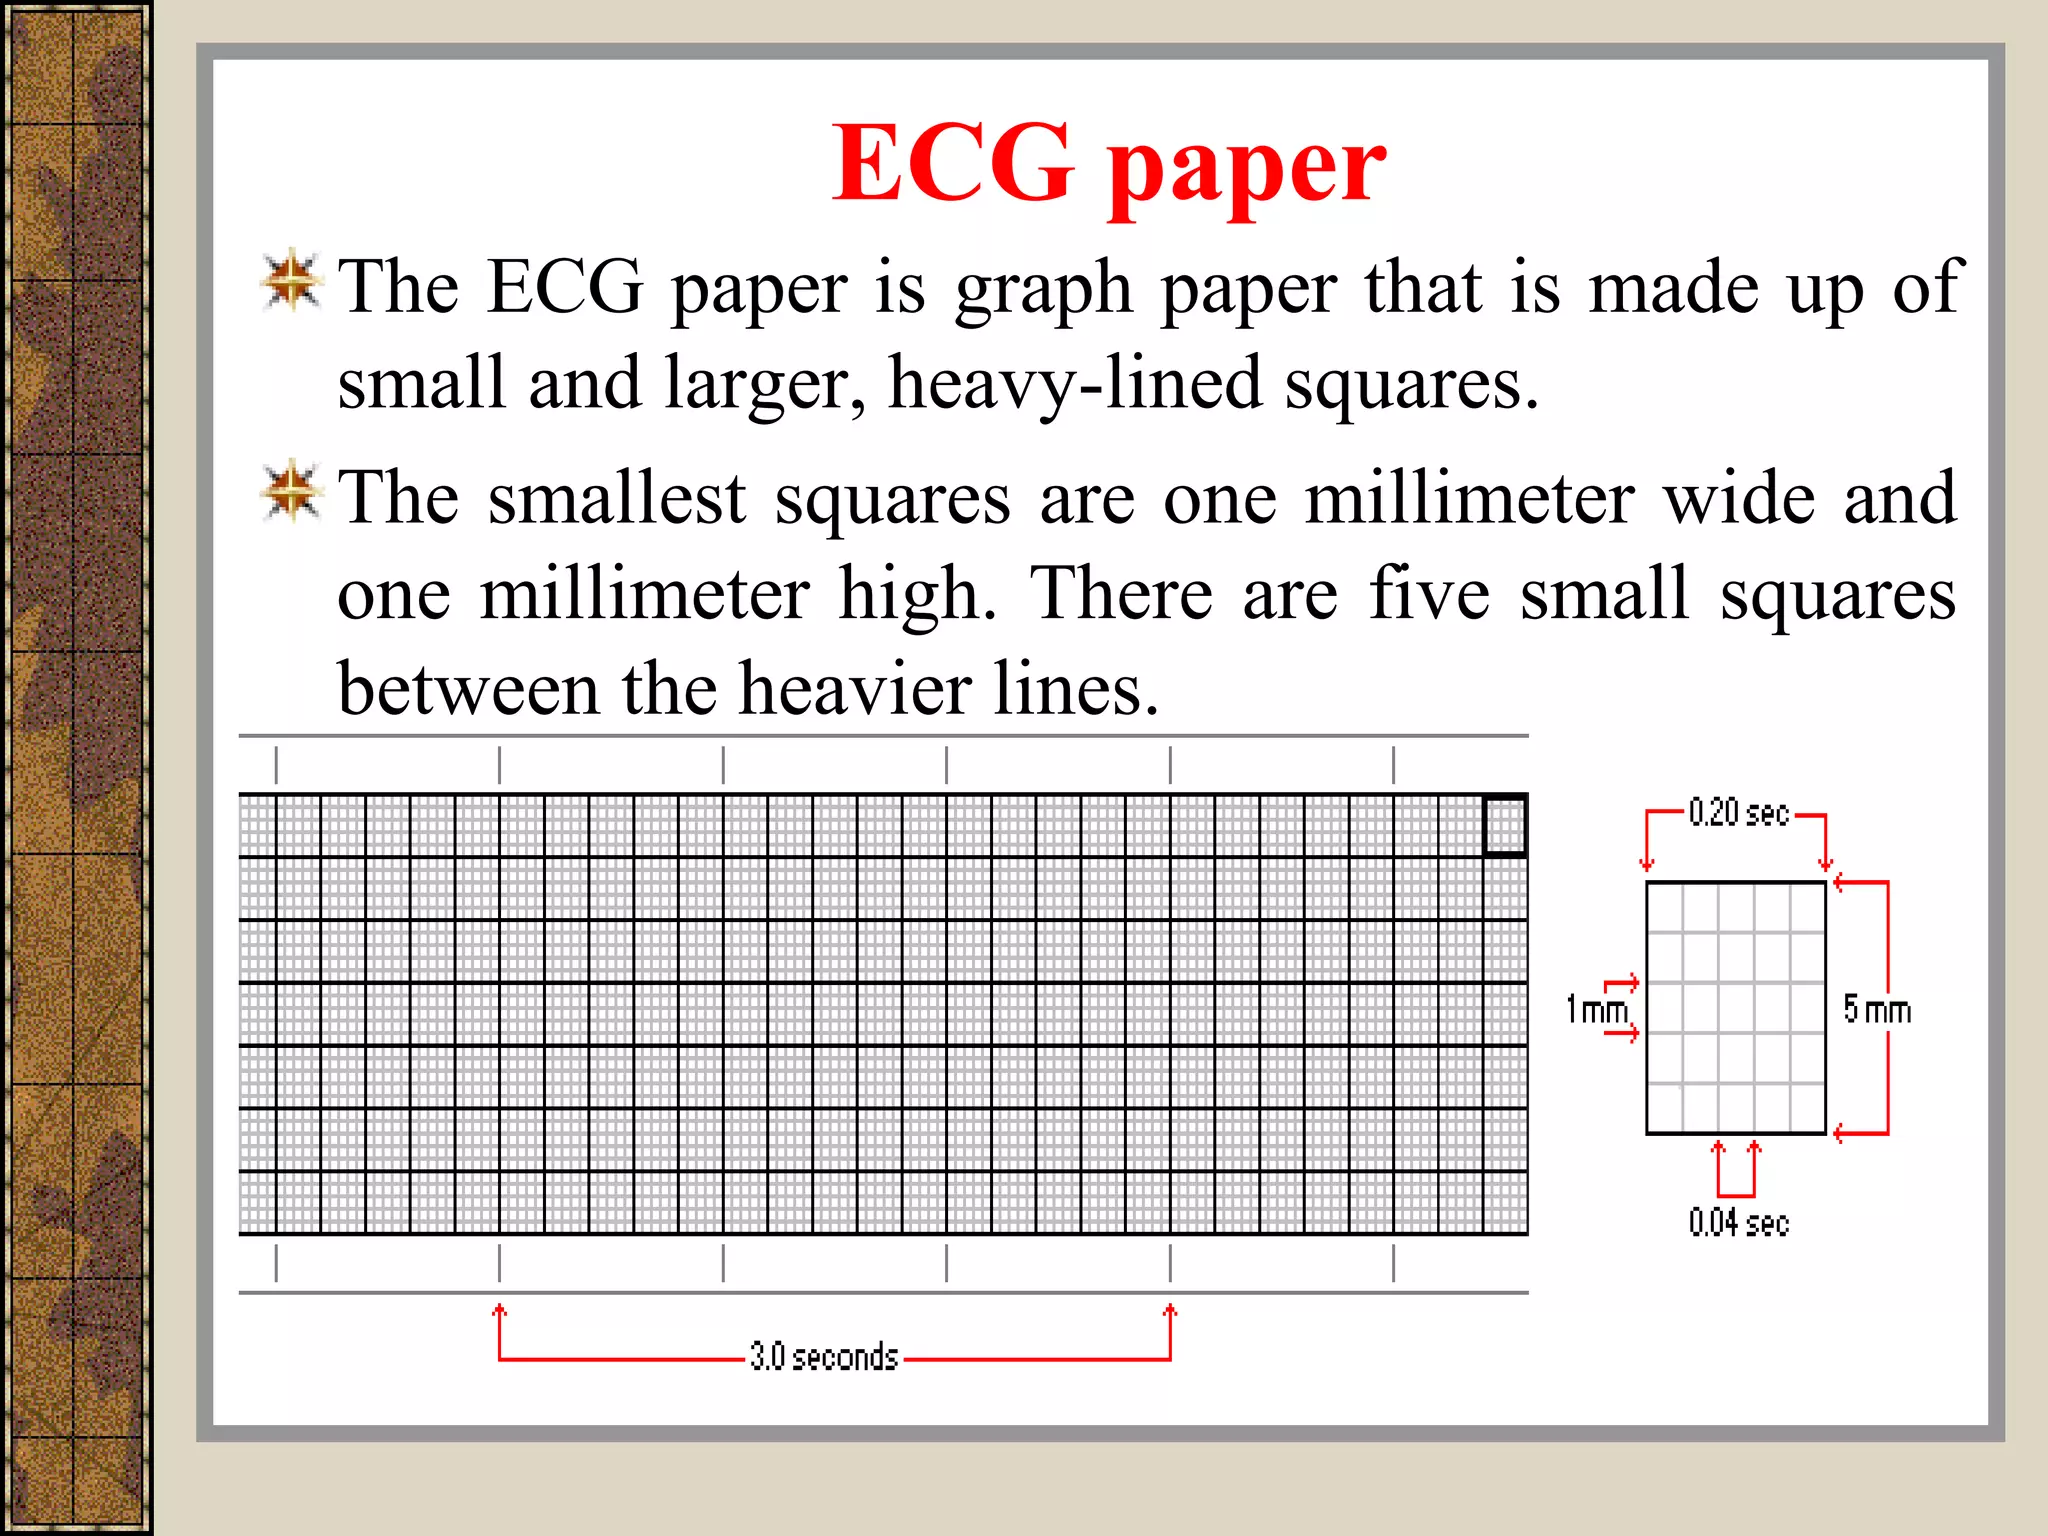
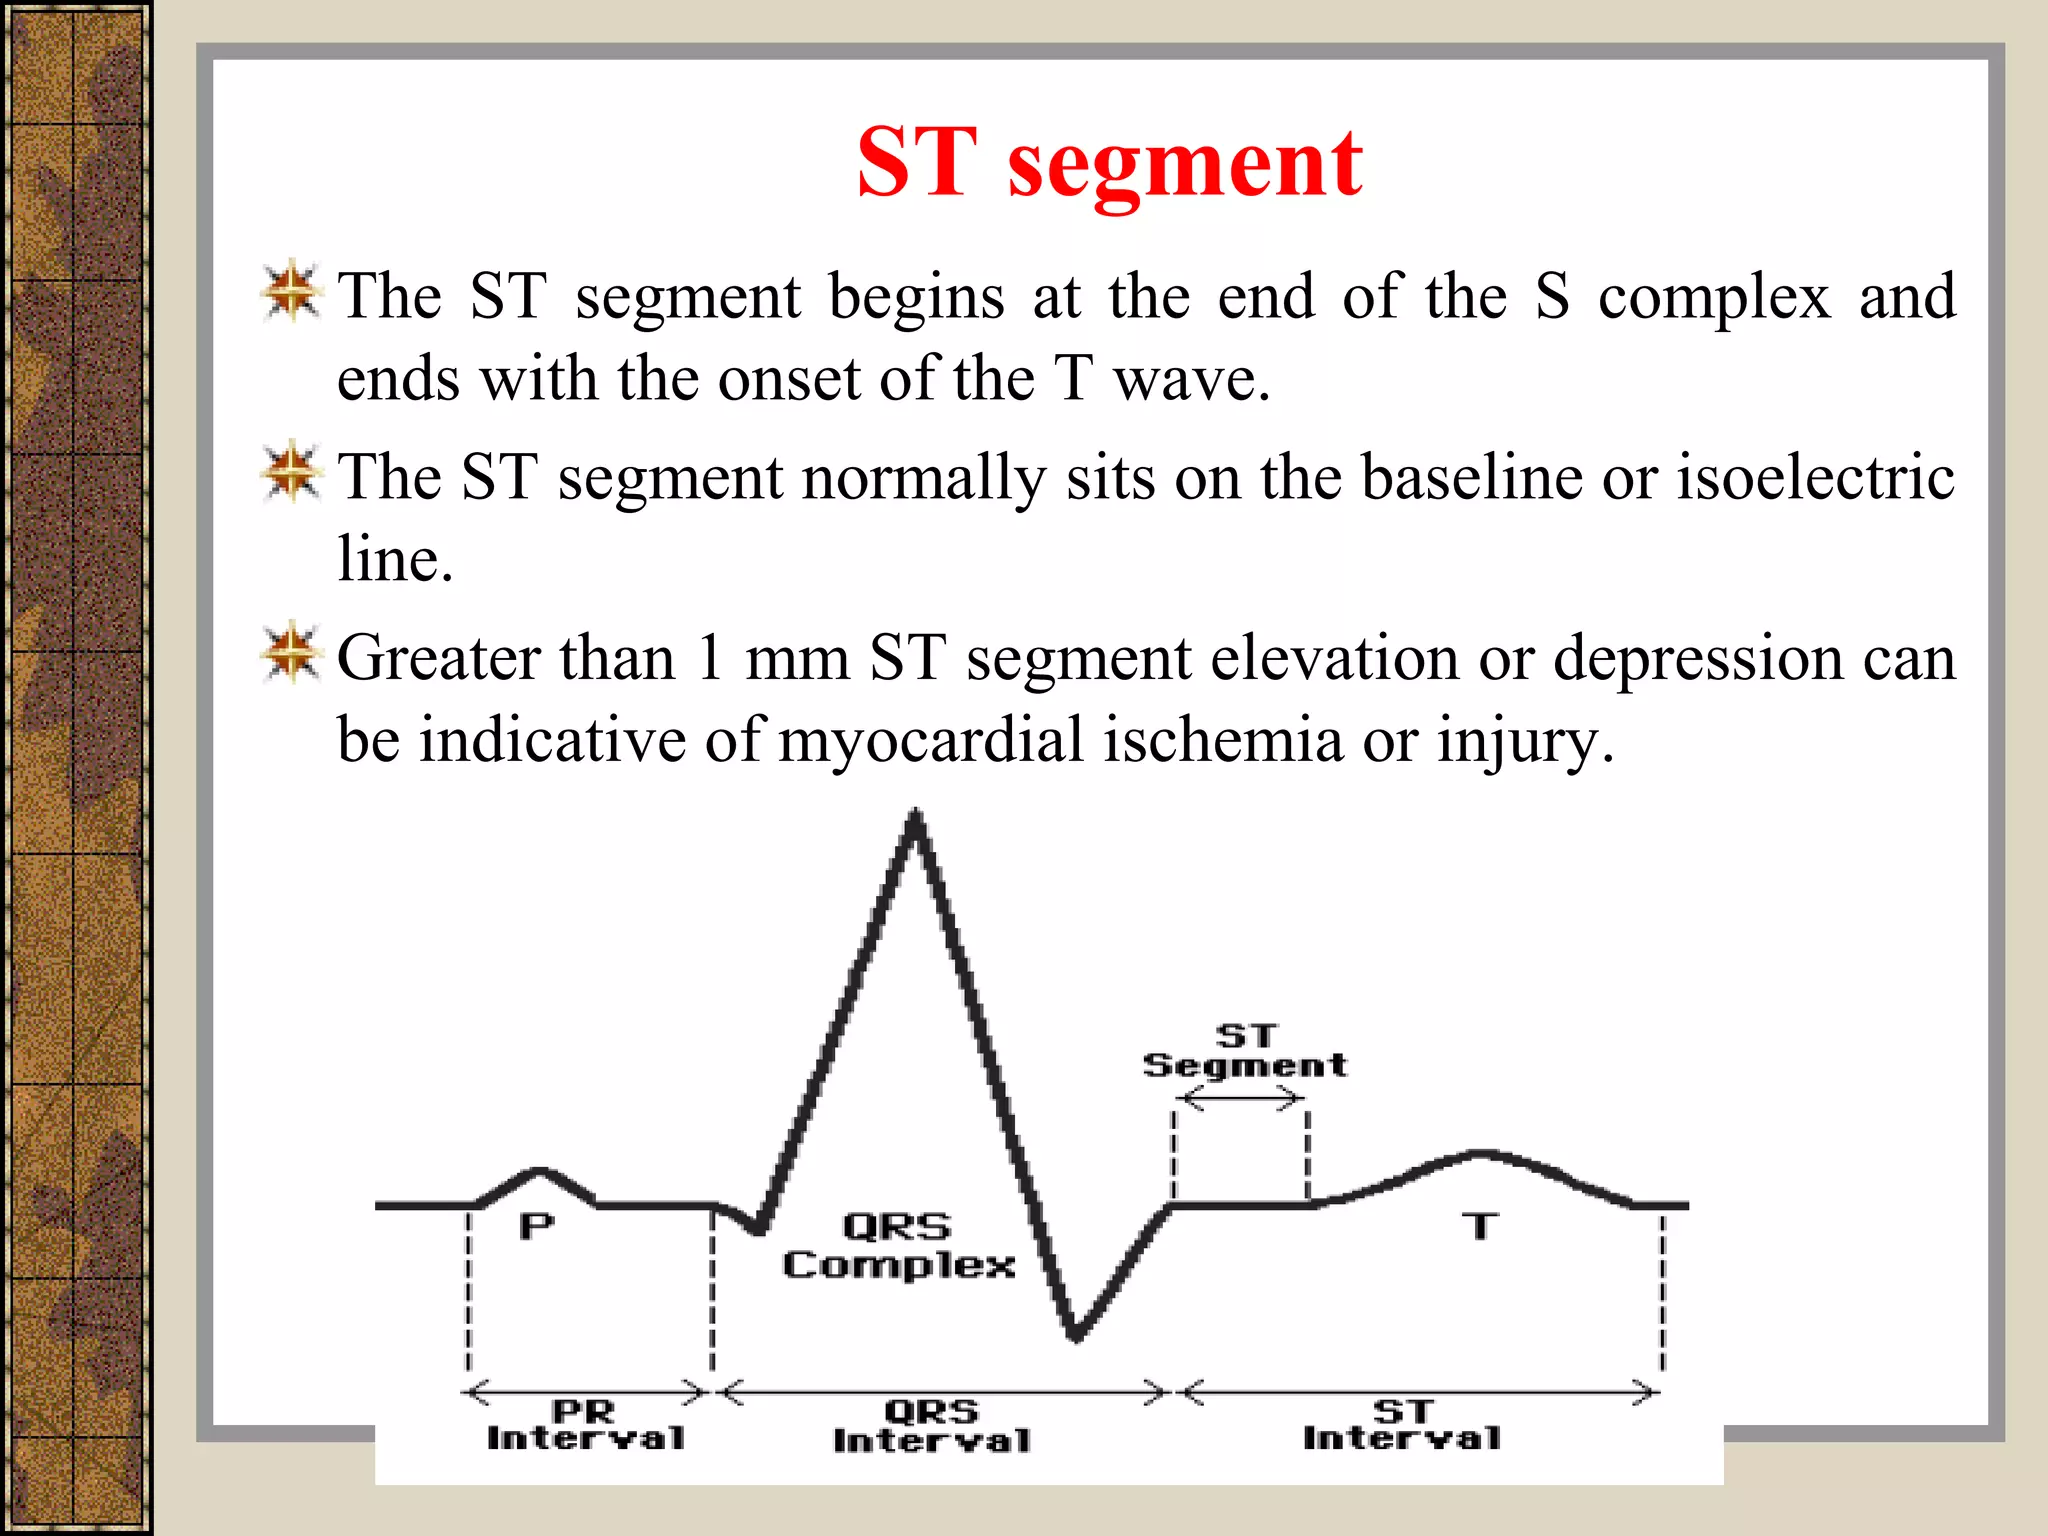
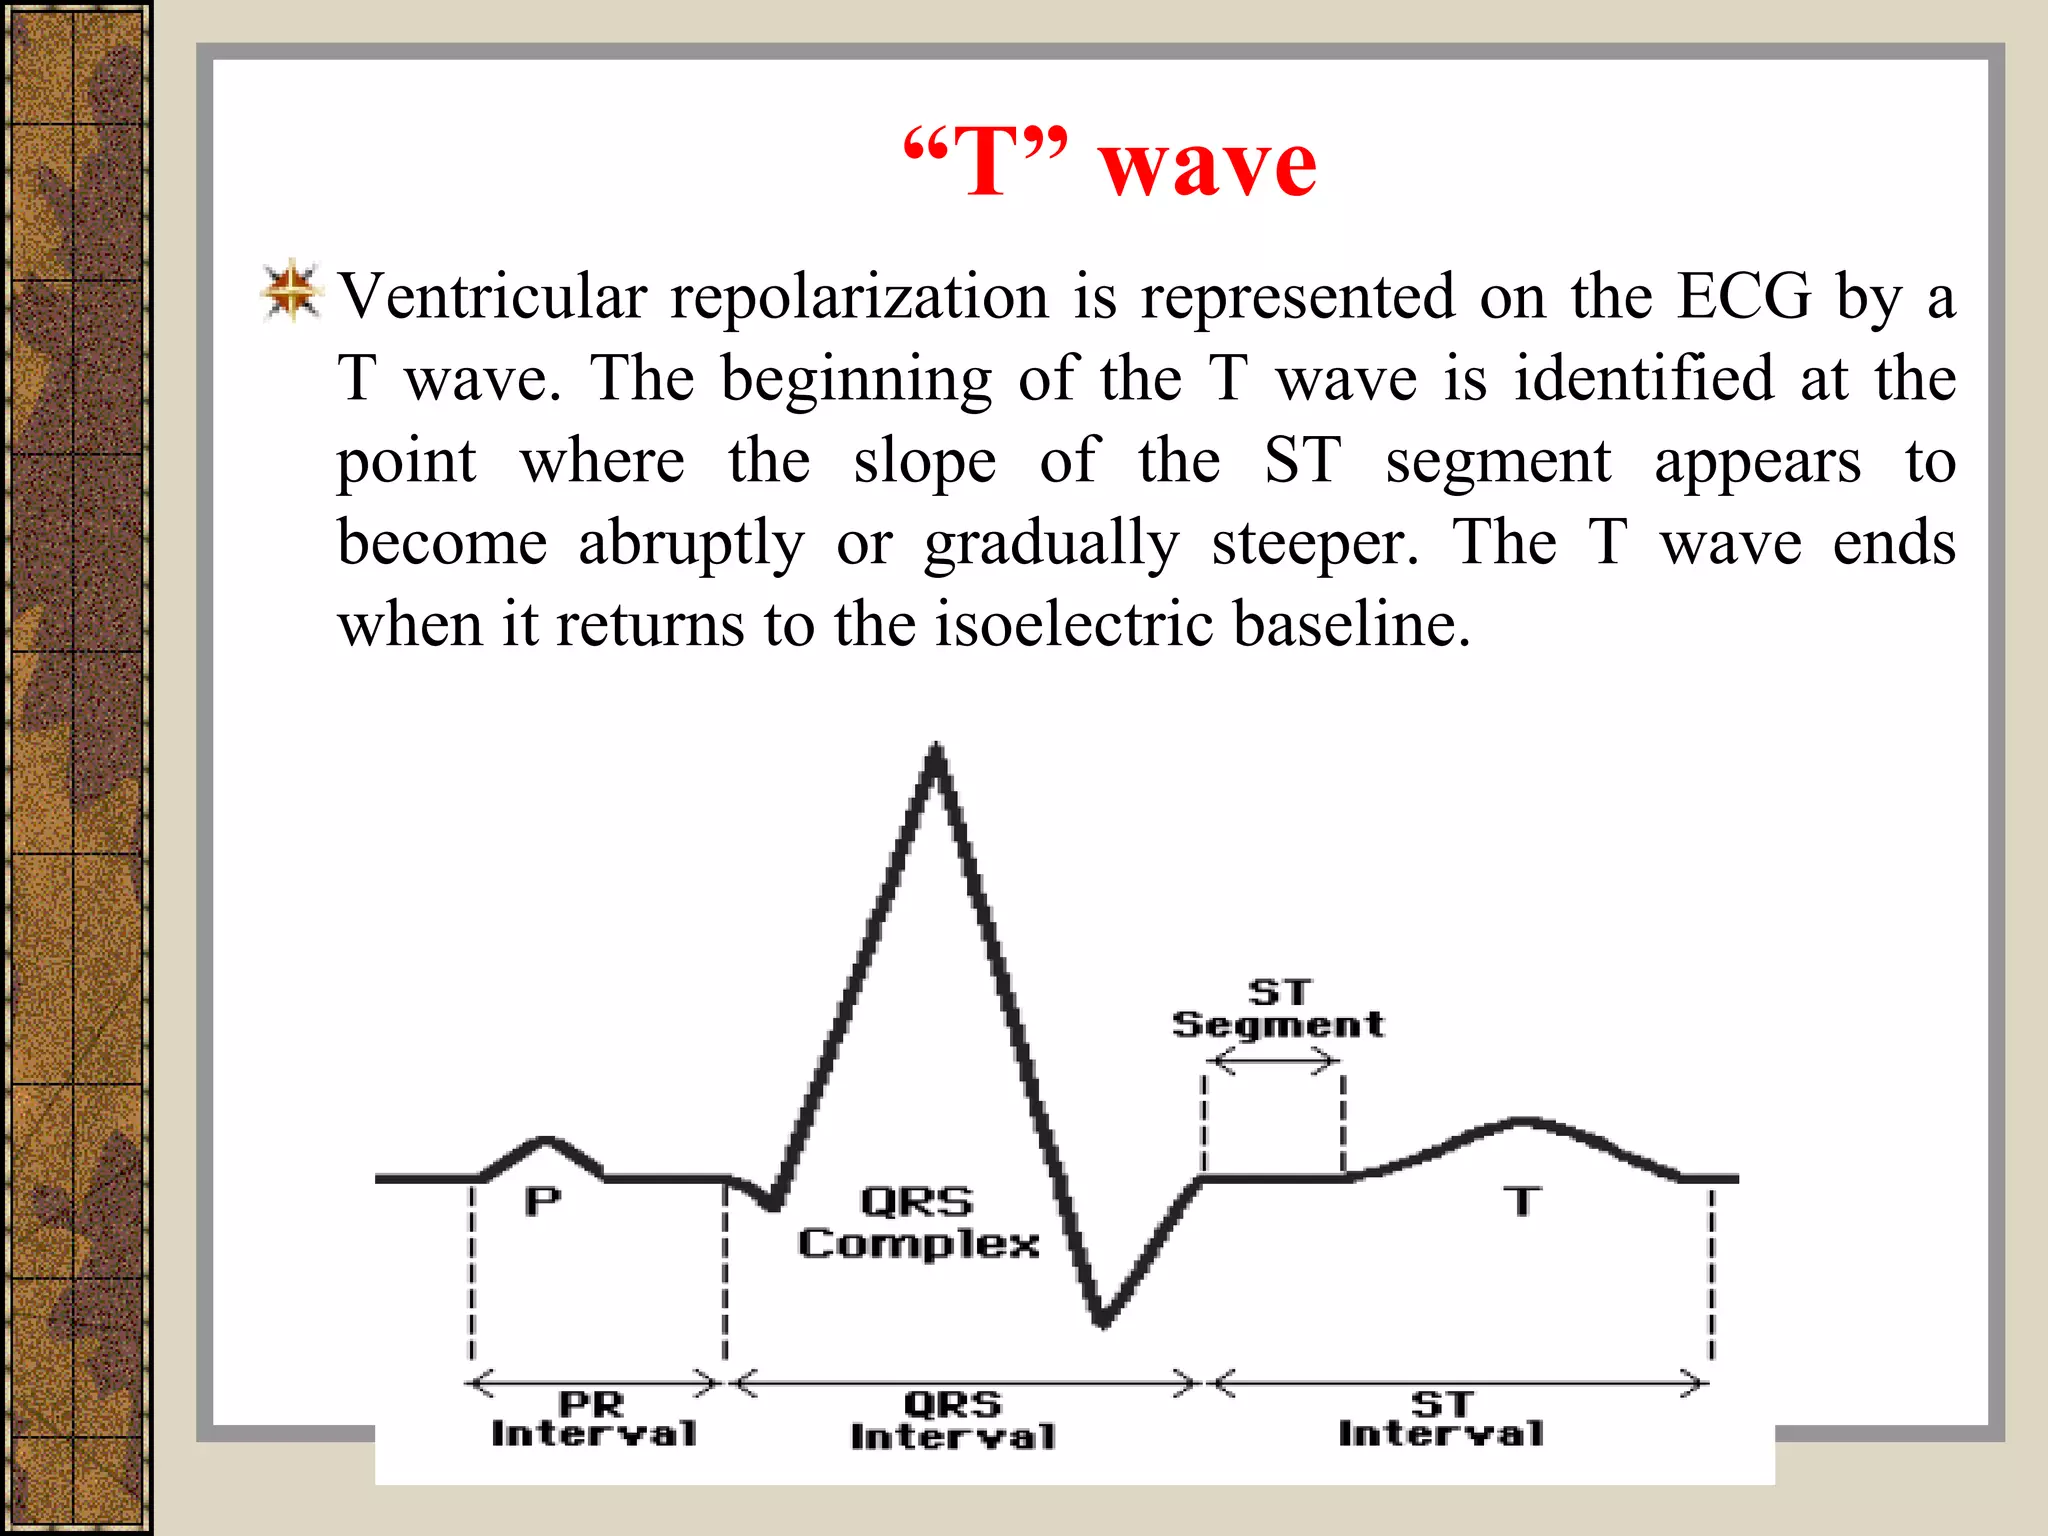
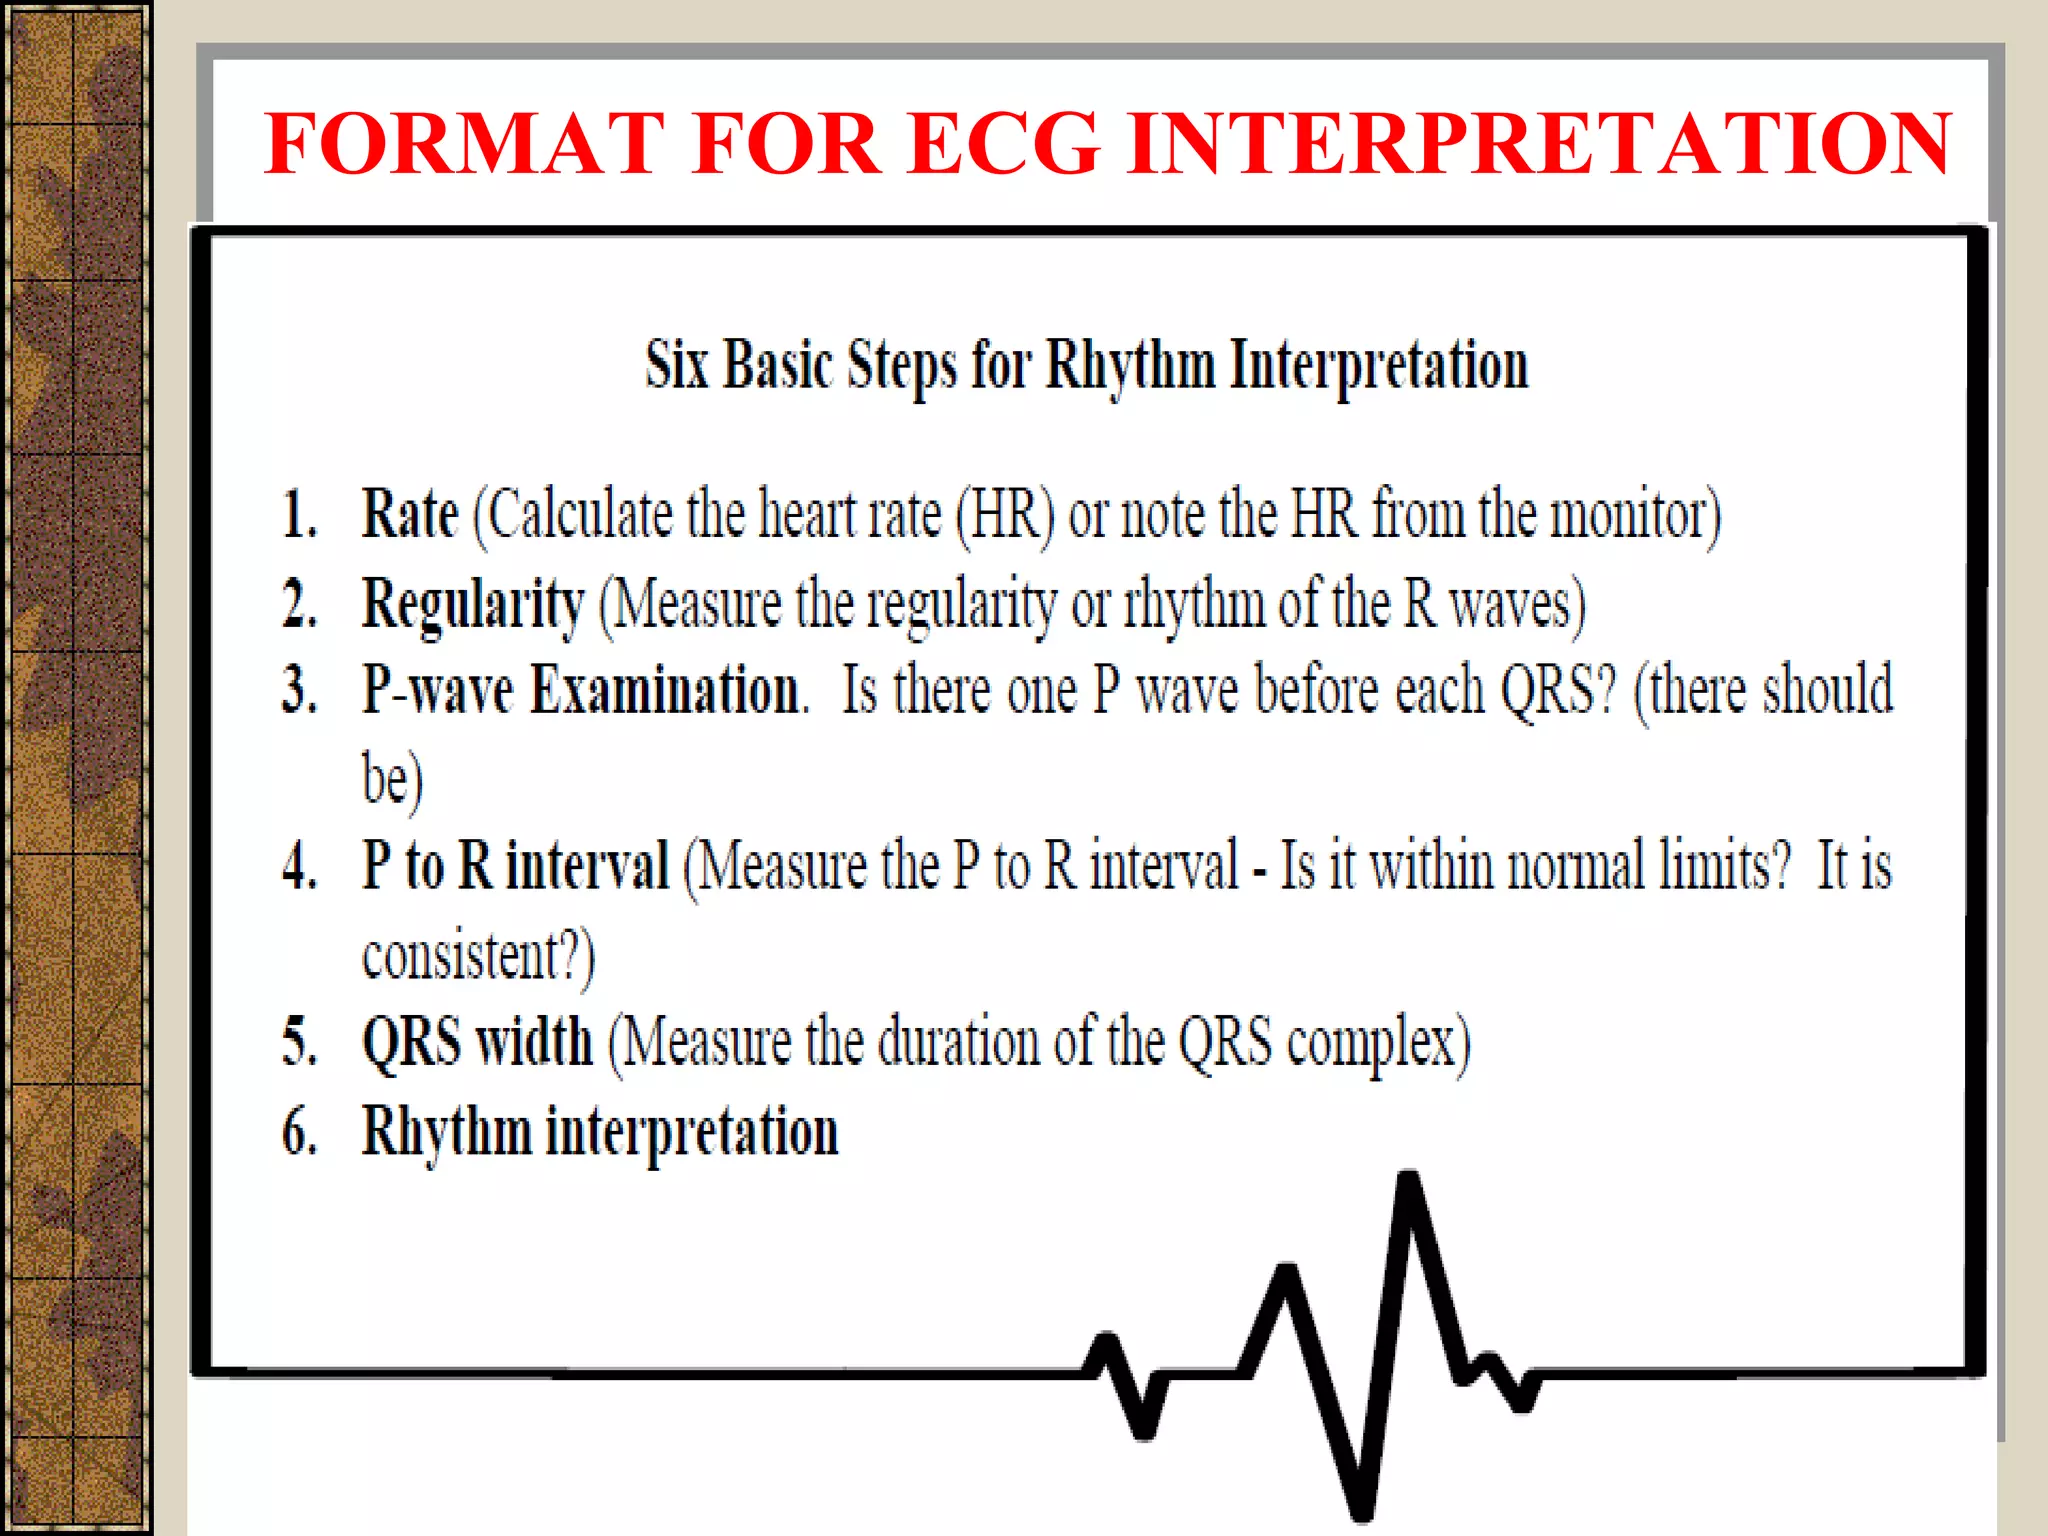
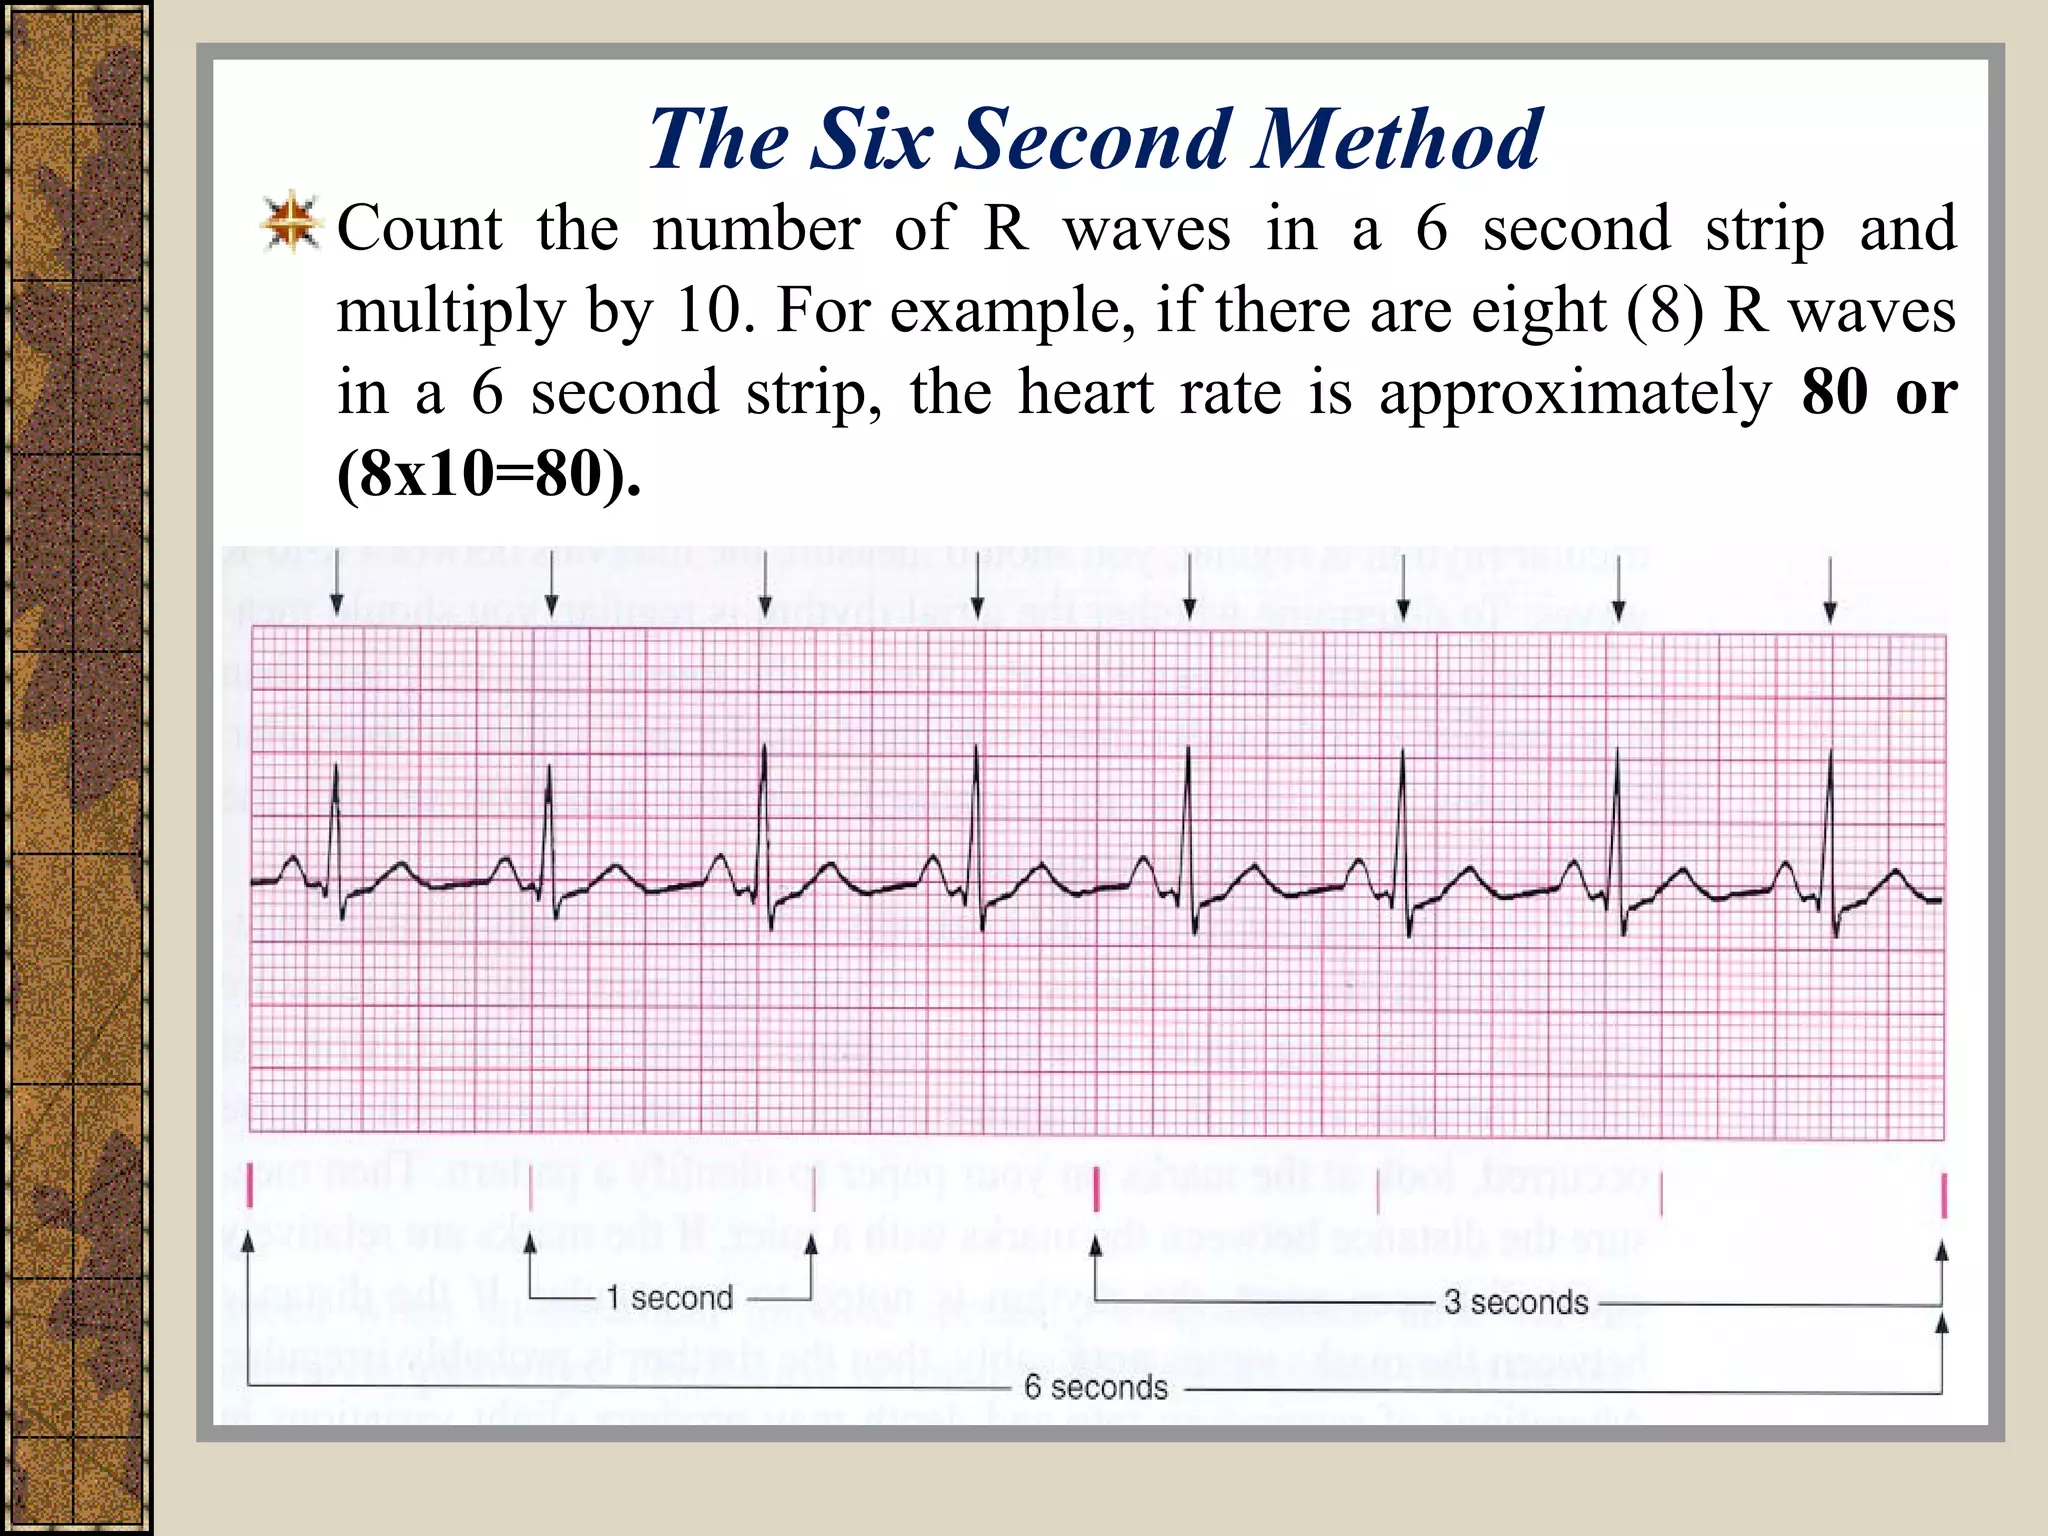
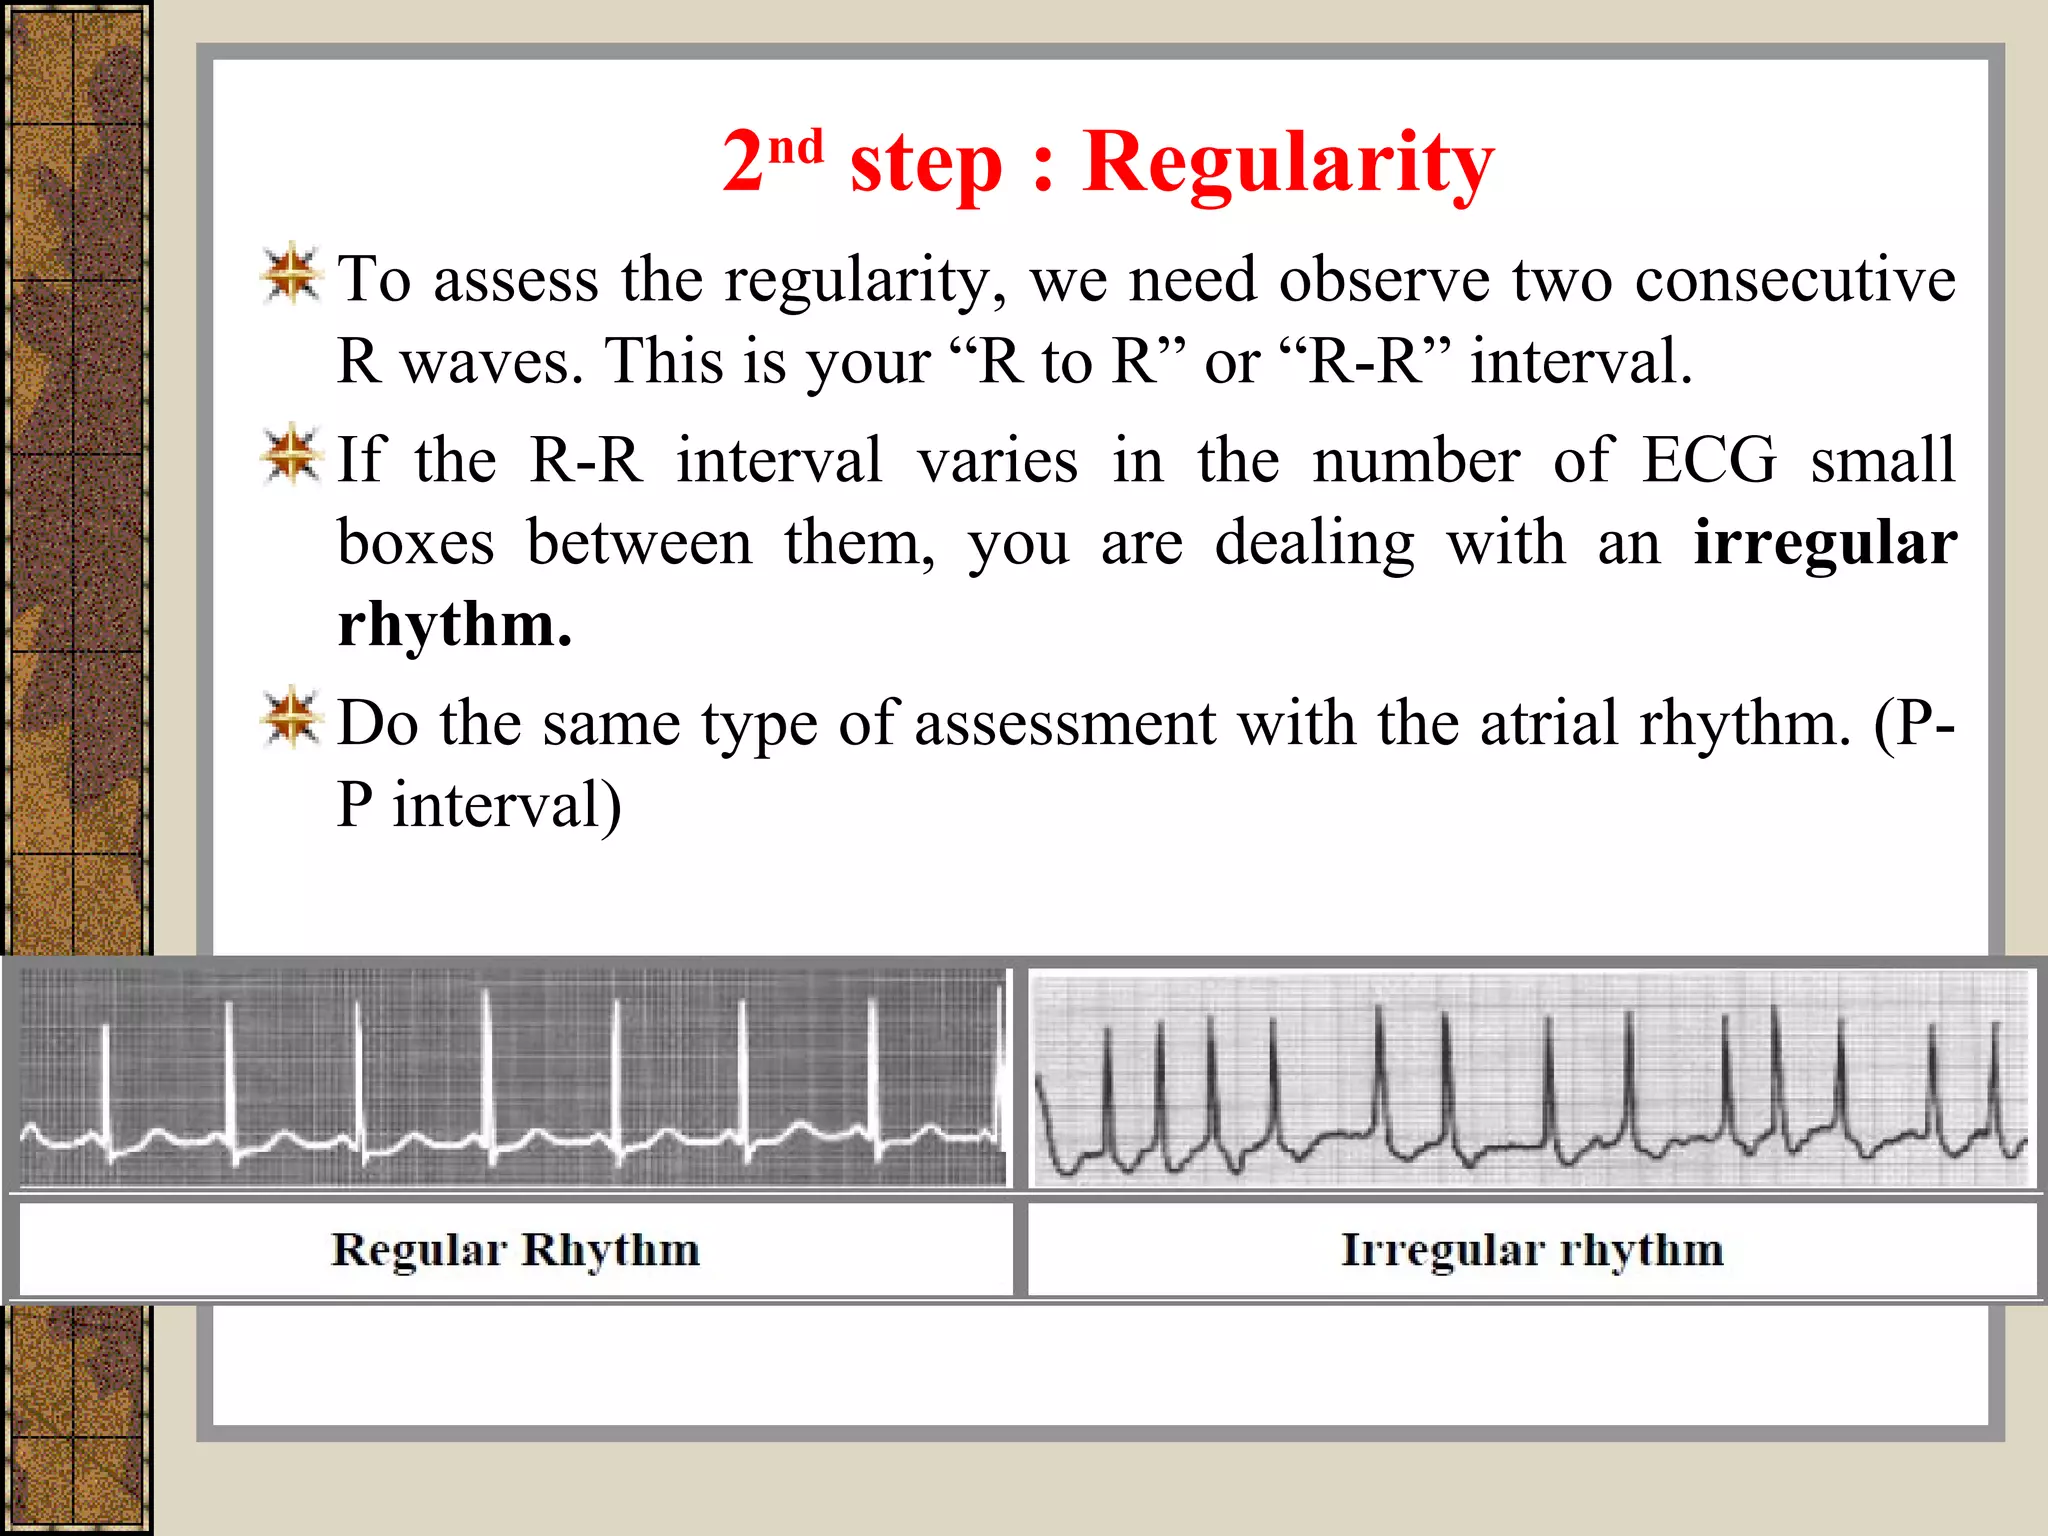
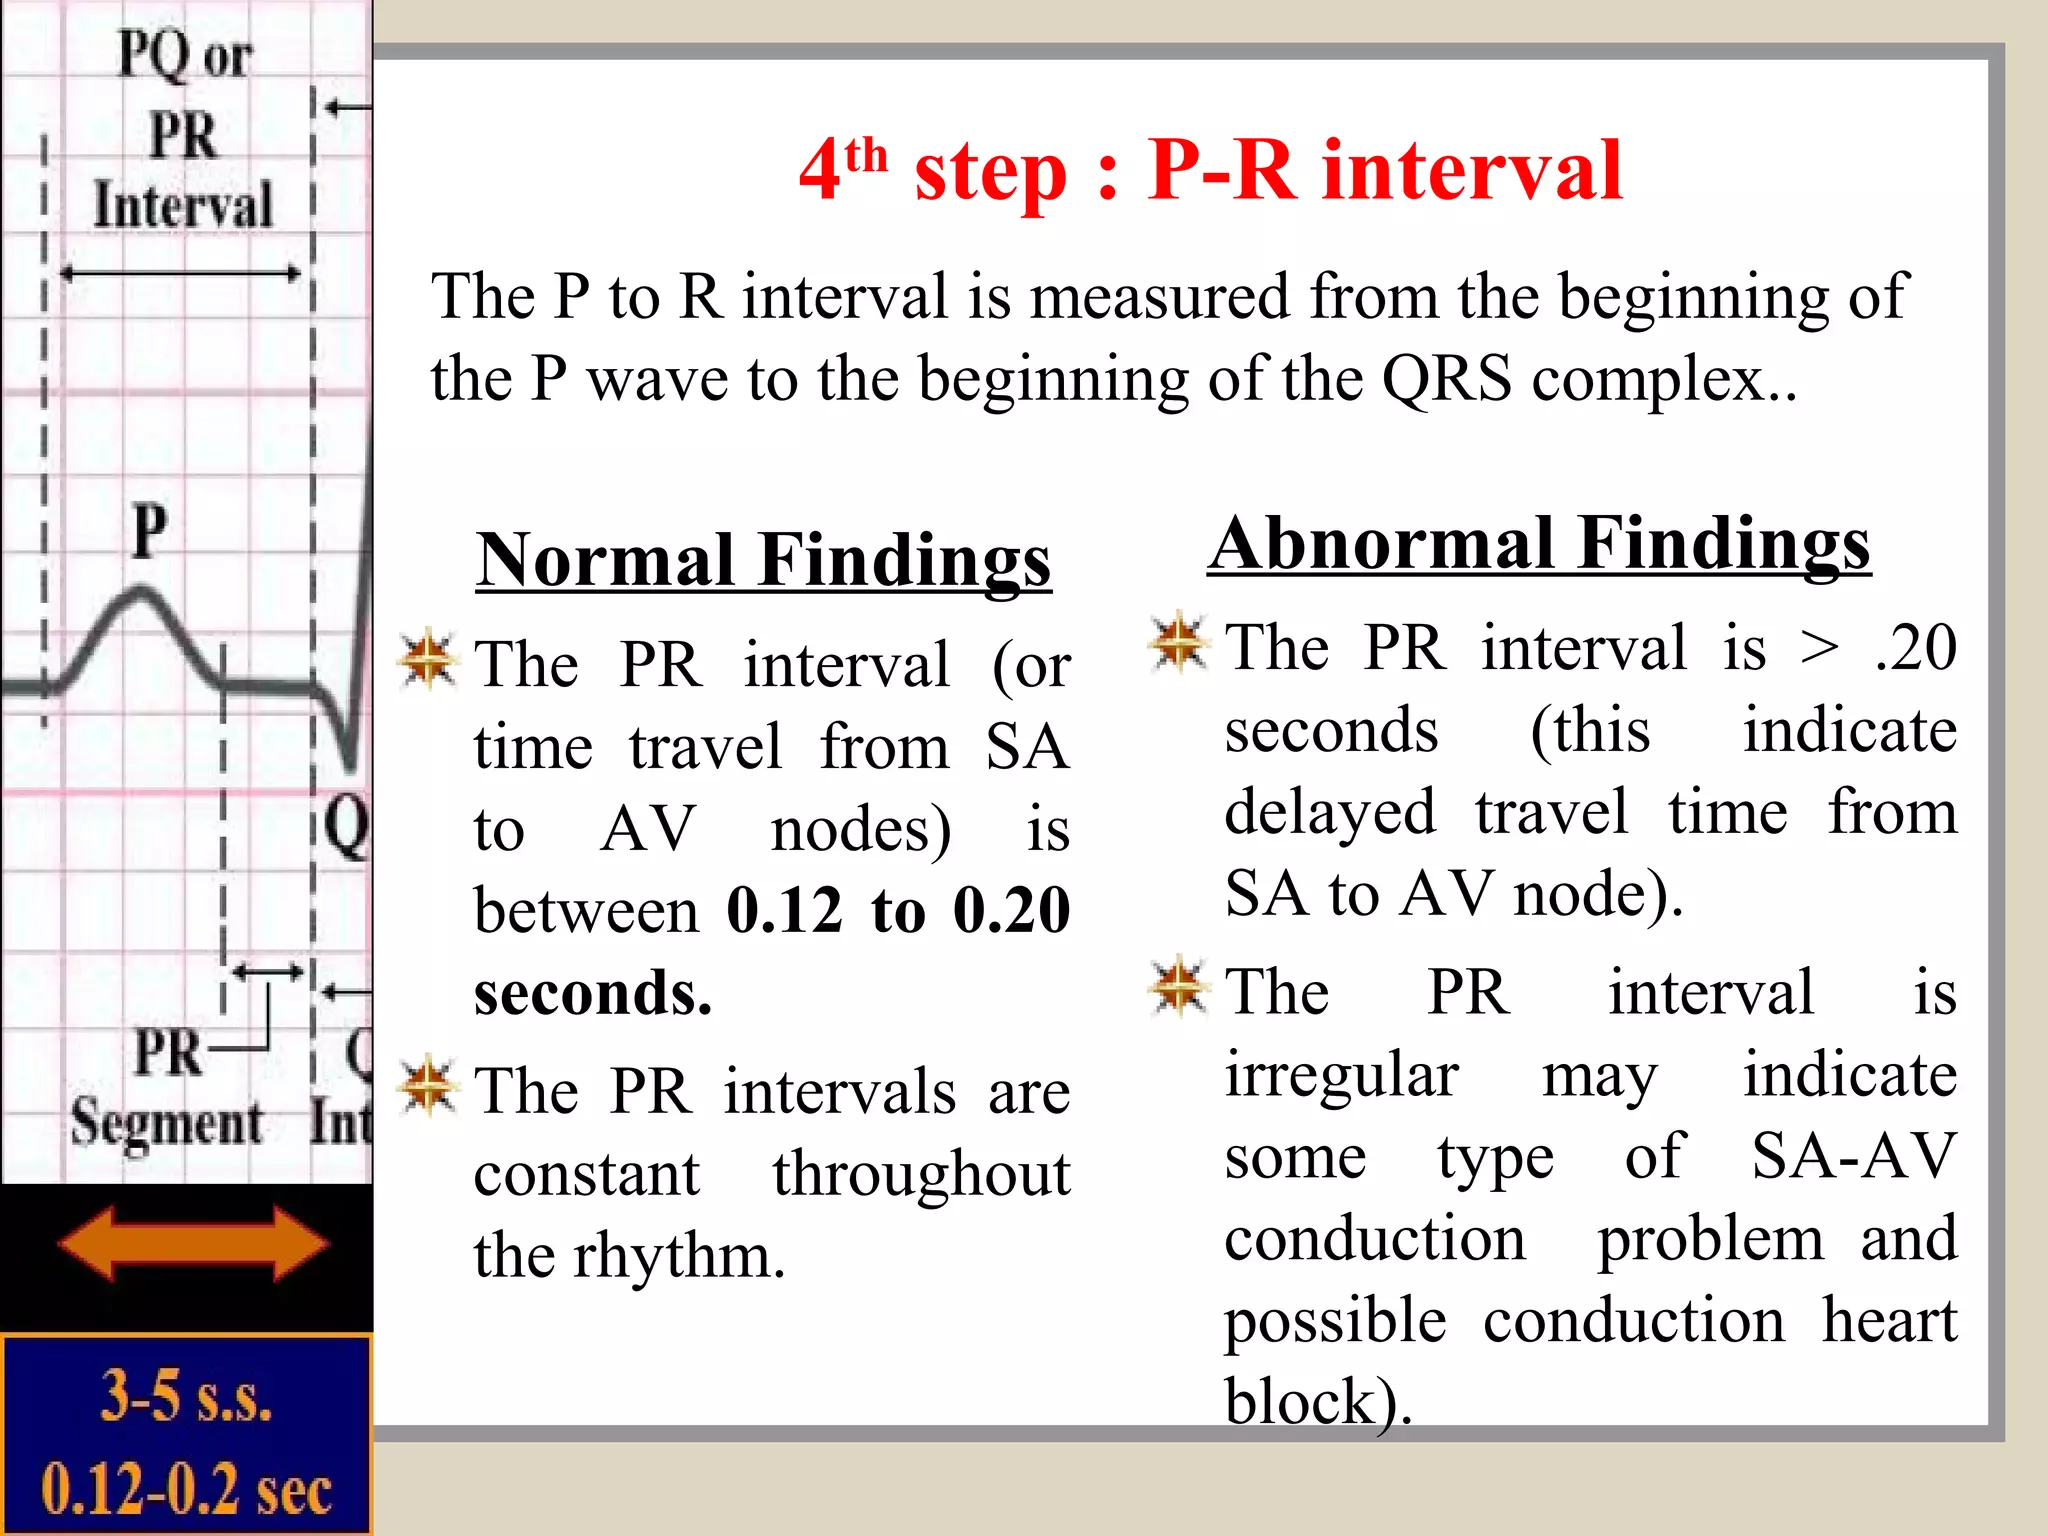
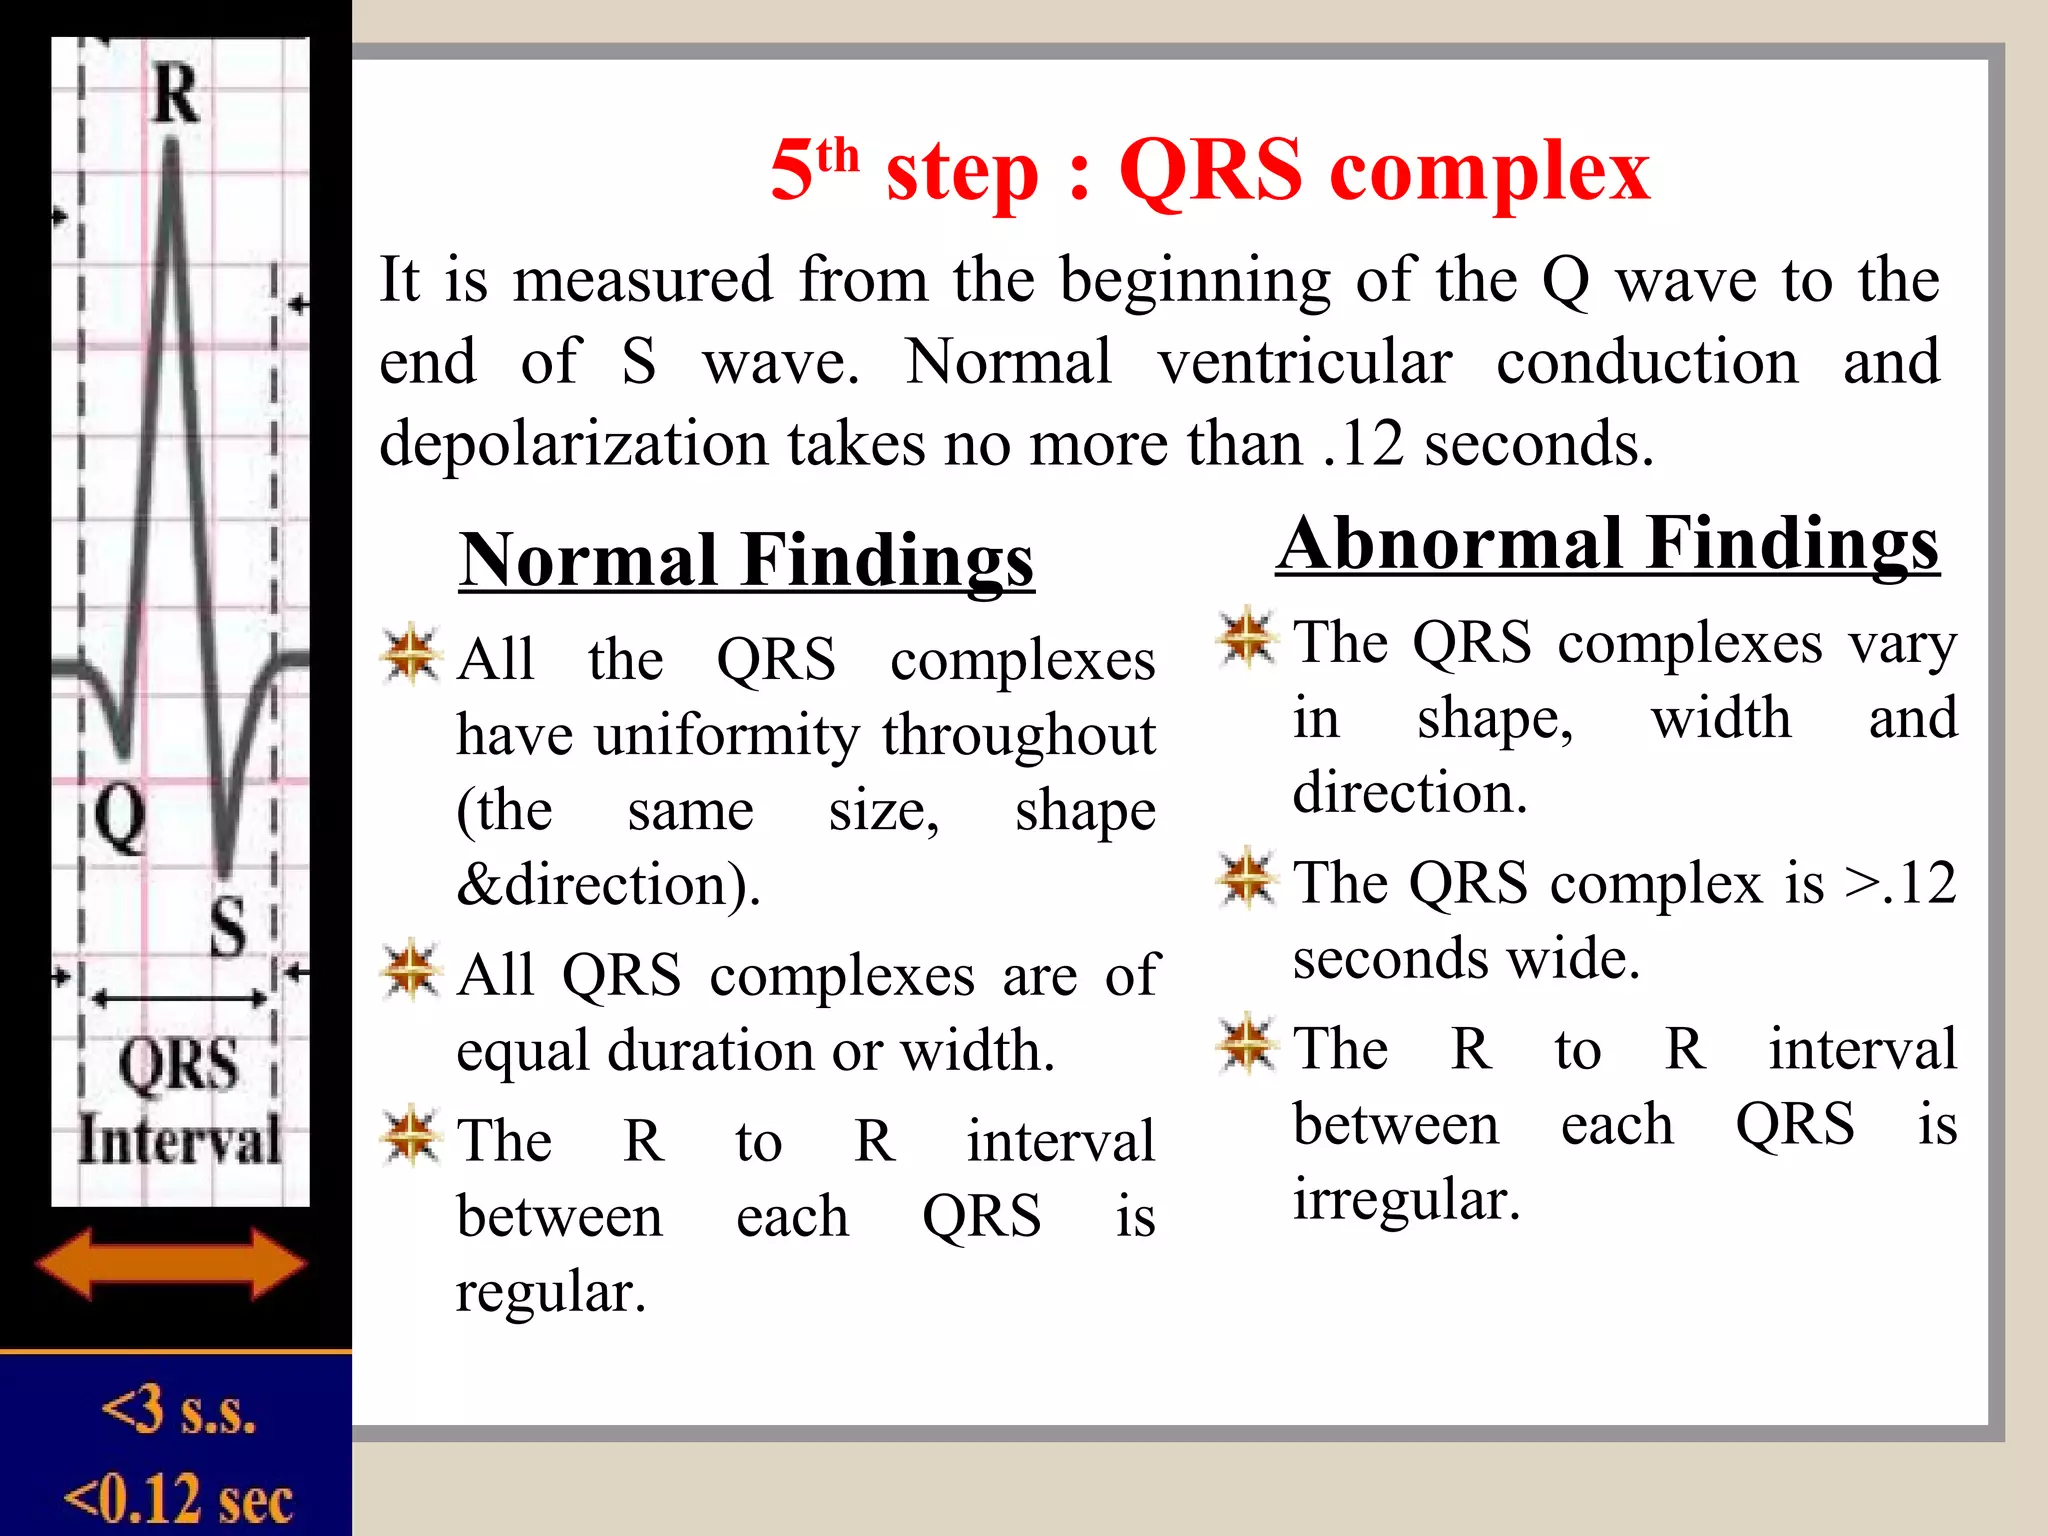
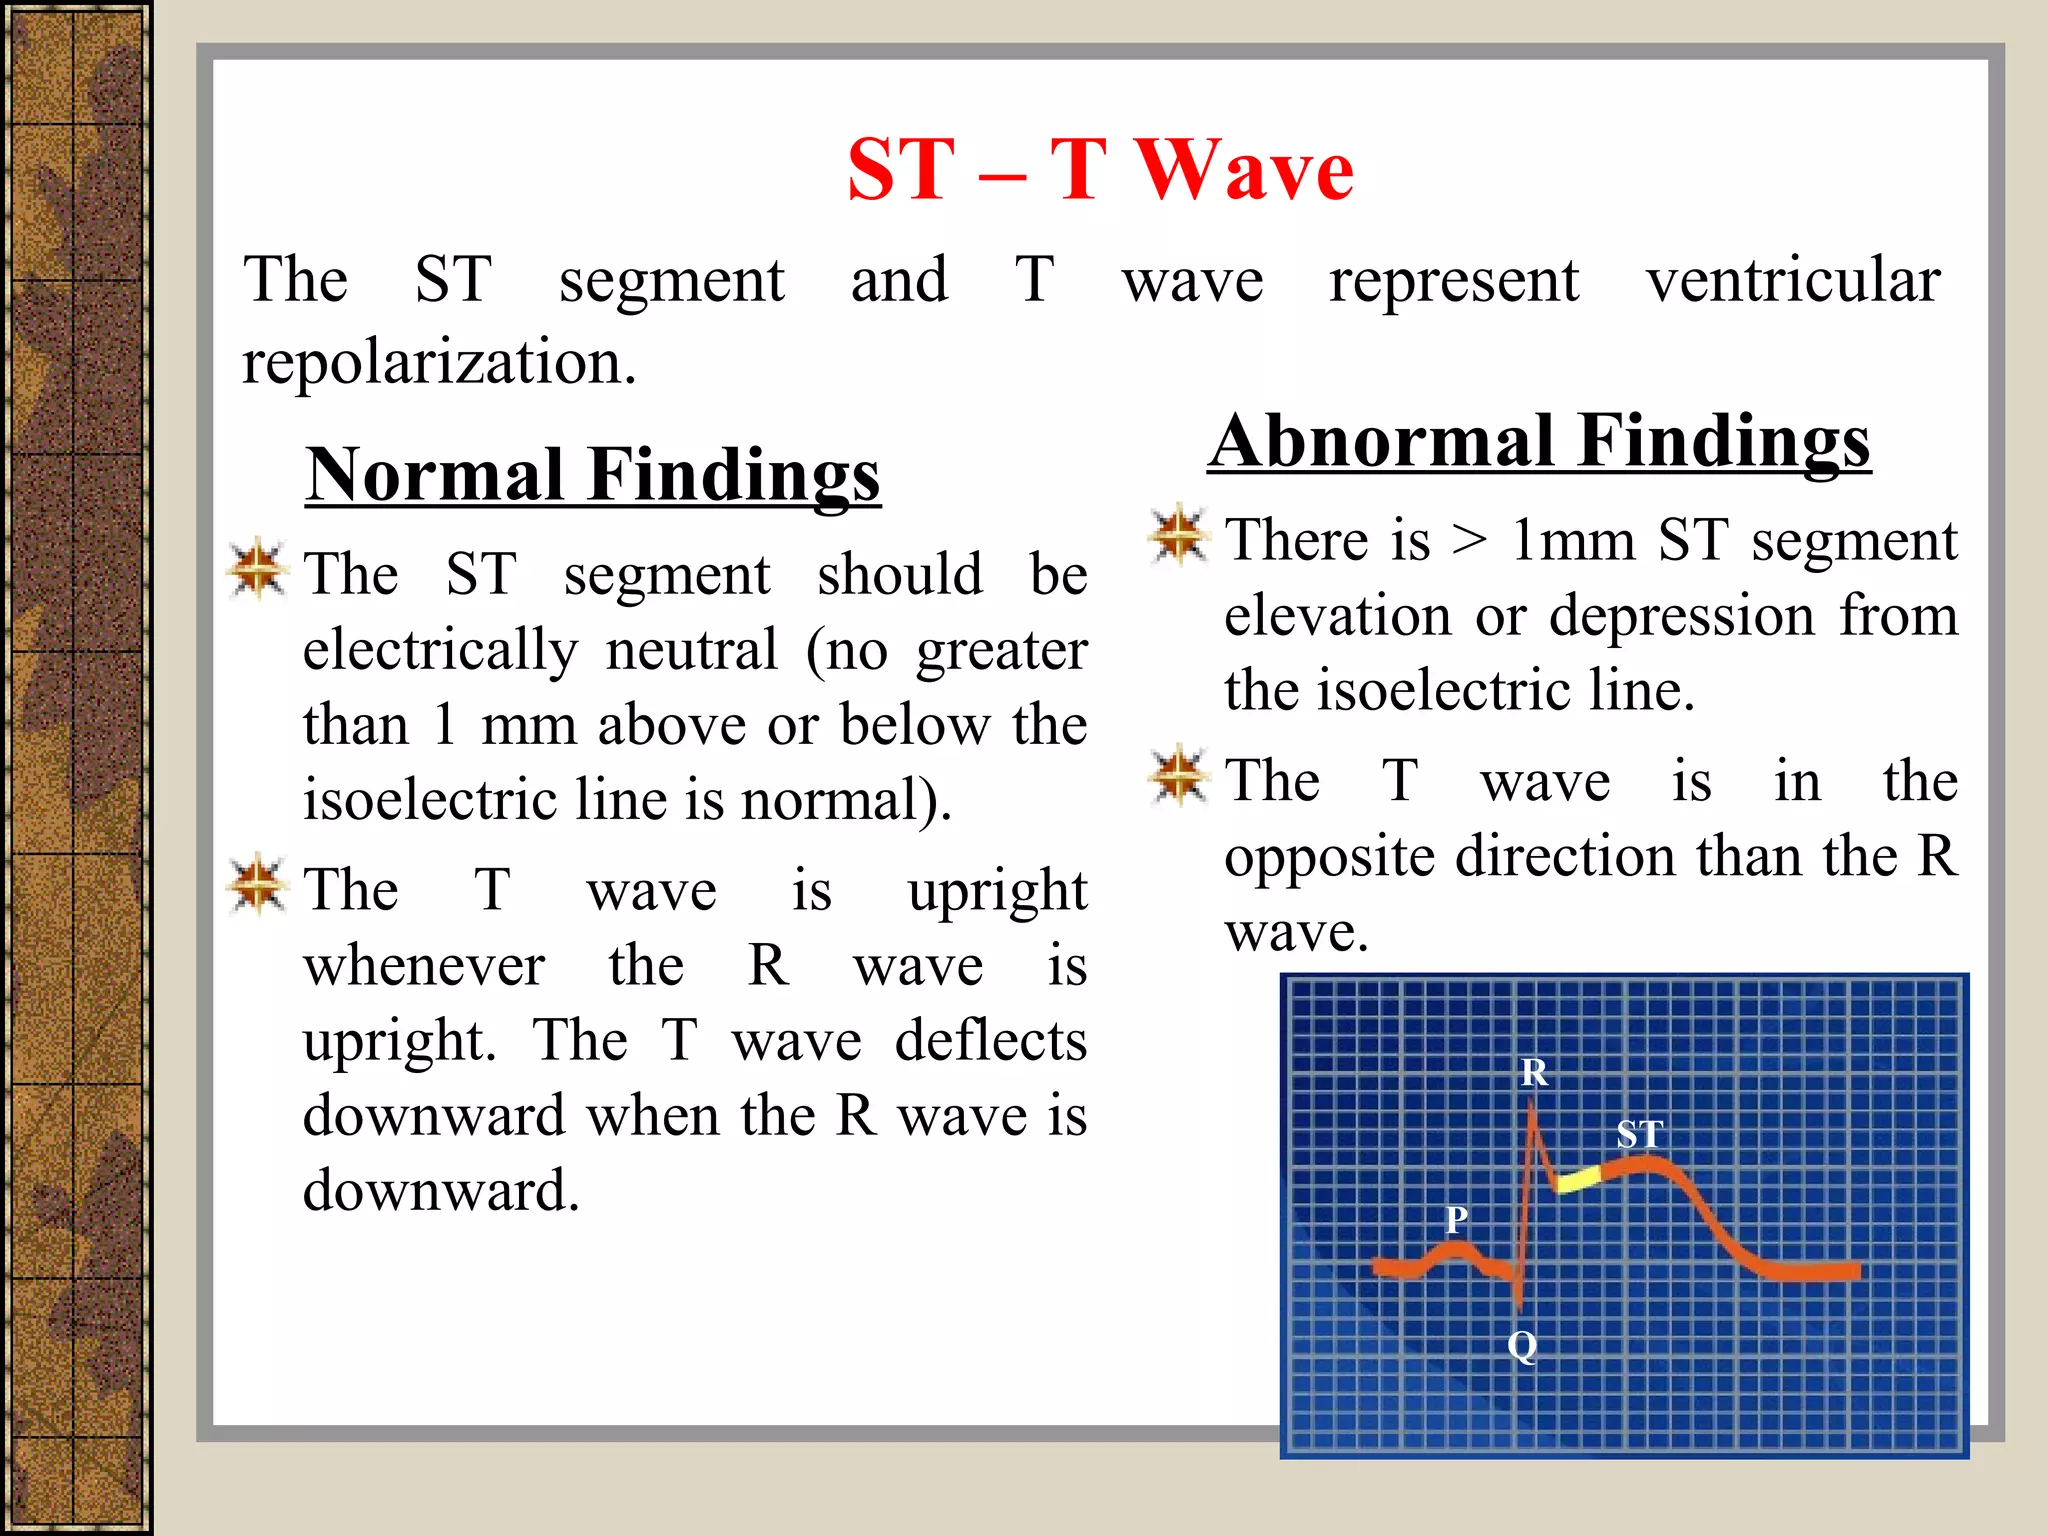
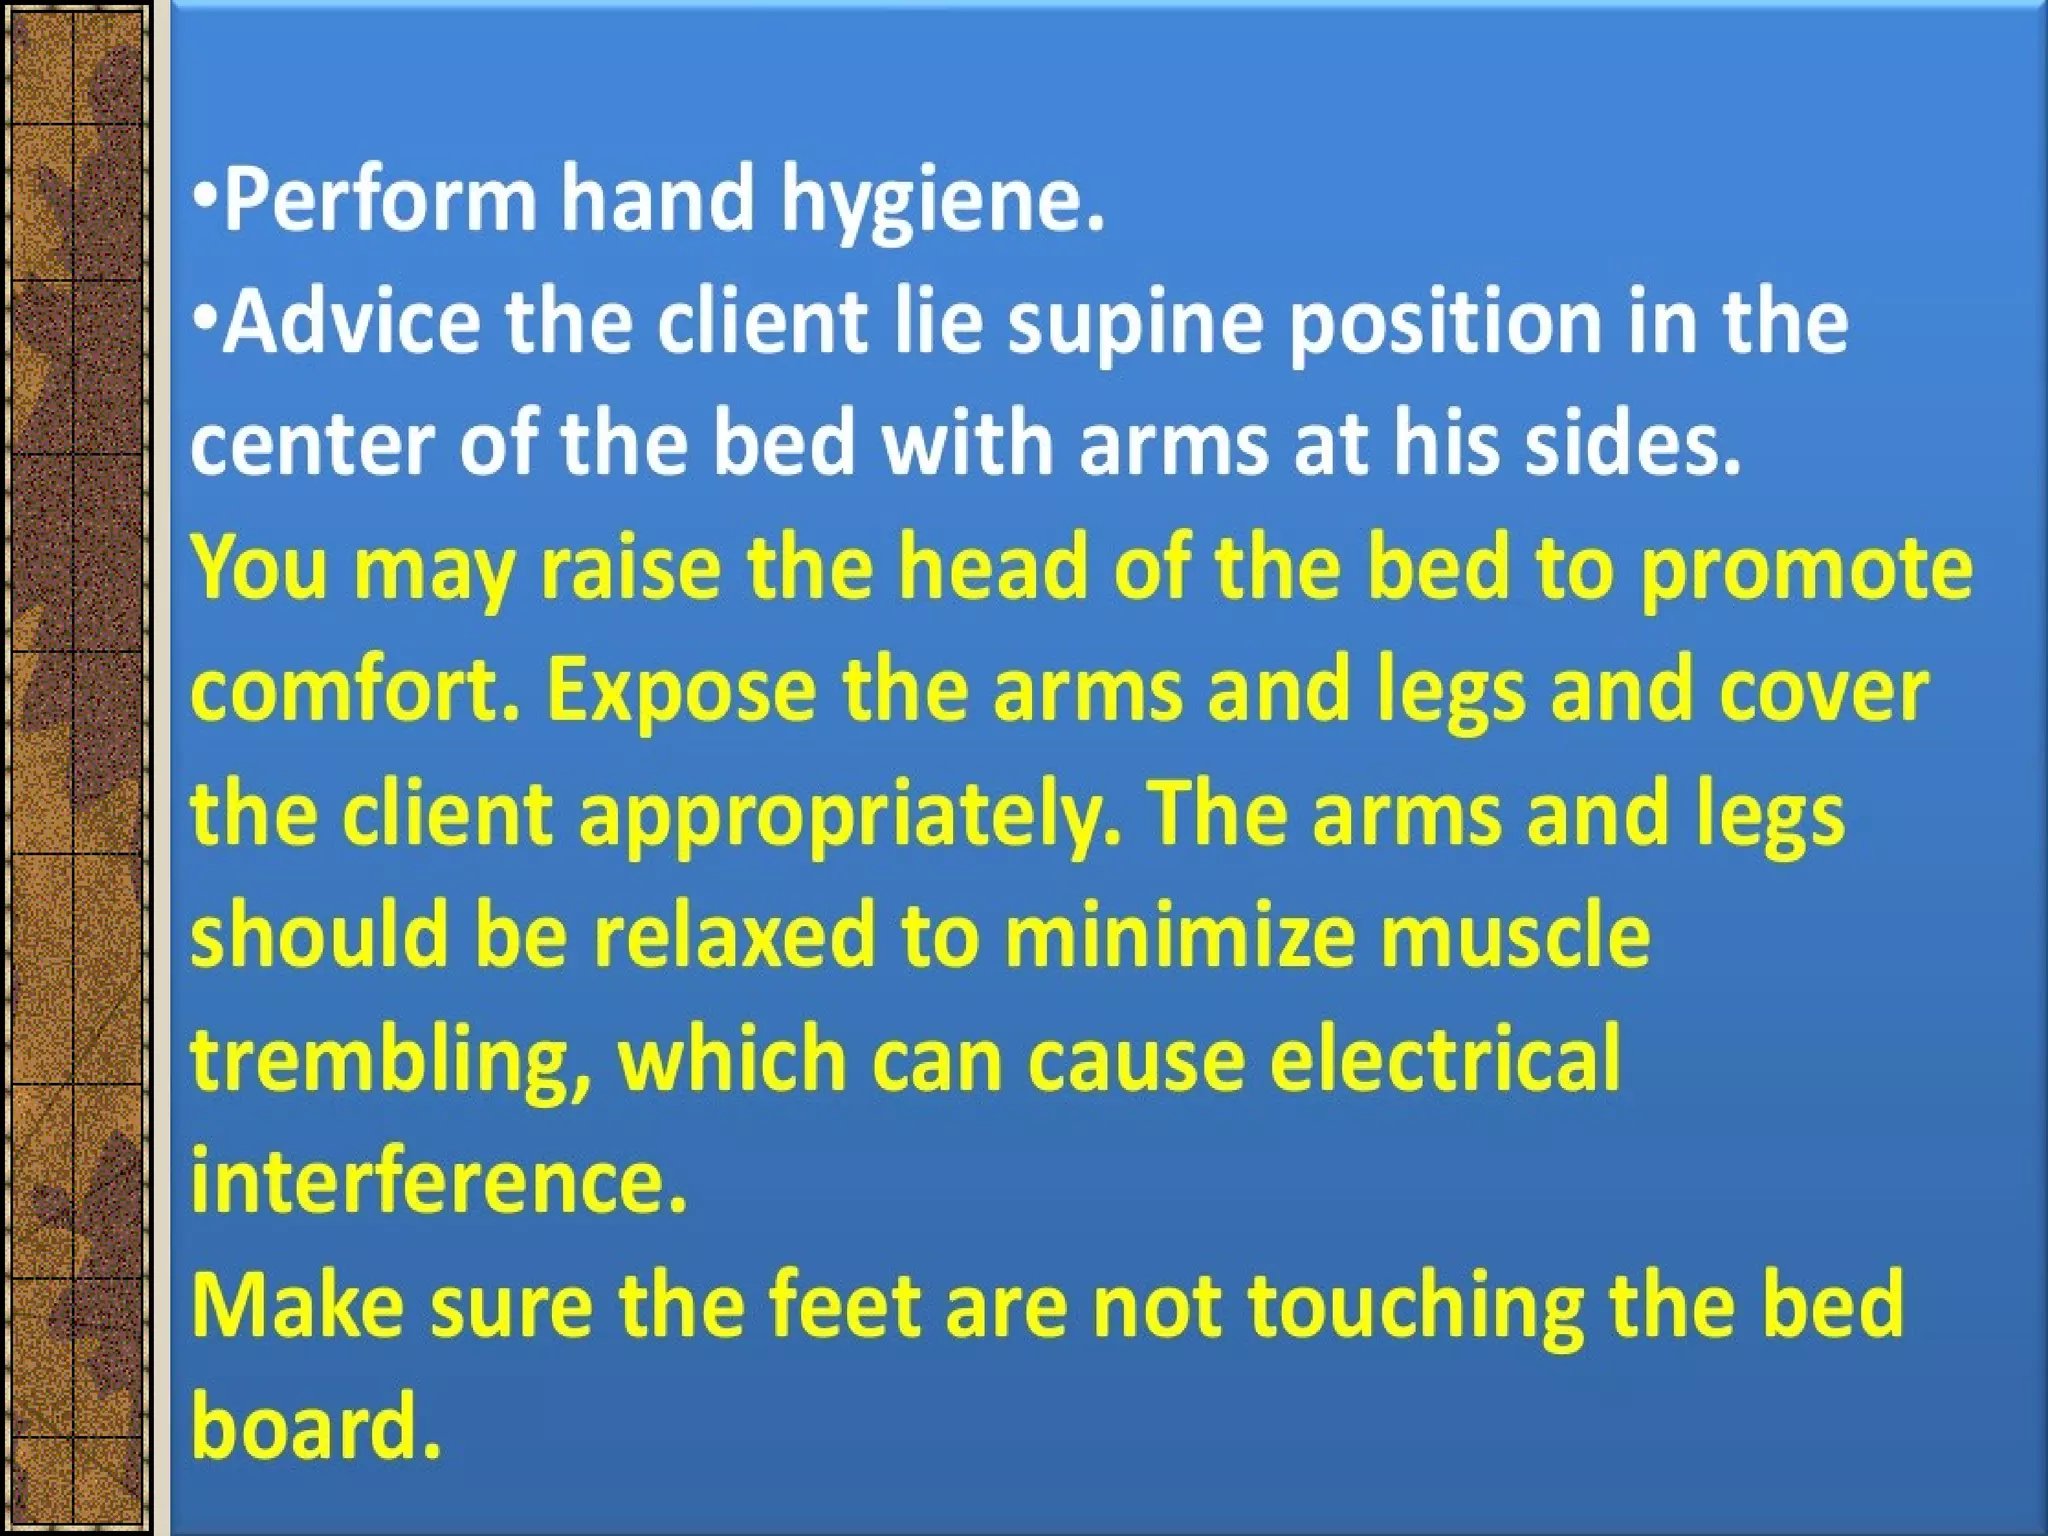
ELECTROCARDIOGRAPHY
NIPIN KALAL
M.Sc. Nursing
Medical surgical nursing
DEFINITION
Defines the graphic representation of the electrical
activity of the heart.
The printed record of the electrical activity of the
heart is called a rhythm strip or an ECG strip.
Depolarization and Repolarization
CONDUCTION SYSTEM
The conduction system
consists of the
Sinoatrial node (SA
node), Atrioventricular
Node (AV node),
Bundle of His (also
called the AV
Junction), Right and
Left Bundle Branches,
and Purkinje Fibers.
Electrodes
The ECG records the electrical activity of the
heart by using skin sensors called electrodes.
Electrodes are adhesive pads that contain a
conductive gel and are attached to the patient’s
skin.
Leads
A lead is a record of electrical activity between
two electrodes.
ECG Deflections: Isoelectric, Upright, Negative,
and Biphasic
Isoelectric Line
Each waveform produced is related to a specific
electrical event within the heart. When electrical
activity is not detected, a straight line is recorded.
This is called the electrical baseline or isoelectric
line.
Upright Deflections
A basic rule of electrocardiology refers to the flow
of electricity through the heart and out to the skin
electrodes. The rule states that if the electricity
flows toward the positive electrode, the patterns
produced on the graph paper will be upright.
Negative Deflections
Based on the above principle, when the flow if
electricity through the heart is away from a
positive electrode, it produces a negative
deflection on the ECG.
Biphasic Deflections
When some of the electricity or conduction
current is traveling toward and some travels away
from the positive electrode, the ECG recording
will have a QRS complex, which are both up and
down. This is called a biphasic waveform.
Chest lead placement
ECG paper
The ECG paper is graph paper that is made up of
small and larger, heavy-lined squares.
The smallest squares are one millimeter wide and
one millimeter high. There are five small squares
between the heavier lines.
ECG waveforms
The tracing recorded from the electrical activity of the
heart forms a series of waves and complexes that have
been labelled (in alphabetical order) the P, Q, R, S, and T
waves. These waves or deflections occur in regularly
occurring intervals in the healthy individual.
“P” wave
SA node fires, sends the
electrical impulse
outward to stimulate both
atria an manifests as a P
wave.
Approximately 0.10
seconds in length.
The P wave is indicative
of atrial depolarization.
“P-R interval” wave
When the impulse leaves the atria and travels to the AV
node, it encounters a slight delay. The tissues of the node
do not conduct impulses as fast as the other cardiac
electrical tissues. This means that the wave of
depolarization will take a longer time to get through the
AV node. On the ECG, this is represented by a short
period of electrical inactivity called the PR interval
(PRI).
The PR interval extends from the beginning of the P wave
to the onset of the QRS complex.
A normal PR Interval is less than
or equals 0.20 sec.
QRS Complex
The ventricular depolarization is shown on the ECG by a
large complex of three waves: the Q, the R, and the S
waves.
Impulse pass from the Bundle of HIS throughout the
ventricular muscles.
Normal measures less than 0.12 seconds or less than 3
small squares on the ECG paper
ST segment
The ST segment begins at the end of the S complex and
ends with the onset of the T wave.
The ST segment normally sits on the baseline or isoelectric
line.
Greater than 1 mm ST segment elevation or depression can
be indicative of myocardial ischemia or injury.
“T” wave
Ventricular repolarization is represented on the ECG by a
T wave. The beginning of the T wave is identified at the
point where the slope of the ST segment appears to
become abruptly or gradually steeper. The T wave ends
when it returns to the isoelectric baseline.
FORMAT FOR ECG INTERPRETATION
1st
step : Heart rate calculation
There are numerous methods and formulas, which
can be used to calculate a heart rate from the ECG.
Three methods for heart rate calculation
1. The Six Second Method
2. Large Box Method
3. Small Box Method
The Six Second Method
Count the number of R waves in a 6 second strip and
multiply by 10. For example, if there are eight (8) R waves
in a 6 second strip, the heart rate is approximately 80 or
(8x10=80).
Large Box Method
Count the number of large squares between two
consecutive R waves. Divide this number into 300 for a
ventricular rate. For example, if there are four large
squares between regular QRS complexes, the heart rate is
75 (300/4=75).
For an atrial rate, count the number of large boxes between
two consecutive P waves and also divide into 300.
Small Box Method
To calculate the heart rate (ventricle) count the number of
small boxes between two consecutive R waves and divide
by 1500. To calculate the atrial rate, count the number of
large boxes between two consecutive P waves and divide
by 1500. Eg : 1500/20 = 75
2nd
step : Regularity
To assess the regularity, we need observe two consecutive
R waves. This is your “R to R” or “R-R” interval.
If the R-R interval varies in the number of ECG small
boxes between them, you are dealing with an irregular
rhythm.
Do the same type of assessment with the atrial rhythm. (P-
P interval)
3rd
step : P wave examination
Normal Findings
P waves should be regular
P waves have a
symmetrical shape
P waves should all look
alike (uniform)
There should be one P for
every QRS
Abnormal Findings
A “P” wave is not
followed by a QRS
complex.
There are more P waves
than QRS complexes.
First, you find the P waves. Once you have identified them,
assess their characteristics.
4th
step : P-R interval
Normal Findings
The PR interval (or
time travel from SA
to AV nodes) is
between 0.12 to 0.20
seconds.
The PR intervals are
constant throughout
the rhythm.
Abnormal Findings
The PR interval is > .20
seconds (this indicate
delayed travel time from
SA to AV node).
The PR interval is
irregular may indicate
some type of SA-AV
conduction problem and
possible conduction heart
block).
The P to R interval is measured from the beginning of
the P wave to the beginning of the QRS complex..
5th
step : QRS complex
Normal Findings
All the QRS complexes
have uniformity throughout
(the same size, shape
&direction).
All QRS complexes are of
equal duration or width.
The R to R interval
between each QRS is
regular.
Abnormal Findings
The QRS complexes vary
in shape, width and
direction.
The QRS complex is >.12
seconds wide.
The R to R interval
between each QRS is
irregular.
It is measured from the beginning of the Q wave to the
end of S wave. Normal ventricular conduction and
depolarization takes no more than .12 seconds.
ST – T Wave
Normal Findings
The ST segment should be
electrically neutral (no greater
than 1 mm above or below the
isoelectric line is normal).
The T wave is upright
whenever the R wave is
upright. The T wave deflects
downward when the R wave is
downward.
Abnormal Findings
There is > 1mm ST segment
elevation or depression from
the isoelectric line.
The T wave is in the
opposite direction than the R
wave.
The ST segment and T wave represent ventricular
repolarization.
R
P
Q
ST
6th
step : Rhythm Interpretation
After completing Step 5, you are ready to make an
educated decision on naming the correct rhythm.
Remember to correlate information obtained in
Steps 1-5 along with your understanding of the
heart’s electrophysiology.
Nurses responsibility
Ecg for Nurses...
Ecg for Nurses...
Ecg for Nurses...
Ecg for Nurses...
Ecg for Nurses...

Ecg for Nurses...

  • 1.
  • 2.
    DEFINITION Defines the graphicrepresentation of the electrical activity of the heart. The printed record of the electrical activity of the heart is called a rhythm strip or an ECG strip.
  • 3.
  • 4.
    CONDUCTION SYSTEM The conductionsystem consists of the Sinoatrial node (SA node), Atrioventricular Node (AV node), Bundle of His (also called the AV Junction), Right and Left Bundle Branches, and Purkinje Fibers.
  • 5.
    Electrodes The ECG recordsthe electrical activity of the heart by using skin sensors called electrodes. Electrodes are adhesive pads that contain a conductive gel and are attached to the patient’s skin. Leads A lead is a record of electrical activity between two electrodes.
  • 6.
    ECG Deflections: Isoelectric,Upright, Negative, and Biphasic Isoelectric Line Each waveform produced is related to a specific electrical event within the heart. When electrical activity is not detected, a straight line is recorded. This is called the electrical baseline or isoelectric line.
  • 7.
    Upright Deflections A basicrule of electrocardiology refers to the flow of electricity through the heart and out to the skin electrodes. The rule states that if the electricity flows toward the positive electrode, the patterns produced on the graph paper will be upright.
  • 8.
    Negative Deflections Based onthe above principle, when the flow if electricity through the heart is away from a positive electrode, it produces a negative deflection on the ECG.
  • 9.
    Biphasic Deflections When someof the electricity or conduction current is traveling toward and some travels away from the positive electrode, the ECG recording will have a QRS complex, which are both up and down. This is called a biphasic waveform.
  • 10.
  • 13.
    ECG paper The ECGpaper is graph paper that is made up of small and larger, heavy-lined squares. The smallest squares are one millimeter wide and one millimeter high. There are five small squares between the heavier lines.
  • 14.
    ECG waveforms The tracingrecorded from the electrical activity of the heart forms a series of waves and complexes that have been labelled (in alphabetical order) the P, Q, R, S, and T waves. These waves or deflections occur in regularly occurring intervals in the healthy individual.
  • 15.
    “P” wave SA nodefires, sends the electrical impulse outward to stimulate both atria an manifests as a P wave. Approximately 0.10 seconds in length. The P wave is indicative of atrial depolarization.
  • 16.
    “P-R interval” wave Whenthe impulse leaves the atria and travels to the AV node, it encounters a slight delay. The tissues of the node do not conduct impulses as fast as the other cardiac electrical tissues. This means that the wave of depolarization will take a longer time to get through the AV node. On the ECG, this is represented by a short period of electrical inactivity called the PR interval (PRI). The PR interval extends from the beginning of the P wave to the onset of the QRS complex. A normal PR Interval is less than or equals 0.20 sec.
  • 17.
    QRS Complex The ventriculardepolarization is shown on the ECG by a large complex of three waves: the Q, the R, and the S waves. Impulse pass from the Bundle of HIS throughout the ventricular muscles. Normal measures less than 0.12 seconds or less than 3 small squares on the ECG paper
  • 18.
    ST segment The STsegment begins at the end of the S complex and ends with the onset of the T wave. The ST segment normally sits on the baseline or isoelectric line. Greater than 1 mm ST segment elevation or depression can be indicative of myocardial ischemia or injury.
  • 19.
    “T” wave Ventricular repolarizationis represented on the ECG by a T wave. The beginning of the T wave is identified at the point where the slope of the ST segment appears to become abruptly or gradually steeper. The T wave ends when it returns to the isoelectric baseline.
  • 20.
    FORMAT FOR ECGINTERPRETATION
  • 21.
    1st step : Heartrate calculation There are numerous methods and formulas, which can be used to calculate a heart rate from the ECG. Three methods for heart rate calculation 1. The Six Second Method 2. Large Box Method 3. Small Box Method
  • 22.
    The Six SecondMethod Count the number of R waves in a 6 second strip and multiply by 10. For example, if there are eight (8) R waves in a 6 second strip, the heart rate is approximately 80 or (8x10=80).
  • 23.
    Large Box Method Countthe number of large squares between two consecutive R waves. Divide this number into 300 for a ventricular rate. For example, if there are four large squares between regular QRS complexes, the heart rate is 75 (300/4=75). For an atrial rate, count the number of large boxes between two consecutive P waves and also divide into 300.
  • 24.
    Small Box Method Tocalculate the heart rate (ventricle) count the number of small boxes between two consecutive R waves and divide by 1500. To calculate the atrial rate, count the number of large boxes between two consecutive P waves and divide by 1500. Eg : 1500/20 = 75
  • 25.
    2nd step : Regularity Toassess the regularity, we need observe two consecutive R waves. This is your “R to R” or “R-R” interval. If the R-R interval varies in the number of ECG small boxes between them, you are dealing with an irregular rhythm. Do the same type of assessment with the atrial rhythm. (P- P interval)
  • 26.
    3rd step : Pwave examination Normal Findings P waves should be regular P waves have a symmetrical shape P waves should all look alike (uniform) There should be one P for every QRS Abnormal Findings A “P” wave is not followed by a QRS complex. There are more P waves than QRS complexes. First, you find the P waves. Once you have identified them, assess their characteristics.
  • 27.
    4th step : P-Rinterval Normal Findings The PR interval (or time travel from SA to AV nodes) is between 0.12 to 0.20 seconds. The PR intervals are constant throughout the rhythm. Abnormal Findings The PR interval is > .20 seconds (this indicate delayed travel time from SA to AV node). The PR interval is irregular may indicate some type of SA-AV conduction problem and possible conduction heart block). The P to R interval is measured from the beginning of the P wave to the beginning of the QRS complex..
  • 28.
    5th step : QRScomplex Normal Findings All the QRS complexes have uniformity throughout (the same size, shape &direction). All QRS complexes are of equal duration or width. The R to R interval between each QRS is regular. Abnormal Findings The QRS complexes vary in shape, width and direction. The QRS complex is >.12 seconds wide. The R to R interval between each QRS is irregular. It is measured from the beginning of the Q wave to the end of S wave. Normal ventricular conduction and depolarization takes no more than .12 seconds.
  • 29.
    ST – TWave Normal Findings The ST segment should be electrically neutral (no greater than 1 mm above or below the isoelectric line is normal). The T wave is upright whenever the R wave is upright. The T wave deflects downward when the R wave is downward. Abnormal Findings There is > 1mm ST segment elevation or depression from the isoelectric line. The T wave is in the opposite direction than the R wave. The ST segment and T wave represent ventricular repolarization. R P Q ST
  • 30.
    6th step : RhythmInterpretation After completing Step 5, you are ready to make an educated decision on naming the correct rhythm. Remember to correlate information obtained in Steps 1-5 along with your understanding of the heart’s electrophysiology.
  • 31.