Download to read offline

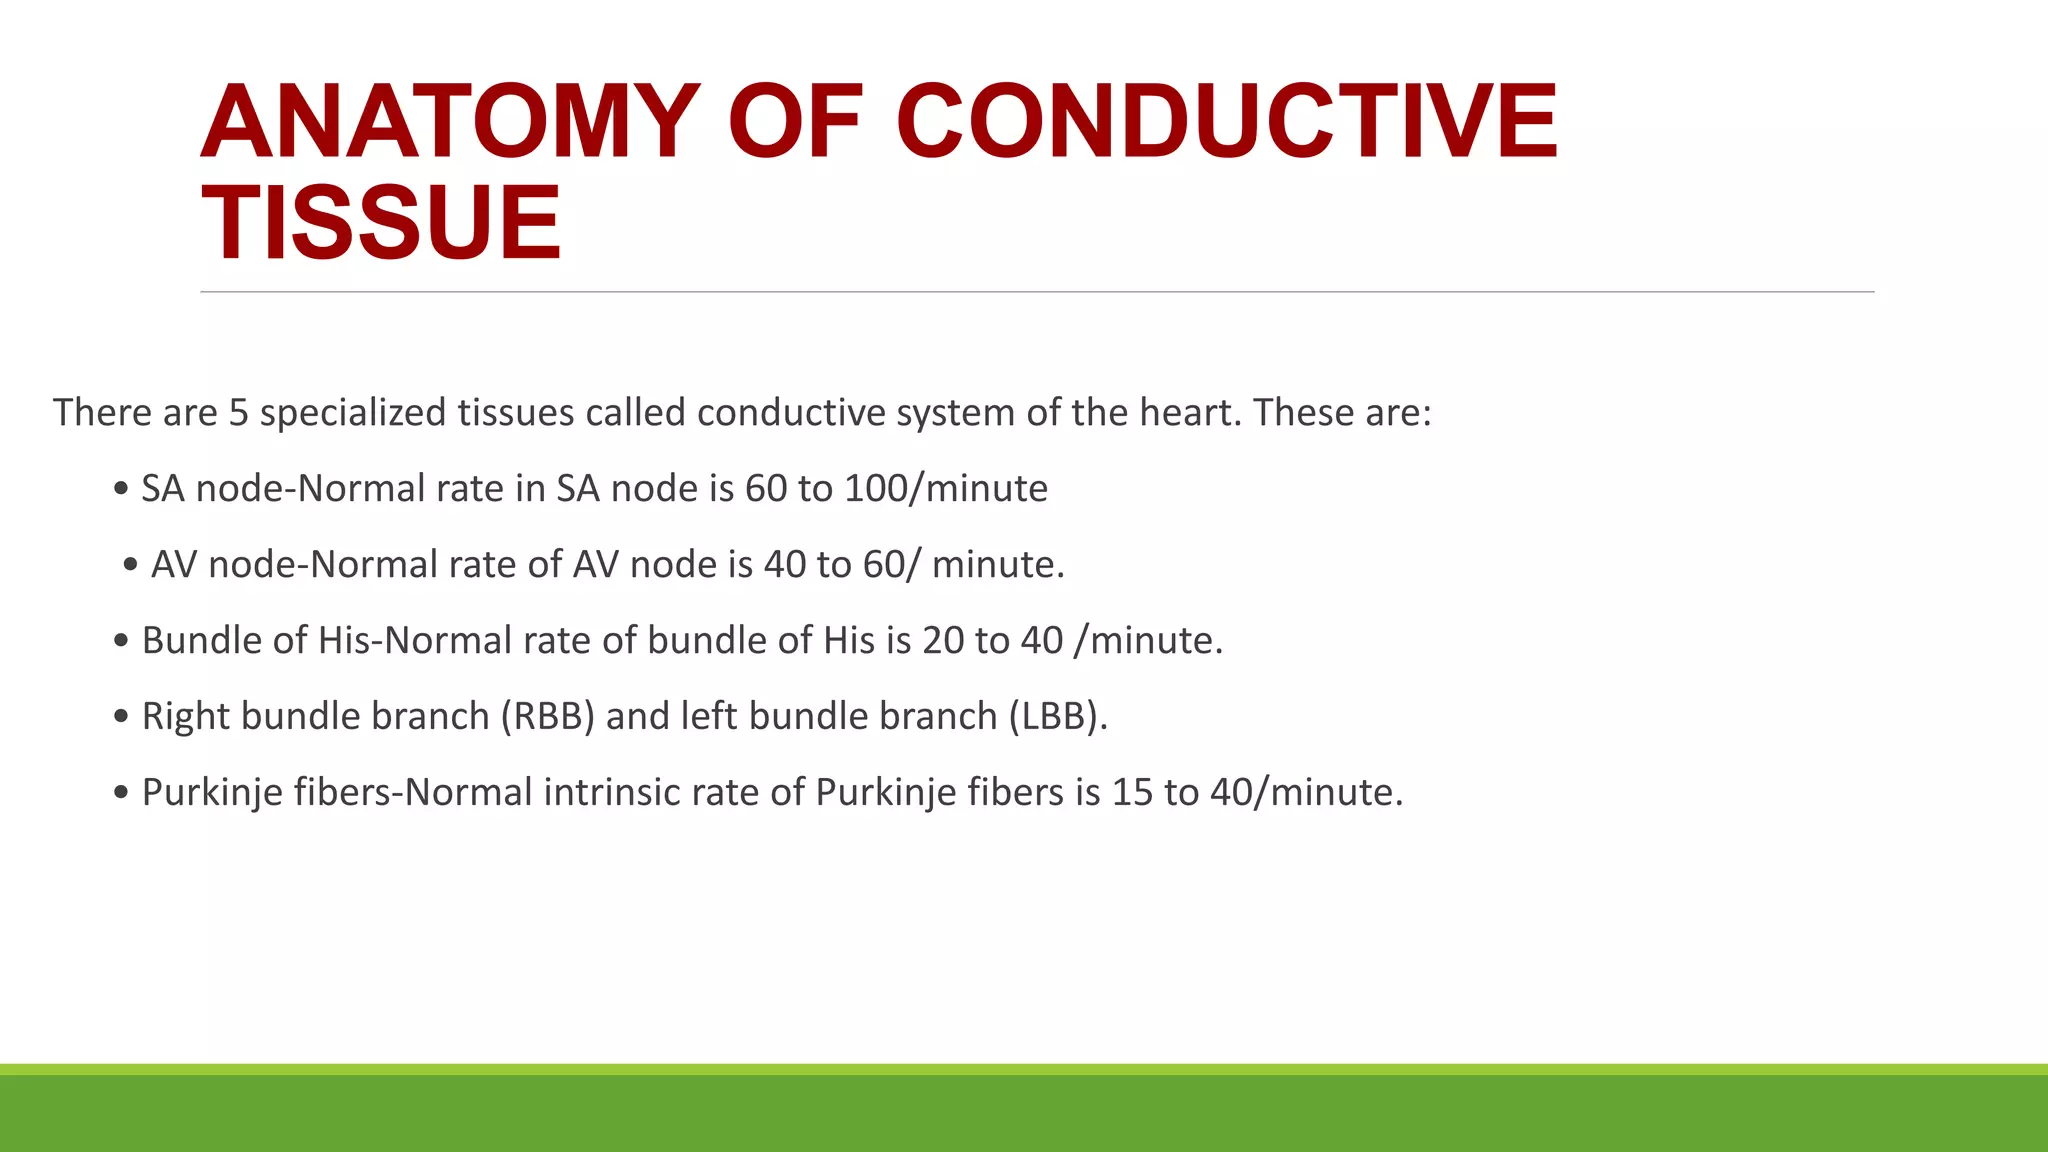


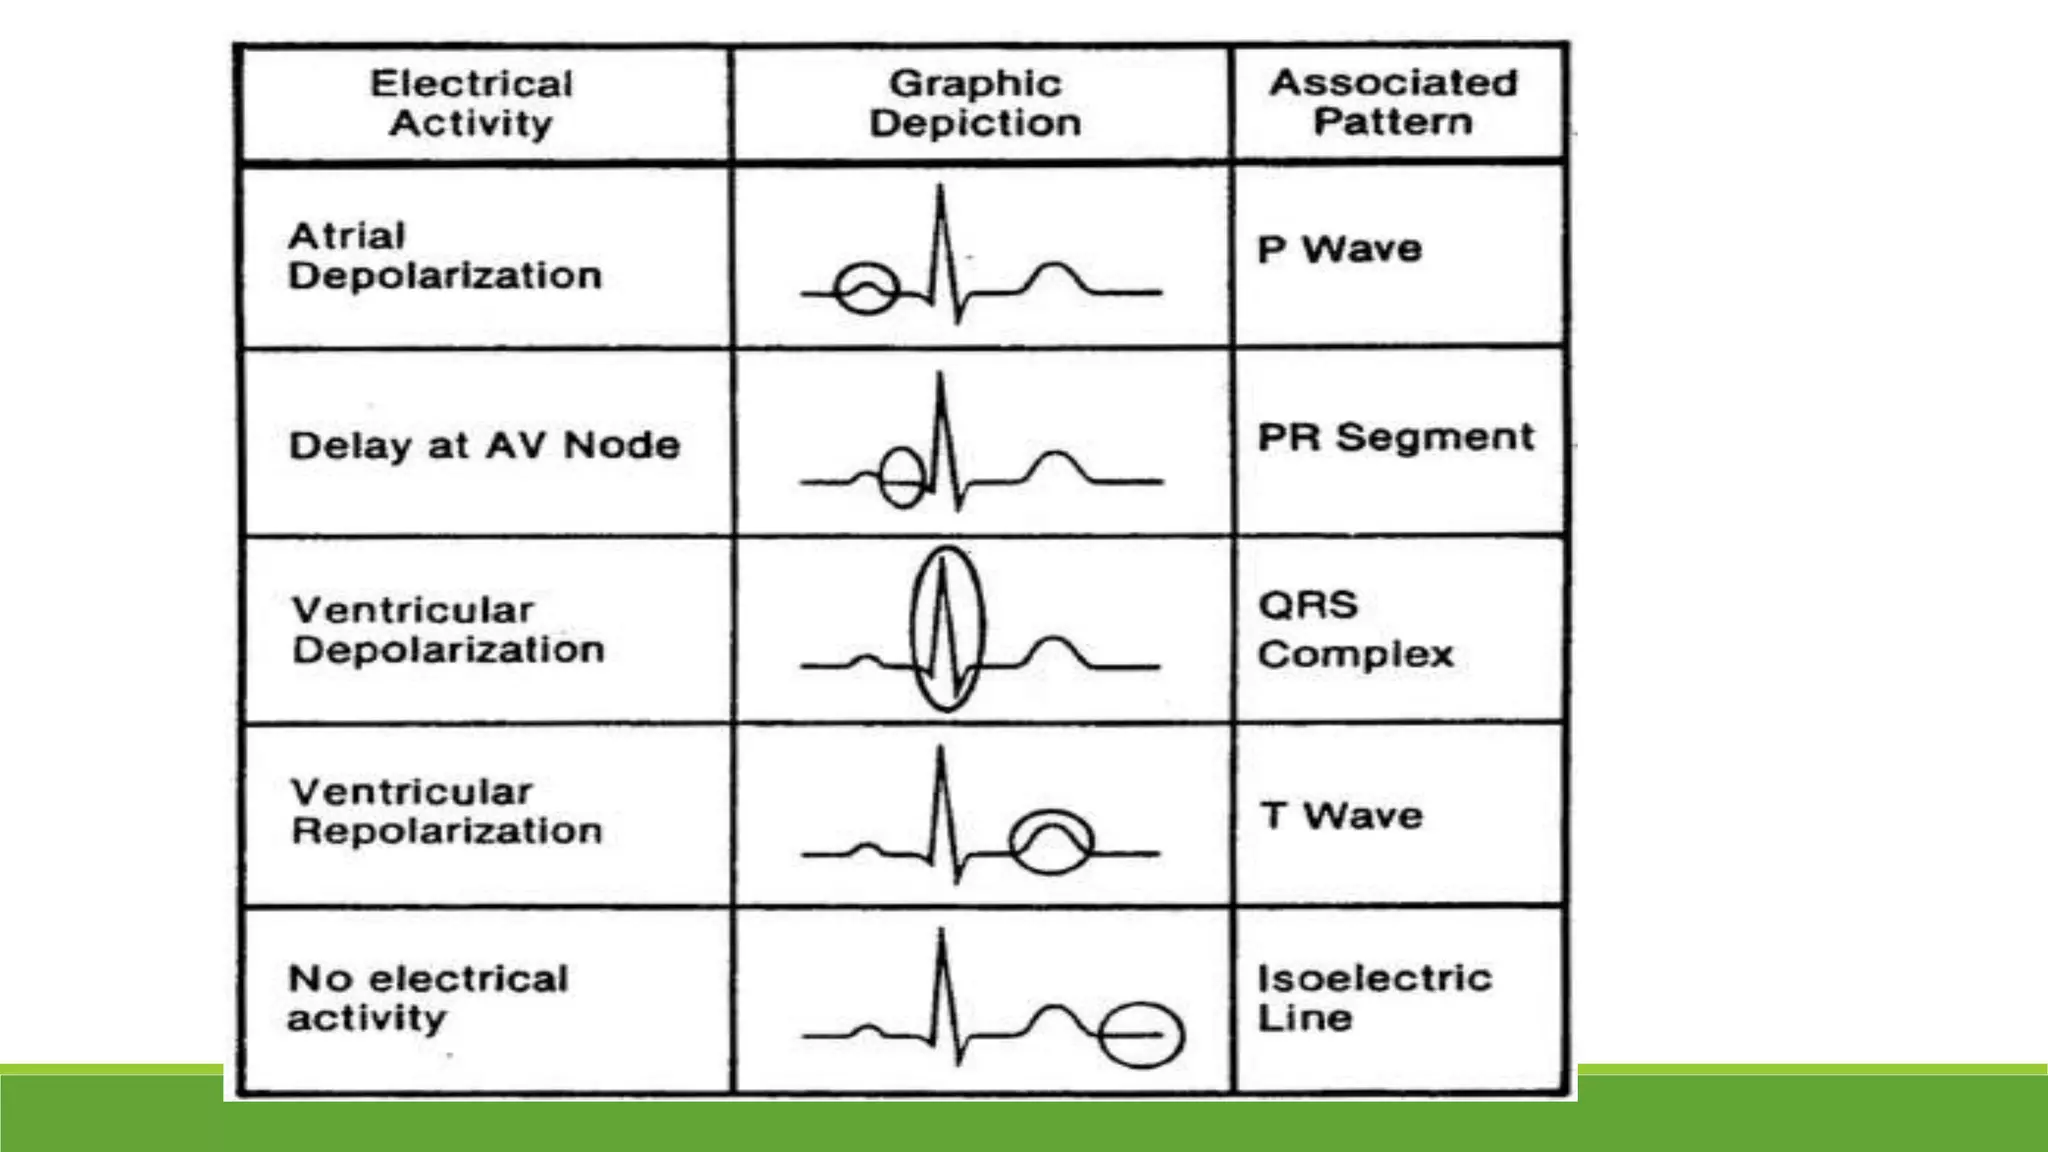


The document provides information about the anatomy and function of the conductive system of the heart and describes the components of a normal electrocardiogram (ECG). It discusses the SA node, AV node, bundle of His, and Purkinje fibers that make up the conductive system. It also explains the waves and intervals of the ECG including the P wave, QRS complex, T wave, and ST segment. Common abnormalities are summarized such as tall or inverted P waves, prolonged PR interval, pathological Q waves, and abnormal R wave progression.


![Shadechapter02.ppt [read only]](https://cdn.slidesharecdn.com/ss_thumbnails/shadechapter02-150421101545-conversion-gate02-thumbnail.jpg?width=640&height=640&fit=bounds)


