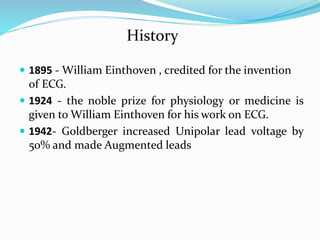
Maj Dr. Neamatullah Ahmed, PBGMS , MBBS, MPH,MCPS.
Electrocardiogram & It’s Interpretetion
OUTLINE
 HISTORY
 INTRODUCTION
 ECG LEADS AND RECORDING
 ECG WAVE FORMS AND INTERVALS
 ECG INTERPRETATION
 ARTIFACTS IN ECG
 NORMAL VARIANTS IN ECG
History
 1895 - William Einthoven , credited for the invention
of ECG.
 1924 - the noble prize for physiology or medicine is
given to William Einthoven for his work on ECG.
 1942- Goldberger increased Unipolar lead voltage by
50% and made Augmented leads
MODERN ECG INSTRUMENT
Introduction
 ECG is defined as graphic recording of electric
potentials generated by the heart.
 Electric currents that spread through the heart are
produced by three components:cardiac pacemaker
cells,specialized conduction tissue & heart muscle
itself.
 ECG however records only the depolarisation &
repolarisation potentials generated by the atrial &
ventricular myocardium.
Recording of ECG
ECG graphs:
– 1 mm squares
– 5 mm squares
Paper Speed:
– 25 mm/sec standard
Voltage Calibration:
– 10 mm/mV standard
ECG Paper: Dimensions
5 mm
1 mm
0.1 mV
0.04 sec
0.2 sec
Time
Voltage
9
 Standard ECG is recorded in 12 leads
 Six Limb leads – L1, L2, L3, aVR, aVL, aVF
 Six Chest Leads – V1 V2 V3 V4 V5 and V6
 aVR, aVL, aVF are called unipolar leads
 aVR – from Right Arm Positive
 aVL – from Left Arm Positive
 aVF – from Left Foot Positive
ECG Unipolar Limb Leads
ECG Leads
Leads are electrodes which measure the difference in
electrical potential between either:
1. Two different points on the body (bipolar leads)
2. One point on the body and a virtual reference
point with zero electrical potential, located in
the center of the heart (unipolar leads)
ECG Leads
The standard ECG has 12 leads: 3 Standard Limb Leads
3 Augmented Limb Leads
6 Precordial Leads
The limb leads record potentials transmitted on to the frontal
plane & chest leads record potentials transmitted on to the
horizontal plane.
The axis of a particular lead represents the viewpoint from
which it looks at the heart.
Summary of Leads
Limb Leads Precordial Leads
Bipolar I, II, III
(standard limb leads)
-
Unipolar AVR, AVL, AVF
(augmented limb leads)
V1-V6
Localising the arterial territory
Inferior
II, III, AVF
Lateral
I, AVL,
V5-V6
Anterior /
Septal
V1-V4
Standard Limb Leads
Precordial Leads
16
Precardial (chest) Lead Position
 V1 Fourth ICS, right sternal border
 V2 Fourth ICS, left sternal border
 V3 Equidistant between V2 and V4
 V4 Fifth ICS, left Mid clavicular Line
 V5 Fifth ICS Left anterior axillary
line
 V6 Fifth ICS Left mid axillary line
ECG Chest Leads
18
ECG Graph Paper
X- Axis time in seconds
Y-
Axis
Amplitude
in
mill
volts
19
19
 X-Axis represents time - Scale X-Axis – 1 mm = 0.04
sec
 Y-Axis represents voltage - Scale Y-Axis – 1 mm = 0.1
mV
 One big square on X-Axis = 0.2 sec (big box)
 Two big squares on Y-Axis = 1 milli volt (mV)
 Each small square is 0.04 sec (1 mm in size)
 Each big square on the ECG represents 5 small
squares
= 0.04 x 5 = 0.2 seconds
 5 such big squares = 0.2 x 5 = 1sec = 25 mm
 One second is 25 mm or 5 big squares
 One minute is 5 x 60 = 300 big squares
ECG Graph Paper
ECG Wave forms & Intervals
21
ECG Complex
P wave
PR Interval
QRS complex
ST segment
T Wave
QT Interval
RR Interval
Normal P wave
 Atrial depolarisation
 It is best seen & studied in lead II because the frontal P
wave axis is usually directed to the positive pole of this
lead.
 Duration 80 to 100 msec
 Maximum amplitude 2.5 mm
 Axis +45 to +65
 Biphasic in lead V1
Normal QRS complex
 Produced due to ventricular depolarization
 It corresponds to phase ‘0’ of ventricular action
potential
 Completely negative in lead aVR , maximum positivity
in lead II
 rS in right oriented leads and qR in left oriented leads
 Transition zone commonly in V3-V4
 RV5 > RV6 normally
 Normal duration 50-110 msec, not more than 120 msec
 Physiological q wave in frontal leads is not > 0.03 sec
in duration
Amplitude of QRS
 Depends on the following factors
 1.electrical force generated by the ventricular
myocardium
 2.distance of the sensing electrode from the ventricles
 3.Body build :a thin individual has larger complexes
when compared to obese individuals
 4.direction of the frontal QRS axis
J Point
• It refers to the point on ECG which coincides with
the end of depolarization and start of repolarization
of ventricles, i.e.it occurs at the end of QRS
complex.
• At this point since all parts of ventricles are
depolarized, so no current is flowing around the
heart.
• Therefore, at J point the potential of ECG exactly
zero voltage.
ST Segment
• It is an isoelectric period between the
end of QRS complex and beginning of T
wave.
• It corresponds to phase ‘2’ of ventricular
action potential.
Normal T wave
 Produced due to active ventricular repolarization.
 It corresponds to phase ‘3’ of ventricular action
potential
 Same direction as the preceding QRS complex
 Smooth contours ,blunt apex with asymmetric limbs
 The T wave in V6 is greater than T wave in V1 normally
 Relatively tall T waves are seen in V2 toV4 leads
 Height < 5mm in limb leads and <10 mm in precordial
leads
 May be tall in athletes
Normal u wave
 Genesis of U wave is uncertain
 Best seen in midprecordial leads
 Isoelectric in lead aVL
 Height < 10% of preceding T wave
 Rarely exceeds 1 mm in amplitude
 May be tall in athletes (2mm)
PR Interval
 It starts from the beginning of the P wave to
starting of QRS cmplex.
 Normal duration is 0.12-0.2osec.
 It includes atrial depolarisation & AV nodal delay.
Normal ECG
ECG INTERPRETATION
 Standardization & technical features(including lead
placement &artifacts)
1) Heart rate
2) Rhythm
3) Axis
4) P wave
5) PR interval
6) QRS interval
7) T wave
8) QT interval
9) U wave
10) Precordial R wave progression
11) Abnormal Q waves
12) ST segment
Determining the Heart Rate
•Rule of 300/1500
•6 Second Rule
Rule of 300
Count the number of “big boxes” between
two QRS complexes, and divide this into
300. (smaller boxes with 1500)
for regular rhythms.
The Rule of 300
It may be easiest to memorize the following table:
No of big
boxes
Rate
1 300
2 150
3 100
4 75
5 60
6 50
6 Second Rule
ECGs record 6 seconds of rhythm per page,
Count the number of beats present on the ECG
Multiply by 10
For irregular rhythms.
37
 To find out the heart rate we need to know
 The R-R interval in terms of # of big squares
 If the R-R intervals are constant
 In this ECG the R-R intervals are constant
 R-R are approximately 3 big squares apart
 So the heart rate is 300 ÷ 3 = 100
What is the Heart Rate ?
38
38
What is the Heart Rate ?
Answer on next slide
39
 To find out the heart rate we need to know
 The R-R interval in terms of # of big squares
 If the R-R intervals are constant
 In this ECG the R-R intervals are constant
 R-R are approximately 4.5 big squares apart
 So the heart rate is 300 ÷ 4.5 = 67
What is the Heart Rate ?
40
40
What is the Heart Rate ?
Answer on next slide
41
 To find out the heart rate we need to
know
 The R-R interval in terms of # of Big
Squares
 If the R-R intervals are constant
 In this ECG the R-R intervals are not
constant
 R-R are varying from 2 boxes to 3 boxes
 It is an irregular rhythm – Sinus
arrhythmia
What is the Heart Rate ?
42
QRS Axis
 The QRS electrical (vector) axis can have 4 directions
 Normal Axis - when it is downward and to the left –
southeast quadrant – from -30 to +90 degrees
 Right Axis – when it is downward and to the right –
southwest quadrant – from +90 to 180 degrees
 Left Axis – when it is upward and to the left –
Northeast quadrant –from -30 to -90 degrees
 Indeterminate Axis – when it is upward & to the right
– Northwest quadrant – from -90 to +180
43
43
Normal ECG
44
Normal ECG
 Standardization – 10 mm (2 boxes) = 1 mV
 Double and half standardization if required
 Sinus Rhythm – Each P followed by QRS, R-R constant
 P waves – always examine for in L2, V1, L1
 QRS positive in L1, L2, L3, aVF and aVL. – Neg in aVR
 QRS is < 0.08 narrow, Q in V5, V6 < 0.04, < 3 mm
 R wave progression from V1 to V6, QT interval < 0.4
 Axis normal – L1, L3, and aVF all will be positive
 ST Isoelectric, T waves ↑, Normal T↓ in aVR,V1, V2
45
45
Be aware of normal ECG
 Normal Resting ECG – cannot exclude disease
 Ischemia may be covert – supply / demand equation
 Changes of MI take some time to develop in ECG
 Mild Ventricular hypertrophy - not detectable in ECG
 Some of the ECG abnormalities are non specific
 Single ECG cannot give progress – Need serial ECGs
 ECG changes not always correlate with Angio results
 Paroxysmal events will be missed in single ECG
46
46
Pseudo Normalization
Before
Chest pain
During
Chest pain
Chest pain
Relieved
T↓
T↓
T↑
47
47
Atrial Waves
48
48
Left Atrial
Enlargement
49
49
Left Atrial
Enlargement
P wave duration is 4 boxes-0.04 x 4 = 0.16
50
 Always examine V 1 and Lead 1 for LAE
 Biphasic P Waves, Prolonged P waves
 P wave 0.16 sec, ↑ Downward component
 Systemic Hypertension, MS and or MR
 Aortic Stenosis and Regurgitation
 Left ventricular hypertrophy with
dysfunction
 Atrial Septal Defect with R to L shunt
Left Atrial
Enlargement
51
 Always examine Lead 2 for RAE
 Tall Peaked P Waves, Arrow head P
waves
 Amplitude is 4 mm ( 0.4 mV) -
abnormal
 Pulmonary Hypertension, Mitral
Stenosis
 Tricuspid Stenosis, Regurgitation
 Pulmonary Valvular Stenosis
 Pulmonary Embolism
 Atrial Septal Defect with L to R shunt
Right Atrial Enlargement
52
52
Right Ventricular Hypertrophy
53
 Tall R in V1 with R >> S, or R/S
ratio > 1
 Deep S waves in V4, V5 and V6
 The DD is RVH, Posterior MI,
Anti-clock wise rotation of Heart
 Associated Right Axis Deviation,
RAE
 Deep T inversions in V1, V2 and V3
 Absence of Inferior MI
Right Ventricular Hypertrophy
54
54
Is there any hypertrophy ?
55
Criteria and Causes of RVH
Criteria of RVH
 Tall R in V1 with R >> S, or R/S ratio > 1
 Deep S waves in V4, V5 and V6
 The DD is RVH, Posterior MI, Rotation
 Associated Right Axis Deviation, RAE
 Deep T inversion in V1, V2 and V3
Cause of RVH
 Long standing Mitral Stenosis
 Pulmonary Hypertension of any cause
 VSD or ASD with initial L to R shunt
 Congenital heart with RV over load
 Tricuspid regurgitation, Pulmonary
stenosis
56
56
What is in this ECG ?
57
ECG OF MS with RVH, RAE
 Classical changes seen are
 Right ventricular hypertrophy
 Right axis deviation
 Right Bundle Branch Block
 P – Pulmonale - Right Atrial enlargement
 P – Mitrale – Left Atrial enlargement
 If Atrial Fibrillation develops – ‘P’
disappears
58
58
Left Ventricular Hypertrophy
59
 High QRS voltages in limb leads
 R in Lead I + S in Lead III > 25 mm
 S in V1 + R in V5 > 35 mm
 R in aVL > 11 mm or S V3 + R aVL > 24 ♂, > 20 ♀
 Deep symmetric T inversion in V4, V5 & V6
 QRS duration > 0.09 sec
 Associated Left Axis Deviation, LAE
 Cornell Voltage criteria, Estes point scoring
Left Ventricular Hypertrophy
60
60
What is in this ECG ?
61
Causes of LVH
 Pressure overload - Systemic Hypertension, Aortic
Stenosis
 Volume overload - AR or MR - dilated cardiomyopathy
 VSD - cause both right & left ventricular volume overload
 Hypertrophic cardiomyopathy – No pressure or volume
overload
Criteria of LVH
 High QRS voltages in limb leads
 R in Lead I + S in Lead III > 25 mm or S in V1 + R in V5 >
35 mm
 R in aVL > 11 mm or S V3 + R aVL > 24 ♂, > 20 ♀
 Deep symmetric T inversion in V4, V5 & V6
 QRS duration > 0.09 sec, Associated Left Axis Deviation,
LAE
Causes and Criteria of LVH
62
62
Atrial Ectopics
APC
APC
APC
APC
63
 Note the premature (ectopic) beats marked
as
 APC (Atrial Premature Contractions)
 These occurred before the next expected
QRS complex (premature)
 Each APC has a P wave preceding the QRS of
that beat – So impulse has originated in the
atria
 The QRS duration is normal < 0.08, not wide
Atrial Ectopics
66
66
Complete RBBB
67
Complete RBBB
 Complete RBBB has a QRS duration > 0.12 sec
 R' wave in lead V1 (usually see rSR' complex)
 S waves in leads I, aVL, V6, R wave in lead aVR
 QRS axis in RBBB is -30 to +90 (Normal)
 Incomplete RBBB has a QRS duration of 0.10
to 0.12 sec with the same QRS features as
above
 The "normal" ST-T waves in RBBB should be
oriented opposite to the direction of the QRS
68
68
Complete LBBB
69
Complete LBBB
 Complete LBBB has a QRS duration > 0.12 sec
 Prominent S waves in lead V1, R in L I, aVL, V6
 Usually broad, Bizarre R waves are seen, M
pattern
 Poor R progression from V1 to V3 is common.
 The "normal" ST-T waves in LBBB should be
oriented opposite to the direction of the QRS
 Incomplete LBBB looks like LBBB but QRS
duration is 0.10 to 0.12 sec, with less ST-T
change.
 This is often a progression of LVH changes.
70
70
Blood Supply of Heart
LCA
RCA
LAD
LCX
RCA
71
 Heart has four surfaces
 Anterior surface – LAD, Left Circumflex (LCx)
 Left lateral surface – LCx, partly LAD
 Inferior surface – RCA, LAD terminal portion
 Posterior surface – RCA, LCx branches
 Rt. and Lt. coronary arteries arise from aorta
 They are 2.5 mm at origin, 0.5 mm at the end
 Coronary arteries fill during diastole
 Flow - epicardium to endocardium –
poverty/plenty
Blood Supply of Heart
72
72
Ischemia, Injury & Infarction
Myocardial
Ischemia
Myocardial
Injury
Myocardial
Infarction
1. Ischemia produces ST segment
depression with or without
T inversion
2. Injury causes ST segment
elevation with or without loss
of R wave voltage
3. Infarction causes deep Q waves
with loss of R wave voltage.
73
73
Ischemia and Infarction
TRANSMURAL Injury
ST Elevation
74
Ischemic Heart Disease (IHD)
Blood supply Sub-
endocardial
Transmural
Ischemia
Transient loss
Stable
Angina
Variant
Angina
Infarction
Persistent loss
NSTEMI
ACS
STEMI
ACS
ST Segment Depressed Elevated
75
75
Interpret this ECG
76
NSTEMI
Non ST ↑ MI or NSTEMI, Non Q MI
 Or also called sub-endocardial Infarction
 Non transmural, restricted to the sub-
endocardial region - there will be no ST ↑ or Q
waves
 ST depressions in anterio-lateral & inferior leads
 Prolonged chest pain, autonomic symptoms like
nausea, vomiting, diaphoresis
 Persistent ST-segment ↓even after resolution of
pain
77
77
What are these ECGs
78
STEMI and QWMI
STEMI and QWMI
 ST ↑ signifies severe transmural myocardial
injury – This is early stage before death of the
muscle tissue – the infarction
 Q waves signify muscle death – They appear late
in the sequence of MI and remain for a long time
 Presence of either is an indication for
thrombolysis
79
79
Evolution of Acute MI
A – Normal ST segment and T waves
B – ST mild ↑ and prominent T waves
C – Marked ST ↑ + merging upright T
D – ST elevation reduced, T↓,Q starts
E – Deep Q waves, ST segment returning to
baseline, T wave is inverted
F – ST became normal, T Upright, Only Q+
80
80
Critical Narrowing of LAD
81
81
Normal Q waves
Notice the small
Normal Q in Lead I
82
82
Pathological Q wave
Notice the deep & wide
Infarction Q in Lead I
83
83
Very Striking
84
Hyper Acute MI
 Note the hyper acute elevation of ST
 The R wave is continuing with ST and the
complexes are looking rectangular
 Some times tall and peaked T waves in the
precardial leads may be the only evidence of
impending infarct
 Sudden appearance LBBB indicates MI
 MI in Dextro-cardia – right sided leads are to
be recorded
85
85
Severe Chest Pain – Why ?
86
 Note the ST elevations in
Inferior leads- namely L2, L3
and aVF
 T inversions yet to appear
 aVL lead shows complimentary
ST↓and T inversion
Acute Inferior wall MI
87
87
Acute True Posterior MI
88
 Due to occlusion of the distal Left
circumflex artery or posterior
descending or distal right coronary
artery
 Mirror image changes or reciprocal
changes in the anterior precardial leads
 Lead V1 shows unusually tall R wave (it
is the mirror image of deep Q)
 V1 R/S > 1, Differential Diagnosis - RVH
Acute True Posterior MI
RHYTHM
 The word rhythm of heart is used to refer part of the
heart which is controlling activation sequence.
 Normal heart rhythm,with electrical activation
beginning in SA node ,is called sinus rhythm.
Sinus Rhythms
Sinus Bradycardia
Sinus Tachycardia
Rhythm #1
30 bpm
• Rate?
• Regularity? regular
normal
0.10 s
• P waves?
• PR interval? 0.12 s
• QRS duration?
Interpretation? Sinus Bradycardia
Sinus Bradycardia
Deviation from NSR
- Rate < 60 bpm
Sinus Bradycardia
 Etiology: SA node is depolarizing slower than normal,
impulse is conducted normally (i.e. normal PR and
QRS interval).
Rhythm #2
130 bpm
• Rate?
• Regularity? regular
normal
0.08 s
• P waves?
• PR interval? 0.16 s
• QRS duration?
Interpretation? Sinus Tachycardia
Sinus Tachycardia
Deviation from NSR
- Rate > 100 bpm
Sinus Tachycardia
 Etiology: SA node is depolarizing faster than normal,
impulse is conducted normally.
 Remember: sinus tachycardia is a response to physical
or psychological stress, not a primary arrhythmia.
Premature Beats
Premature Atrial Contractions
(PACs)
Premature Ventricular Contractions
(PVCs)
Rhythm #3
70 bpm
• Rate?
• Regularity? occasionally irreg.
2/7 different contour
0.08 s
• P waves?
• PR interval? 0.14 s (except 2/7)
• QRS duration?
Interpretation? NSR with Premature Atrial
Contractions
Premature Atrial Contractions
Deviation from NSR
 These ectopic beats originate in the atria
(but not in the SA node), therefore the
contour of the P wave, the PR interval,
and the timing are different than a
normally generated pulse from the SA
node.
Premature Atrial Contractions
 Etiology: Excitation of an atrial cell forms an impulse
that is then conducted normally through the AV node
and ventricles.
Teaching Moment
 When an impulse originates anywhere in the atria
(SA node, atrial cells, AV node, Bundle of His) and
then is conducted normally through the ventricles,
the QRS will be narrow (0.04 - 0.12 s).
Rhythm #4
60 bpm
• Rate?
• Regularity? occasionally irreg.
none for 7th QRS
0.08 s (7th wide)
• P waves?
• PR interval? 0.14 s
• QRS duration?
Interpretation? Sinus Rhythm with 1 PVC
PVCs
 Deviation from NSR
 Ectopic beats originate in the ventricles resulting in
wide and bizarre QRS complexes.
 When there are more than 1 premature beats and look
alike, they are called “uniform”. When they look
different, they are called “multiform”.
PVCs
 Etiology: One or more ventricular cells are
depolarizing and the impulses are abnormally
conducting through the ventricles.
Teaching Moment
 When an impulse originates in a ventricle, conduction
through the ventricles will be inefficient and the QRS
will be wide and bizarre.
Ventricular Conduction
Normal
Signal moves rapidly
through the ventricles
Abnormal
Signal moves slowly
through the ventricles
Artifacts in ECG
REVERSAL OF LEADS
 Reversal of arm leads is the most common lead
placement error and is the easiest to recognize because of
negative P wave in L1.
 In patients with AF or unrecognizable P waves, if the
polarity of QRS in L1 is different from that of left
precordial leads V5 and V6, arm lead reversal is
suspected.
ECG
 In case of reversal of arm leads the morphology of
complexes in the limb leads resembles dextrocardia.
 However dextrocardia and reversal of arm leads can be
differentiated on the basis of QRS complexes in the
precordial leads.
 In dextrocardia as we progress from V1 to V6 QRS
complex becomes progressively smaller and displays
mostly QS or rS in V5 or V6.
 In reversal of arm leads the progression of QRS from
V1 to V6 is normal.
Normal variants of ECG
 Sinus arrhythmia
 Early repolarisation syndrome
 Persistent juvenile pattern
 Non specific T wave changes
Sinus arrhythmia
 Characterized by alternating periods of slow and rapid
rates.
 It is due to irregular fluctuating discharge of SA node.
 Mostly associated with phases of respiration(respiratory
sinus arrhythmia)
 The period of faster rate occur during end of inspiration,
slower rate towards end of expiration.
 The mechanism is mediated by reflex stimulation of
vagus nerve from receptors in lungs.
 It is accentuated by vagotonic procedures like carotid
sinus compression and abolished by vagolytic procedures
like exercise,atropine.
One P wave for one QRS complex
Constant PR interval
Normal P,QRS,T complexes with alternating periods
of gradually lengthening and shortening of P-P
intervals.
Respiratory sinus arrhythmia is normal physiological
phenomenon and most marked in young persons.
Early repolarisation syndrome
 Also called athletes heart
 Characterized by
1. Prominent j(junctional) waves
2. concave upward minimally elevated,ST segments
3. Relatively tall and frequently symmetrical T waves
4. Occasionally inverted T waves
5. Prominent but narrow initial Q waves in left oriented leads
6. Tall R waves in left precordial waves
7. Prominent mid precordial U waves
8. Rapid precordial transition
9. A tendency to counterclockwise electrical rotation
10. Sinus bradycardia or normal but slow sinus rates
Persistent Juvenile pattern
 Characterized by inversion of T waves in right
precordial leads V1 to V4.
 T wave inversions in V1toV4 are common in infancy
and childhood
 If it persists in adults also then called persistent
juvenile pattern.
 More common in negroes.
Non specific T wave variants
 Inversion of T waves may occur as non specific
manifestation in leads where T waves are normally
upright.
 They may be found in following circumstances
1. Anxiety and fear
2. As an orthostatic response
3. As a postprandial response
4. As result of hyperventilation
5. Idiopathic
119

A Presentation on Electro-cardiogram & It's Interpretations

  • 1.
    Maj Dr. NeamatullahAhmed, PBGMS , MBBS, MPH,MCPS. Electrocardiogram & It’s Interpretetion
  • 2.
    OUTLINE  HISTORY  INTRODUCTION ECG LEADS AND RECORDING  ECG WAVE FORMS AND INTERVALS  ECG INTERPRETATION  ARTIFACTS IN ECG  NORMAL VARIANTS IN ECG
  • 3.
    History  1895 -William Einthoven , credited for the invention of ECG.  1924 - the noble prize for physiology or medicine is given to William Einthoven for his work on ECG.  1942- Goldberger increased Unipolar lead voltage by 50% and made Augmented leads
  • 5.
  • 6.
    Introduction  ECG isdefined as graphic recording of electric potentials generated by the heart.  Electric currents that spread through the heart are produced by three components:cardiac pacemaker cells,specialized conduction tissue & heart muscle itself.  ECG however records only the depolarisation & repolarisation potentials generated by the atrial & ventricular myocardium.
  • 7.
    Recording of ECG ECGgraphs: – 1 mm squares – 5 mm squares Paper Speed: – 25 mm/sec standard Voltage Calibration: – 10 mm/mV standard
  • 8.
    ECG Paper: Dimensions 5mm 1 mm 0.1 mV 0.04 sec 0.2 sec Time Voltage
  • 9.
    9  Standard ECGis recorded in 12 leads  Six Limb leads – L1, L2, L3, aVR, aVL, aVF  Six Chest Leads – V1 V2 V3 V4 V5 and V6  aVR, aVL, aVF are called unipolar leads  aVR – from Right Arm Positive  aVL – from Left Arm Positive  aVF – from Left Foot Positive ECG Unipolar Limb Leads
  • 10.
    ECG Leads Leads areelectrodes which measure the difference in electrical potential between either: 1. Two different points on the body (bipolar leads) 2. One point on the body and a virtual reference point with zero electrical potential, located in the center of the heart (unipolar leads)
  • 11.
    ECG Leads The standardECG has 12 leads: 3 Standard Limb Leads 3 Augmented Limb Leads 6 Precordial Leads The limb leads record potentials transmitted on to the frontal plane & chest leads record potentials transmitted on to the horizontal plane. The axis of a particular lead represents the viewpoint from which it looks at the heart.
  • 12.
    Summary of Leads LimbLeads Precordial Leads Bipolar I, II, III (standard limb leads) - Unipolar AVR, AVL, AVF (augmented limb leads) V1-V6
  • 13.
    Localising the arterialterritory Inferior II, III, AVF Lateral I, AVL, V5-V6 Anterior / Septal V1-V4
  • 14.
  • 15.
  • 16.
    16 Precardial (chest) LeadPosition  V1 Fourth ICS, right sternal border  V2 Fourth ICS, left sternal border  V3 Equidistant between V2 and V4  V4 Fifth ICS, left Mid clavicular Line  V5 Fifth ICS Left anterior axillary line  V6 Fifth ICS Left mid axillary line ECG Chest Leads
  • 18.
    18 ECG Graph Paper X-Axis time in seconds Y- Axis Amplitude in mill volts
  • 19.
    19 19  X-Axis representstime - Scale X-Axis – 1 mm = 0.04 sec  Y-Axis represents voltage - Scale Y-Axis – 1 mm = 0.1 mV  One big square on X-Axis = 0.2 sec (big box)  Two big squares on Y-Axis = 1 milli volt (mV)  Each small square is 0.04 sec (1 mm in size)  Each big square on the ECG represents 5 small squares = 0.04 x 5 = 0.2 seconds  5 such big squares = 0.2 x 5 = 1sec = 25 mm  One second is 25 mm or 5 big squares  One minute is 5 x 60 = 300 big squares ECG Graph Paper
  • 20.
    ECG Wave forms& Intervals
  • 21.
    21 ECG Complex P wave PRInterval QRS complex ST segment T Wave QT Interval RR Interval
  • 22.
    Normal P wave Atrial depolarisation  It is best seen & studied in lead II because the frontal P wave axis is usually directed to the positive pole of this lead.  Duration 80 to 100 msec  Maximum amplitude 2.5 mm  Axis +45 to +65  Biphasic in lead V1
  • 23.
    Normal QRS complex Produced due to ventricular depolarization  It corresponds to phase ‘0’ of ventricular action potential  Completely negative in lead aVR , maximum positivity in lead II  rS in right oriented leads and qR in left oriented leads  Transition zone commonly in V3-V4  RV5 > RV6 normally  Normal duration 50-110 msec, not more than 120 msec  Physiological q wave in frontal leads is not > 0.03 sec in duration
  • 24.
    Amplitude of QRS Depends on the following factors  1.electrical force generated by the ventricular myocardium  2.distance of the sensing electrode from the ventricles  3.Body build :a thin individual has larger complexes when compared to obese individuals  4.direction of the frontal QRS axis
  • 25.
    J Point • Itrefers to the point on ECG which coincides with the end of depolarization and start of repolarization of ventricles, i.e.it occurs at the end of QRS complex. • At this point since all parts of ventricles are depolarized, so no current is flowing around the heart. • Therefore, at J point the potential of ECG exactly zero voltage.
  • 26.
    ST Segment • Itis an isoelectric period between the end of QRS complex and beginning of T wave. • It corresponds to phase ‘2’ of ventricular action potential.
  • 27.
    Normal T wave Produced due to active ventricular repolarization.  It corresponds to phase ‘3’ of ventricular action potential  Same direction as the preceding QRS complex  Smooth contours ,blunt apex with asymmetric limbs  The T wave in V6 is greater than T wave in V1 normally  Relatively tall T waves are seen in V2 toV4 leads  Height < 5mm in limb leads and <10 mm in precordial leads  May be tall in athletes
  • 29.
    Normal u wave Genesis of U wave is uncertain  Best seen in midprecordial leads  Isoelectric in lead aVL  Height < 10% of preceding T wave  Rarely exceeds 1 mm in amplitude  May be tall in athletes (2mm)
  • 30.
    PR Interval  Itstarts from the beginning of the P wave to starting of QRS cmplex.  Normal duration is 0.12-0.2osec.  It includes atrial depolarisation & AV nodal delay.
  • 31.
  • 32.
    ECG INTERPRETATION  Standardization& technical features(including lead placement &artifacts) 1) Heart rate 2) Rhythm 3) Axis 4) P wave 5) PR interval 6) QRS interval 7) T wave 8) QT interval 9) U wave 10) Precordial R wave progression 11) Abnormal Q waves 12) ST segment
  • 33.
    Determining the HeartRate •Rule of 300/1500 •6 Second Rule
  • 34.
    Rule of 300 Countthe number of “big boxes” between two QRS complexes, and divide this into 300. (smaller boxes with 1500) for regular rhythms.
  • 35.
    The Rule of300 It may be easiest to memorize the following table: No of big boxes Rate 1 300 2 150 3 100 4 75 5 60 6 50
  • 36.
    6 Second Rule ECGsrecord 6 seconds of rhythm per page, Count the number of beats present on the ECG Multiply by 10 For irregular rhythms.
  • 37.
    37  To findout the heart rate we need to know  The R-R interval in terms of # of big squares  If the R-R intervals are constant  In this ECG the R-R intervals are constant  R-R are approximately 3 big squares apart  So the heart rate is 300 ÷ 3 = 100 What is the Heart Rate ?
  • 38.
    38 38 What is theHeart Rate ? Answer on next slide
  • 39.
    39  To findout the heart rate we need to know  The R-R interval in terms of # of big squares  If the R-R intervals are constant  In this ECG the R-R intervals are constant  R-R are approximately 4.5 big squares apart  So the heart rate is 300 ÷ 4.5 = 67 What is the Heart Rate ?
  • 40.
    40 40 What is theHeart Rate ? Answer on next slide
  • 41.
    41  To findout the heart rate we need to know  The R-R interval in terms of # of Big Squares  If the R-R intervals are constant  In this ECG the R-R intervals are not constant  R-R are varying from 2 boxes to 3 boxes  It is an irregular rhythm – Sinus arrhythmia What is the Heart Rate ?
  • 42.
    42 QRS Axis  TheQRS electrical (vector) axis can have 4 directions  Normal Axis - when it is downward and to the left – southeast quadrant – from -30 to +90 degrees  Right Axis – when it is downward and to the right – southwest quadrant – from +90 to 180 degrees  Left Axis – when it is upward and to the left – Northeast quadrant –from -30 to -90 degrees  Indeterminate Axis – when it is upward & to the right – Northwest quadrant – from -90 to +180
  • 43.
  • 44.
    44 Normal ECG  Standardization– 10 mm (2 boxes) = 1 mV  Double and half standardization if required  Sinus Rhythm – Each P followed by QRS, R-R constant  P waves – always examine for in L2, V1, L1  QRS positive in L1, L2, L3, aVF and aVL. – Neg in aVR  QRS is < 0.08 narrow, Q in V5, V6 < 0.04, < 3 mm  R wave progression from V1 to V6, QT interval < 0.4  Axis normal – L1, L3, and aVF all will be positive  ST Isoelectric, T waves ↑, Normal T↓ in aVR,V1, V2
  • 45.
    45 45 Be aware ofnormal ECG  Normal Resting ECG – cannot exclude disease  Ischemia may be covert – supply / demand equation  Changes of MI take some time to develop in ECG  Mild Ventricular hypertrophy - not detectable in ECG  Some of the ECG abnormalities are non specific  Single ECG cannot give progress – Need serial ECGs  ECG changes not always correlate with Angio results  Paroxysmal events will be missed in single ECG
  • 46.
    46 46 Pseudo Normalization Before Chest pain During Chestpain Chest pain Relieved T↓ T↓ T↑
  • 47.
  • 48.
  • 49.
    49 49 Left Atrial Enlargement P waveduration is 4 boxes-0.04 x 4 = 0.16
  • 50.
    50  Always examineV 1 and Lead 1 for LAE  Biphasic P Waves, Prolonged P waves  P wave 0.16 sec, ↑ Downward component  Systemic Hypertension, MS and or MR  Aortic Stenosis and Regurgitation  Left ventricular hypertrophy with dysfunction  Atrial Septal Defect with R to L shunt Left Atrial Enlargement
  • 51.
    51  Always examineLead 2 for RAE  Tall Peaked P Waves, Arrow head P waves  Amplitude is 4 mm ( 0.4 mV) - abnormal  Pulmonary Hypertension, Mitral Stenosis  Tricuspid Stenosis, Regurgitation  Pulmonary Valvular Stenosis  Pulmonary Embolism  Atrial Septal Defect with L to R shunt Right Atrial Enlargement
  • 52.
  • 53.
    53  Tall Rin V1 with R >> S, or R/S ratio > 1  Deep S waves in V4, V5 and V6  The DD is RVH, Posterior MI, Anti-clock wise rotation of Heart  Associated Right Axis Deviation, RAE  Deep T inversions in V1, V2 and V3  Absence of Inferior MI Right Ventricular Hypertrophy
  • 54.
    54 54 Is there anyhypertrophy ?
  • 55.
    55 Criteria and Causesof RVH Criteria of RVH  Tall R in V1 with R >> S, or R/S ratio > 1  Deep S waves in V4, V5 and V6  The DD is RVH, Posterior MI, Rotation  Associated Right Axis Deviation, RAE  Deep T inversion in V1, V2 and V3 Cause of RVH  Long standing Mitral Stenosis  Pulmonary Hypertension of any cause  VSD or ASD with initial L to R shunt  Congenital heart with RV over load  Tricuspid regurgitation, Pulmonary stenosis
  • 56.
    56 56 What is inthis ECG ?
  • 57.
    57 ECG OF MSwith RVH, RAE  Classical changes seen are  Right ventricular hypertrophy  Right axis deviation  Right Bundle Branch Block  P – Pulmonale - Right Atrial enlargement  P – Mitrale – Left Atrial enlargement  If Atrial Fibrillation develops – ‘P’ disappears
  • 58.
  • 59.
    59  High QRSvoltages in limb leads  R in Lead I + S in Lead III > 25 mm  S in V1 + R in V5 > 35 mm  R in aVL > 11 mm or S V3 + R aVL > 24 ♂, > 20 ♀  Deep symmetric T inversion in V4, V5 & V6  QRS duration > 0.09 sec  Associated Left Axis Deviation, LAE  Cornell Voltage criteria, Estes point scoring Left Ventricular Hypertrophy
  • 60.
    60 60 What is inthis ECG ?
  • 61.
    61 Causes of LVH Pressure overload - Systemic Hypertension, Aortic Stenosis  Volume overload - AR or MR - dilated cardiomyopathy  VSD - cause both right & left ventricular volume overload  Hypertrophic cardiomyopathy – No pressure or volume overload Criteria of LVH  High QRS voltages in limb leads  R in Lead I + S in Lead III > 25 mm or S in V1 + R in V5 > 35 mm  R in aVL > 11 mm or S V3 + R aVL > 24 ♂, > 20 ♀  Deep symmetric T inversion in V4, V5 & V6  QRS duration > 0.09 sec, Associated Left Axis Deviation, LAE Causes and Criteria of LVH
  • 62.
  • 63.
    63  Note thepremature (ectopic) beats marked as  APC (Atrial Premature Contractions)  These occurred before the next expected QRS complex (premature)  Each APC has a P wave preceding the QRS of that beat – So impulse has originated in the atria  The QRS duration is normal < 0.08, not wide Atrial Ectopics
  • 64.
  • 65.
    67 Complete RBBB  CompleteRBBB has a QRS duration > 0.12 sec  R' wave in lead V1 (usually see rSR' complex)  S waves in leads I, aVL, V6, R wave in lead aVR  QRS axis in RBBB is -30 to +90 (Normal)  Incomplete RBBB has a QRS duration of 0.10 to 0.12 sec with the same QRS features as above  The "normal" ST-T waves in RBBB should be oriented opposite to the direction of the QRS
  • 66.
  • 67.
    69 Complete LBBB  CompleteLBBB has a QRS duration > 0.12 sec  Prominent S waves in lead V1, R in L I, aVL, V6  Usually broad, Bizarre R waves are seen, M pattern  Poor R progression from V1 to V3 is common.  The "normal" ST-T waves in LBBB should be oriented opposite to the direction of the QRS  Incomplete LBBB looks like LBBB but QRS duration is 0.10 to 0.12 sec, with less ST-T change.  This is often a progression of LVH changes.
  • 68.
    70 70 Blood Supply ofHeart LCA RCA LAD LCX RCA
  • 69.
    71  Heart hasfour surfaces  Anterior surface – LAD, Left Circumflex (LCx)  Left lateral surface – LCx, partly LAD  Inferior surface – RCA, LAD terminal portion  Posterior surface – RCA, LCx branches  Rt. and Lt. coronary arteries arise from aorta  They are 2.5 mm at origin, 0.5 mm at the end  Coronary arteries fill during diastole  Flow - epicardium to endocardium – poverty/plenty Blood Supply of Heart
  • 70.
    72 72 Ischemia, Injury &Infarction Myocardial Ischemia Myocardial Injury Myocardial Infarction 1. Ischemia produces ST segment depression with or without T inversion 2. Injury causes ST segment elevation with or without loss of R wave voltage 3. Infarction causes deep Q waves with loss of R wave voltage.
  • 71.
  • 72.
    74 Ischemic Heart Disease(IHD) Blood supply Sub- endocardial Transmural Ischemia Transient loss Stable Angina Variant Angina Infarction Persistent loss NSTEMI ACS STEMI ACS ST Segment Depressed Elevated
  • 73.
  • 74.
    76 NSTEMI Non ST ↑MI or NSTEMI, Non Q MI  Or also called sub-endocardial Infarction  Non transmural, restricted to the sub- endocardial region - there will be no ST ↑ or Q waves  ST depressions in anterio-lateral & inferior leads  Prolonged chest pain, autonomic symptoms like nausea, vomiting, diaphoresis  Persistent ST-segment ↓even after resolution of pain
  • 75.
  • 76.
    78 STEMI and QWMI STEMIand QWMI  ST ↑ signifies severe transmural myocardial injury – This is early stage before death of the muscle tissue – the infarction  Q waves signify muscle death – They appear late in the sequence of MI and remain for a long time  Presence of either is an indication for thrombolysis
  • 77.
    79 79 Evolution of AcuteMI A – Normal ST segment and T waves B – ST mild ↑ and prominent T waves C – Marked ST ↑ + merging upright T D – ST elevation reduced, T↓,Q starts E – Deep Q waves, ST segment returning to baseline, T wave is inverted F – ST became normal, T Upright, Only Q+
  • 78.
  • 79.
    81 81 Normal Q waves Noticethe small Normal Q in Lead I
  • 80.
    82 82 Pathological Q wave Noticethe deep & wide Infarction Q in Lead I
  • 81.
  • 82.
    84 Hyper Acute MI Note the hyper acute elevation of ST  The R wave is continuing with ST and the complexes are looking rectangular  Some times tall and peaked T waves in the precardial leads may be the only evidence of impending infarct  Sudden appearance LBBB indicates MI  MI in Dextro-cardia – right sided leads are to be recorded
  • 83.
  • 84.
    86  Note theST elevations in Inferior leads- namely L2, L3 and aVF  T inversions yet to appear  aVL lead shows complimentary ST↓and T inversion Acute Inferior wall MI
  • 85.
  • 86.
    88  Due toocclusion of the distal Left circumflex artery or posterior descending or distal right coronary artery  Mirror image changes or reciprocal changes in the anterior precardial leads  Lead V1 shows unusually tall R wave (it is the mirror image of deep Q)  V1 R/S > 1, Differential Diagnosis - RVH Acute True Posterior MI
  • 87.
    RHYTHM  The wordrhythm of heart is used to refer part of the heart which is controlling activation sequence.  Normal heart rhythm,with electrical activation beginning in SA node ,is called sinus rhythm.
  • 88.
  • 89.
    Rhythm #1 30 bpm •Rate? • Regularity? regular normal 0.10 s • P waves? • PR interval? 0.12 s • QRS duration? Interpretation? Sinus Bradycardia
  • 90.
  • 91.
    Sinus Bradycardia  Etiology:SA node is depolarizing slower than normal, impulse is conducted normally (i.e. normal PR and QRS interval).
  • 92.
    Rhythm #2 130 bpm •Rate? • Regularity? regular normal 0.08 s • P waves? • PR interval? 0.16 s • QRS duration? Interpretation? Sinus Tachycardia
  • 93.
  • 94.
    Sinus Tachycardia  Etiology:SA node is depolarizing faster than normal, impulse is conducted normally.  Remember: sinus tachycardia is a response to physical or psychological stress, not a primary arrhythmia.
  • 95.
    Premature Beats Premature AtrialContractions (PACs) Premature Ventricular Contractions (PVCs)
  • 96.
    Rhythm #3 70 bpm •Rate? • Regularity? occasionally irreg. 2/7 different contour 0.08 s • P waves? • PR interval? 0.14 s (except 2/7) • QRS duration? Interpretation? NSR with Premature Atrial Contractions
  • 97.
    Premature Atrial Contractions Deviationfrom NSR  These ectopic beats originate in the atria (but not in the SA node), therefore the contour of the P wave, the PR interval, and the timing are different than a normally generated pulse from the SA node.
  • 98.
    Premature Atrial Contractions Etiology: Excitation of an atrial cell forms an impulse that is then conducted normally through the AV node and ventricles.
  • 99.
    Teaching Moment  Whenan impulse originates anywhere in the atria (SA node, atrial cells, AV node, Bundle of His) and then is conducted normally through the ventricles, the QRS will be narrow (0.04 - 0.12 s).
  • 100.
    Rhythm #4 60 bpm •Rate? • Regularity? occasionally irreg. none for 7th QRS 0.08 s (7th wide) • P waves? • PR interval? 0.14 s • QRS duration? Interpretation? Sinus Rhythm with 1 PVC
  • 101.
    PVCs  Deviation fromNSR  Ectopic beats originate in the ventricles resulting in wide and bizarre QRS complexes.  When there are more than 1 premature beats and look alike, they are called “uniform”. When they look different, they are called “multiform”.
  • 102.
    PVCs  Etiology: Oneor more ventricular cells are depolarizing and the impulses are abnormally conducting through the ventricles.
  • 103.
    Teaching Moment  Whenan impulse originates in a ventricle, conduction through the ventricles will be inefficient and the QRS will be wide and bizarre.
  • 104.
    Ventricular Conduction Normal Signal movesrapidly through the ventricles Abnormal Signal moves slowly through the ventricles
  • 105.
  • 106.
    REVERSAL OF LEADS Reversal of arm leads is the most common lead placement error and is the easiest to recognize because of negative P wave in L1.  In patients with AF or unrecognizable P waves, if the polarity of QRS in L1 is different from that of left precordial leads V5 and V6, arm lead reversal is suspected.
  • 107.
  • 108.
     In caseof reversal of arm leads the morphology of complexes in the limb leads resembles dextrocardia.  However dextrocardia and reversal of arm leads can be differentiated on the basis of QRS complexes in the precordial leads.  In dextrocardia as we progress from V1 to V6 QRS complex becomes progressively smaller and displays mostly QS or rS in V5 or V6.  In reversal of arm leads the progression of QRS from V1 to V6 is normal.
  • 109.
    Normal variants ofECG  Sinus arrhythmia  Early repolarisation syndrome  Persistent juvenile pattern  Non specific T wave changes
  • 110.
    Sinus arrhythmia  Characterizedby alternating periods of slow and rapid rates.  It is due to irregular fluctuating discharge of SA node.  Mostly associated with phases of respiration(respiratory sinus arrhythmia)  The period of faster rate occur during end of inspiration, slower rate towards end of expiration.  The mechanism is mediated by reflex stimulation of vagus nerve from receptors in lungs.  It is accentuated by vagotonic procedures like carotid sinus compression and abolished by vagolytic procedures like exercise,atropine.
  • 111.
    One P wavefor one QRS complex Constant PR interval Normal P,QRS,T complexes with alternating periods of gradually lengthening and shortening of P-P intervals. Respiratory sinus arrhythmia is normal physiological phenomenon and most marked in young persons.
  • 112.
    Early repolarisation syndrome Also called athletes heart  Characterized by 1. Prominent j(junctional) waves 2. concave upward minimally elevated,ST segments 3. Relatively tall and frequently symmetrical T waves 4. Occasionally inverted T waves 5. Prominent but narrow initial Q waves in left oriented leads 6. Tall R waves in left precordial waves 7. Prominent mid precordial U waves 8. Rapid precordial transition 9. A tendency to counterclockwise electrical rotation 10. Sinus bradycardia or normal but slow sinus rates
  • 114.
    Persistent Juvenile pattern Characterized by inversion of T waves in right precordial leads V1 to V4.  T wave inversions in V1toV4 are common in infancy and childhood  If it persists in adults also then called persistent juvenile pattern.  More common in negroes.
  • 116.
    Non specific Twave variants  Inversion of T waves may occur as non specific manifestation in leads where T waves are normally upright.  They may be found in following circumstances 1. Anxiety and fear 2. As an orthostatic response 3. As a postprandial response 4. As result of hyperventilation 5. Idiopathic
  • 117.