SlideShare a Scribd company logo
Understanding Rhythm Strips
Waveforms and Components of The
            ECG Pattern
• A waveform
   – A positive or a negative defection that begins and ends at the
     baseline
   – It is an electrical representation of depolarization and
     repolarization occurring in the heart
• When there is NO electrical activity is detected, a straight
  line (isoelectric or base line) is recorded
• The waveforms produced by the heart’s electrical
  conduction system are called
   –   P
   –   QRS
   –   T
   –   May or may not be a U Wave
ECG Waveforms
• P wave
  – Occurs when the right and left atria are stimulated
• QRS complex
  – Occurs when the right and left ventricles are
    stimulated
• T wave
  – Represents electrical recovery or return to a resting
    state for the ventricles
• U wave
  – If see, is thought to represent the repolarization of the
    Purkinje fibers
ECG Waveforms
• P wave
  – Normally an upright and rounded waveform
• QRS complex
  – Usually the largest of all the waveforms and is spike
    shaped and narrow in appearance
• T wave
  – Appears as a slightly asymmetric upright waveform
  – It is usually larger than the P wave and smaller than
    the QRS
ECG Waveform
EGC Waveform
ECG Segments
• Segment
  – Length of baseline between two waves
    • PR segment
       – Represents the delay of the impulse in the AV node
    • ST segment
       – Represents the early part of repolarization of the right and left
         ventricles
ECG Intervals
• Interval is defined as the combination of a
  wave or several waves and a segment
• By measuring time intervals on the ECG, it can
  be determined how long the electrical wave
  takes to pass through the heart
ECG Intervals
• PR interval
  – P wave & PR segment
  – Corresponds to the spread of the electrical
    impulse through the atria and the delay of the
    impulse in the AV node before it travels to the
    ventricular muscle tissue
• QT interval
  – QRS complex & ST segment & T wave
  – Represents electrical stimulation and recovery of
    the ventricles
ECG Segments & Intervals
ECG Paper and Measurements
• ECG paper
  – Graph paper used to measure rates of impulse
    formation and the duration of the electrical events
    that occur in the heart
  – Vertical and horizontal lines, which from large and
    small boxes
  – Vertical lines
     • Measure voltage in millivolts
  – Horizontal lines
     • Measure time in seconds
ECG Paper and Measurements
• By counting the small or large boxes from the
  beginning to the end of the ECG waveforms
  and intervals, we can calculate the time it
  takes for the electricity to travel through
  certain parts of the heart and the rate at
  which impulses occur
ECG Paper and Measurements
Time Equivalents of Small Boxes   Time Equivalents of Large Boxes
•   1 small box = 0.04 second     •   1 large box = 0.20 second
•   2 small boxes = 0.08 second   •   5 large boxes = 1 second
•   3 small boxes = 0.12 second   •   15 large boxes = 3 seconds
•   4 small boxes = 0.16 second   •   30 large boxes = 6 seconds
•   5 small boxes = 0.20 second
Normal ECG Pattern and
           Measurements
• P Wave: Upright, smooth and rounded, and
  no more than 2.5 mm in height
Normal ECG Pattern and
           Measurements
• PR Interval: Measure 0.12 to 0.20 second
  wide or 3 to 5 small boxes
Normal ECG Pattern and
           Measurements
• QRS: Narrow in appearance, upright in Leads
  I, II, and III. Measures 0.04 to 0.11 second
  wide or 1 to 2 ½ small boxes
Normal ECG Pattern and
           Measurements
• ST Segment: Isoelectric
Normal ECG Pattern and
            Measurements
• T Wave: Slightly asymmetric, upright, and less
  than half the height of the QRS complex or 5
  mm in height or less
Normal ECG Pattern and
             Measurements
• QT interval: QT interval is less than half the R-
  R interval or 0.36 to 0.44 seconds or 9 to 11
  small boxes
  – The duration of the QT interval varies according to
    age, gender, and heart rate
     • As the heart rate increases
        – QT interval decreases
     • As the heart rate decreases
        – QT interval increases
Normal ECG Pattern and
            Measurements
• QT Interval
  – Fast heart rate
     • Small QT interval
  – Slow heart rate
     • Large QT interval
Normal ECG Pattern and
            Measurements
• U Wave: Upright and rounded. Usually less
  than 2 mm in height and smaller than that of
  the preceding T wave
Abnormal Characteristics of the ECG
             Pattern
• Abnormal P wave
  – Wide or notched-Left atrial enlargement or
    ectopic impulse from atria
  – Tall and pointed (peaked) – Right atrial
    enlargement or ectopic impulse from atria
  – Negative (Inverted) - ectopic pacemaker in the AV
    junction
Abnormal Characteristics of the ECG
             Pattern
• Wide or notched


• Tall and pointed (peaked)

• Negative (inverted)
Abnormal Characteristics of the ECG
             Pattern
• Abnormal PR Interval
  – A PR interval greater than 0.20 second wide is
    abnormal
  – This may be seen in
     • AV blocks
     • Hypothyroidism
     • Digitalis toxicity
Abnormal Characteristics of the ECG
             Pattern
• Abnormal QRS complex:
  – A wide QRS (greater than 0.12 second wide)
     • may be seen when an impulse originates from an
       ectopic site in the ventricular myocardium
     • If there is a delay or block of the impulse in the bundle
       branches
Abnormal Characteristics of the ECG
             Pattern
• Abnormal ST segment
  – Elevated ST segment
    • Elevated more than 1 mm in the limb leads or 2 mm in
      the precordial leads
       – Suggestive of myocardial injury
           » infarction
Abnormal Characteristics of the ECG
             Pattern
• Abnormal ST segment
  – Scoop ST depression
    • May be caused by digitalis toxicity
  – Depressed ST segment
    • More than 1 mm
       – Suggestive of myocardial ischemia
Abnormal Characteristics of the ECG
             Pattern
• Abnormal T wave
  – Negative (inverted)
     • Suggest myocardial ischemia or infarction
Abnormal Characteristics of the ECG
             Pattern
• Abnormal T wave
  – Low, flattened T waves
     • Can be seen with hypokalemia (low potassium)
Abnormal Characteristics of the ECG
             Pattern
• Abnormal T Wave
  – Tall Tented T waves
     • Suggestive of hyperkalemia (high potassium)
Abnormal Characteristics of the ECG
             Pattern
• Abnormal QT interval
  – Prolonged (greater than 0.44 seconds)
     • May be congenital or acquired
        – i.e. medications, electrolyte abnormalities
Abnormal Characteristics of the ECG
             Pattern
• Abnormal U Wave
  – A U wave taller than 2 mm
     •   Electrolyte imbalance
     •   Medications
     •   Hyperthyroidism
     •   Central nervous system
         disease
Steps for Analyzing a Rhythm Strip
• A quick method for analyzing a rhythm strip
  – There are several steps in analyzing a rhythm strip
  – When analyzing a rhythm strip, don’t forget to
    check the patient
Steps for Analyzing a Rhythm Strip
• Step 1:
  – Evaluate the P waves
     • Look for the presence of P waves and compare the
       shape and size of all P waves
     • All the P waves should be upright and rounded and
       uniform in appearance
     • P wave should be present before each QRS
Steps for Analyzing a Rhythm Strip
• Step 2:
  – Evaluate QRS Complexes
     • All of the QRS’s should be uniform and narrow in
       appearance
Steps for Analyzing a Rhythm Strip
• Step 2: continued
  – Measuring the QRS less than 0.12
     • Begin from the point where the first wave of the
       complex begins to deviate from the baseline and end
       where the complex returns to the baseline
     • Count the number of small boxes and multiply by o.o4
       seconds
Steps for Analyzing a Rhythm Strip
• Step 3:
  – Calculate the Atrial and Ventricular Heart Rates
     • There are a couple of methods to discuss
     • One will only be used by an MST
        – Six-Second Method
Steps for Analyzing a Rhythm Strip
• Step 3: continued
  – A normal heart rate in the resting adult is between
    60 and 100
  – A rate below 60
     • bradycardia
  – A rate above 100
     • tachycardia
  – The atrial rate should be the same as the
    ventricular rate
Steps for Analyzing a Rhythm Strip
• Step 3: continued
  – Six-Second Method (can be used for regular or
    irregular rhythm patterns)
     • Print off six seconds of ECG paper (use markers at the
       top or bottom of the paper
        – Atrial Rate
            » Count the number of P waves within a period of six
               seconds and multiply that number by 10
        – Ventricular Rate
            » Count the number of QRS complexes within six seconds
               and multiply by 10
Steps for Analyzing a Rhythm Strip
• Step 3: continued
  – Small Box Method (best used if the rhythm is
    regular, but may be used if the rhythm is irregular
    and a rate range is given)
     • Atrial rate
         – Count the number of small boxes between two P waves, and
           find the corresponding rate on the small box calculation chart
     • Ventricular rate
         – Count the number of small boxes between two QRS
           complexes and find the corresponding rate on the small box
           calculation chart
Steps for Analyzing a Rhythm Strip
• Step 4:
  – Determine the regularity of the rhythm (pattern)
     • Measure the distance between two consecutive QRS’s
       and compare that distance with the other R-R intervals
     • If the rhythm is regular, the R-R intervals will be the
       same
Steps for Analyzing a Rhythm Strip
• Step 5:
  – Measure the PR intervals
     • Count the number of small boxes from the beginning of
       the P wave to the beginning of the QRS
     • Multiply this number by 0.04 seconds
     • The PR intervals should all be the same and measure
       0.12 to 0.20 seconds
Steps for Analyzing a Rhythm Strip
• Step 6:
  – Measure the QT interval
     • Count the number of small boxes from the beginning of
       the Q wave to the end of the T wave
     • Multiply this number by 0.04 seconds
     • 0.36 to 0.44 seconds or 9 to 11 small boxes for normal
       range
Steps for Analyzing a Rhythm Strip
• Step 7:
  – Compare your findings to what is normal for the
    patient

More Related Content

What's hot

Electrolytes imbalance and ECG changes presentation 2005
Electrolytes imbalance and ECG changes presentation 2005Electrolytes imbalance and ECG changes presentation 2005
Electrolytes imbalance and ECG changes presentation 2005
Idrees Muhammad
 
ECG
ECGECG
Lec 14 basic ecg interpretation for mohs
Lec 14 basic ecg interpretation for mohsLec 14 basic ecg interpretation for mohs
Lec 14 basic ecg interpretation for mohs
EhealthMoHS
 
ECG: Pericarditis
ECG: PericarditisECG: Pericarditis
Junctional Rhythms - BMH/Tele
Junctional Rhythms - BMH/TeleJunctional Rhythms - BMH/Tele
Junctional Rhythms - BMH/Tele
TeleClinEd
 
Electrocardiogram in myocardial infarction
Electrocardiogram in myocardial infarction Electrocardiogram in myocardial infarction
Electrocardiogram in myocardial infarction
Ramachandra Barik
 
ECG Interpretation
ECG InterpretationECG Interpretation
ECG Interpretation
Kannan Chinnasamy
 
Normal sinus rhythm
Normal sinus rhythmNormal sinus rhythm
Normal sinus rhythm
Ann Bentley
 
Bradycardias and conduction defects
Bradycardias and conduction defectsBradycardias and conduction defects
Bradycardias and conduction defects
AayushPokharel10
 
ATRIAL ARRHYTHMIAS
ATRIAL ARRHYTHMIASATRIAL ARRHYTHMIAS
ATRIAL ARRHYTHMIAS
BabieChong Haokip
 
Introduction to Electrocardiography
Introduction to ElectrocardiographyIntroduction to Electrocardiography
Introduction to Electrocardiography
Ranjeet Dalvi
 
Basics of ECG
Basics of ECGBasics of ECG
Basics of ECG
raghwender.singh
 
Ventricular tachycardia
Ventricular tachycardiaVentricular tachycardia
Ventricular tachycardia
Apollo Hospitals
 
Dr hardik temporary pacemaker preview (1)
Dr hardik temporary pacemaker  preview (1)Dr hardik temporary pacemaker  preview (1)
Dr hardik temporary pacemaker preview (1)
Hardik Patel
 
The secret of ECG
The secret of ECG The secret of ECG
The secret of ECG
Imtinan Barnawi
 
Pulmonaryembolism final
Pulmonaryembolism finalPulmonaryembolism final
Ecg & arrhythmias
Ecg & arrhythmiasEcg & arrhythmias
Ecg changes in mi
Ecg changes in miEcg changes in mi
Ecg changes in mi
Indhu Reddy
 
Tricuspid valve
Tricuspid valveTricuspid valve
Tricuspid valve
Ramachandra Barik
 
ECG Analysis
ECG AnalysisECG Analysis
ECG Analysis
SCGH ED CME
 

What's hot (20)

Electrolytes imbalance and ECG changes presentation 2005
Electrolytes imbalance and ECG changes presentation 2005Electrolytes imbalance and ECG changes presentation 2005
Electrolytes imbalance and ECG changes presentation 2005
 
ECG
ECGECG
ECG
 
Lec 14 basic ecg interpretation for mohs
Lec 14 basic ecg interpretation for mohsLec 14 basic ecg interpretation for mohs
Lec 14 basic ecg interpretation for mohs
 
ECG: Pericarditis
ECG: PericarditisECG: Pericarditis
ECG: Pericarditis
 
Junctional Rhythms - BMH/Tele
Junctional Rhythms - BMH/TeleJunctional Rhythms - BMH/Tele
Junctional Rhythms - BMH/Tele
 
Electrocardiogram in myocardial infarction
Electrocardiogram in myocardial infarction Electrocardiogram in myocardial infarction
Electrocardiogram in myocardial infarction
 
ECG Interpretation
ECG InterpretationECG Interpretation
ECG Interpretation
 
Normal sinus rhythm
Normal sinus rhythmNormal sinus rhythm
Normal sinus rhythm
 
Bradycardias and conduction defects
Bradycardias and conduction defectsBradycardias and conduction defects
Bradycardias and conduction defects
 
ATRIAL ARRHYTHMIAS
ATRIAL ARRHYTHMIASATRIAL ARRHYTHMIAS
ATRIAL ARRHYTHMIAS
 
Introduction to Electrocardiography
Introduction to ElectrocardiographyIntroduction to Electrocardiography
Introduction to Electrocardiography
 
Basics of ECG
Basics of ECGBasics of ECG
Basics of ECG
 
Ventricular tachycardia
Ventricular tachycardiaVentricular tachycardia
Ventricular tachycardia
 
Dr hardik temporary pacemaker preview (1)
Dr hardik temporary pacemaker  preview (1)Dr hardik temporary pacemaker  preview (1)
Dr hardik temporary pacemaker preview (1)
 
The secret of ECG
The secret of ECG The secret of ECG
The secret of ECG
 
Pulmonaryembolism final
Pulmonaryembolism finalPulmonaryembolism final
Pulmonaryembolism final
 
Ecg & arrhythmias
Ecg & arrhythmiasEcg & arrhythmias
Ecg & arrhythmias
 
Ecg changes in mi
Ecg changes in miEcg changes in mi
Ecg changes in mi
 
Tricuspid valve
Tricuspid valveTricuspid valve
Tricuspid valve
 
ECG Analysis
ECG AnalysisECG Analysis
ECG Analysis
 

Viewers also liked

Ecg 2
Ecg 2Ecg 2
ECG Basics
ECG BasicsECG Basics
ECG Basics
Harith Shoole
 
ECGpedia - ECG Presentation
ECGpedia - ECG PresentationECGpedia - ECG Presentation
ECGpedia - ECG Presentation
DR YONG & ASSOCIATES Family Health
 
ECG Basics
ECG BasicsECG Basics
Ecg usm
Ecg   usmEcg   usm
Ecg reading
Ecg readingEcg reading
Ecg reading
hoshmand-ali
 
Stemi equivalents
Stemi equivalentsStemi equivalents
Stemi equivalents
Mohamed Hamoda
 
ECG
ECGECG
Electrocardiography for Students
Electrocardiography for StudentsElectrocardiography for Students
Electrocardiography for Students
Prof. Dr. Aswinikumar Surendran
 
Focused Cardiac Ultrasound
Focused Cardiac UltrasoundFocused Cardiac Ultrasound
Focused Cardiac Ultrasound
Sun Yai-Cheng
 
Chapter 10 - 12 lead Interpretation - Part 2
Chapter 10 - 12 lead Interpretation - Part 2Chapter 10 - 12 lead Interpretation - Part 2
Chapter 10 - 12 lead Interpretation - Part 2
ryanhall911
 
ECG changes in myocardial Ischemia and injury
ECG changes in myocardial Ischemia and injuryECG changes in myocardial Ischemia and injury
ECG changes in myocardial Ischemia and injury
Sarah Sreekanth
 
Electrocardiogram (ECG or EKG)
Electrocardiogram (ECG or EKG)Electrocardiogram (ECG or EKG)
Electrocardiogram (ECG or EKG)
Minh Anh Nguyen
 
How to read ECG
How to read ECGHow to read ECG
How to read ECG
Satyanarayana Naidu
 
ECG in Emergency Department - Advances in ACS ECG
ECG in Emergency Department - Advances in ACS ECGECG in Emergency Department - Advances in ACS ECG
ECG in Emergency Department - Advances in ACS ECG
Dr.Mahmoud Abbas
 
Electrocardiogaram - ECG EKG
Electrocardiogaram - ECG EKGElectrocardiogaram - ECG EKG
Electrocardiogaram - ECG EKG
Fuad Farooq
 
Step3 Tutorial by SWU book1
Step3 Tutorial by SWU book1Step3 Tutorial by SWU book1
Step3 Tutorial by SWU book1vora kun
 
ECG
ECGECG
Cardiac Electrophysiology
Cardiac ElectrophysiologyCardiac Electrophysiology
Cardiac Electrophysiology
TeleClinEd
 
ECG
ECGECG

Viewers also liked (20)

Ecg 2
Ecg 2Ecg 2
Ecg 2
 
ECG Basics
ECG BasicsECG Basics
ECG Basics
 
ECGpedia - ECG Presentation
ECGpedia - ECG PresentationECGpedia - ECG Presentation
ECGpedia - ECG Presentation
 
ECG Basics
ECG BasicsECG Basics
ECG Basics
 
Ecg usm
Ecg   usmEcg   usm
Ecg usm
 
Ecg reading
Ecg readingEcg reading
Ecg reading
 
Stemi equivalents
Stemi equivalentsStemi equivalents
Stemi equivalents
 
ECG
ECGECG
ECG
 
Electrocardiography for Students
Electrocardiography for StudentsElectrocardiography for Students
Electrocardiography for Students
 
Focused Cardiac Ultrasound
Focused Cardiac UltrasoundFocused Cardiac Ultrasound
Focused Cardiac Ultrasound
 
Chapter 10 - 12 lead Interpretation - Part 2
Chapter 10 - 12 lead Interpretation - Part 2Chapter 10 - 12 lead Interpretation - Part 2
Chapter 10 - 12 lead Interpretation - Part 2
 
ECG changes in myocardial Ischemia and injury
ECG changes in myocardial Ischemia and injuryECG changes in myocardial Ischemia and injury
ECG changes in myocardial Ischemia and injury
 
Electrocardiogram (ECG or EKG)
Electrocardiogram (ECG or EKG)Electrocardiogram (ECG or EKG)
Electrocardiogram (ECG or EKG)
 
How to read ECG
How to read ECGHow to read ECG
How to read ECG
 
ECG in Emergency Department - Advances in ACS ECG
ECG in Emergency Department - Advances in ACS ECGECG in Emergency Department - Advances in ACS ECG
ECG in Emergency Department - Advances in ACS ECG
 
Electrocardiogaram - ECG EKG
Electrocardiogaram - ECG EKGElectrocardiogaram - ECG EKG
Electrocardiogaram - ECG EKG
 
Step3 Tutorial by SWU book1
Step3 Tutorial by SWU book1Step3 Tutorial by SWU book1
Step3 Tutorial by SWU book1
 
ECG
ECGECG
ECG
 
Cardiac Electrophysiology
Cardiac ElectrophysiologyCardiac Electrophysiology
Cardiac Electrophysiology
 
ECG
ECGECG
ECG
 

Similar to Understanding rhythm strips

EKG analysis.ppt
EKG analysis.pptEKG analysis.ppt
EKG analysis.ppt
GEDIONZERIHUN1
 
Basic of ECG Referesher Course
Basic of ECG Referesher CourseBasic of ECG Referesher Course
Basic of ECG Referesher Course
Ame Mehadi
 
Basic EKG and Rhythm Interpretation Symposia - The CRUDEM Foundation
Basic EKG and Rhythm Interpretation Symposia - The CRUDEM FoundationBasic EKG and Rhythm Interpretation Symposia - The CRUDEM Foundation
Basic EKG and Rhythm Interpretation Symposia - The CRUDEM Foundation
The CRUDEM Foundation
 
An overview of paediatric ECG
An overview of paediatric ECG An overview of paediatric ECG
An overview of paediatric ECG
Sid Kaithakkoden
 
Ecg 5th year 2016
Ecg 5th year 2016Ecg 5th year 2016
Ecg 5th year 2016
Yousef Biuk
 
Final Introto Cardiac Pdf
Final Introto Cardiac PdfFinal Introto Cardiac Pdf
Final Introto Cardiac Pdf
ErikaLVN
 
Final introtocardiac pdf
Final introtocardiac pdfFinal introtocardiac pdf
Final introtocardiac pdf
ErikaLVN
 
Basic ECG
Basic ECGBasic ECG
Basic ECG
MEEQAT HOSPITAL
 
Ecg presentation1
Ecg presentation1Ecg presentation1
Ecg presentation1
University of Gondar
 
Basic of ecg_dr nazmun
Basic of ecg_dr nazmunBasic of ecg_dr nazmun
Basic of ecg_dr nazmun
Nazmun Ara
 
ECG REview.pdf
ECG REview.pdfECG REview.pdf
ECG REview.pdf
Jagan53828
 
Basic-EKG-Refresher.pdf
Basic-EKG-Refresher.pdfBasic-EKG-Refresher.pdf
Basic-EKG-Refresher.pdf
IkeDivinagracia1
 
Normal ecg interpretation
Normal ecg interpretationNormal ecg interpretation
Normal ecg interpretation
Subhashini N
 
Cardiac Arrhythmias (2).pdf for nursing student
Cardiac Arrhythmias (2).pdf for nursing studentCardiac Arrhythmias (2).pdf for nursing student
Cardiac Arrhythmias (2).pdf for nursing student
fahmyahmed789
 
simple ecg learningMEM.pptx
simple ecg learningMEM.pptxsimple ecg learningMEM.pptx
simple ecg learningMEM.pptx
Dr'manas Pandey
 
4- ECG.ppt
4- ECG.ppt4- ECG.ppt
4- ECG.ppt
mostafasayed645609
 
Ecg interpretation
Ecg interpretationEcg interpretation
Ecg interpretation
Sudhir Dev
 
Interpretation of ECG lab session.ppt
Interpretation of ECG  lab session.pptInterpretation of ECG  lab session.ppt
Interpretation of ECG lab session.ppt
Dr Rajesh Chandra Sharma
 
ECG details- for Students
ECG details- for StudentsECG details- for Students
normalecginterpretation in human heart ppt
normalecginterpretation in human heart pptnormalecginterpretation in human heart ppt
normalecginterpretation in human heart ppt
VAIBHAVBHASTANA
 

Similar to Understanding rhythm strips (20)

EKG analysis.ppt
EKG analysis.pptEKG analysis.ppt
EKG analysis.ppt
 
Basic of ECG Referesher Course
Basic of ECG Referesher CourseBasic of ECG Referesher Course
Basic of ECG Referesher Course
 
Basic EKG and Rhythm Interpretation Symposia - The CRUDEM Foundation
Basic EKG and Rhythm Interpretation Symposia - The CRUDEM FoundationBasic EKG and Rhythm Interpretation Symposia - The CRUDEM Foundation
Basic EKG and Rhythm Interpretation Symposia - The CRUDEM Foundation
 
An overview of paediatric ECG
An overview of paediatric ECG An overview of paediatric ECG
An overview of paediatric ECG
 
Ecg 5th year 2016
Ecg 5th year 2016Ecg 5th year 2016
Ecg 5th year 2016
 
Final Introto Cardiac Pdf
Final Introto Cardiac PdfFinal Introto Cardiac Pdf
Final Introto Cardiac Pdf
 
Final introtocardiac pdf
Final introtocardiac pdfFinal introtocardiac pdf
Final introtocardiac pdf
 
Basic ECG
Basic ECGBasic ECG
Basic ECG
 
Ecg presentation1
Ecg presentation1Ecg presentation1
Ecg presentation1
 
Basic of ecg_dr nazmun
Basic of ecg_dr nazmunBasic of ecg_dr nazmun
Basic of ecg_dr nazmun
 
ECG REview.pdf
ECG REview.pdfECG REview.pdf
ECG REview.pdf
 
Basic-EKG-Refresher.pdf
Basic-EKG-Refresher.pdfBasic-EKG-Refresher.pdf
Basic-EKG-Refresher.pdf
 
Normal ecg interpretation
Normal ecg interpretationNormal ecg interpretation
Normal ecg interpretation
 
Cardiac Arrhythmias (2).pdf for nursing student
Cardiac Arrhythmias (2).pdf for nursing studentCardiac Arrhythmias (2).pdf for nursing student
Cardiac Arrhythmias (2).pdf for nursing student
 
simple ecg learningMEM.pptx
simple ecg learningMEM.pptxsimple ecg learningMEM.pptx
simple ecg learningMEM.pptx
 
4- ECG.ppt
4- ECG.ppt4- ECG.ppt
4- ECG.ppt
 
Ecg interpretation
Ecg interpretationEcg interpretation
Ecg interpretation
 
Interpretation of ECG lab session.ppt
Interpretation of ECG  lab session.pptInterpretation of ECG  lab session.ppt
Interpretation of ECG lab session.ppt
 
ECG details- for Students
ECG details- for StudentsECG details- for Students
ECG details- for Students
 
normalecginterpretation in human heart ppt
normalecginterpretation in human heart pptnormalecginterpretation in human heart ppt
normalecginterpretation in human heart ppt
 

More from Ann Bentley

Things you can do on facebook
Things you can do on facebookThings you can do on facebook
Things you can do on facebookAnn Bentley
 
Chapter 18 common drugs
Chapter 18 common drugsChapter 18 common drugs
Chapter 18 common drugs
Ann Bentley
 
Chapter 17 other environments
Chapter 17 other environmentsChapter 17 other environments
Chapter 17 other environments
Ann Bentley
 
Chapter 16 hospital pharmacy
Chapter 16 hospital pharmacyChapter 16 hospital pharmacy
Chapter 16 hospital pharmacy
Ann Bentley
 
Chapter 15 community pharmacy
Chapter 15 community pharmacyChapter 15 community pharmacy
Chapter 15 community pharmacy
Ann Bentley
 
Chapter 14 financial issues
Chapter 14 financial issuesChapter 14 financial issues
Chapter 14 financial issues
Ann Bentley
 
Chapter 13 inventory management
Chapter 13 inventory managementChapter 13 inventory management
Chapter 13 inventory management
Ann Bentley
 
Chapter 12 information
Chapter 12 informationChapter 12 information
Chapter 12 information
Ann Bentley
 
Chapter 11 human variability
Chapter 11 human variabilityChapter 11 human variability
Chapter 11 human variability
Ann Bentley
 
Chapter 10 basic pharmaceutics
Chapter 10 basic pharmaceuticsChapter 10 basic pharmaceutics
Chapter 10 basic pharmaceutics
Ann Bentley
 
Chapter 9 compounding
Chapter 9 compoundingChapter 9 compounding
Chapter 9 compounding
Ann Bentley
 
Chapter 8 parenterals
Chapter 8 parenteralsChapter 8 parenterals
Chapter 8 parenterals
Ann Bentley
 
Chapter 7 route and formulations
Chapter 7 route and formulationsChapter 7 route and formulations
Chapter 7 route and formulations
Ann Bentley
 
Chapter 6 pharmacy calculation
Chapter 6 pharmacy calculationChapter 6 pharmacy calculation
Chapter 6 pharmacy calculation
Ann Bentley
 
Chapter 5 prescriptions
Chapter 5 prescriptionsChapter 5 prescriptions
Chapter 5 prescriptions
Ann Bentley
 
Chapter 4 terminology
Chapter 4 terminologyChapter 4 terminology
Chapter 4 terminology
Ann Bentley
 
Chapter 3 drug regulation and control
Chapter 3 drug regulation and controlChapter 3 drug regulation and control
Chapter 3 drug regulation and control
Ann Bentley
 
Chapter 2 the pharmacy technician
Chapter 2 the pharmacy technicianChapter 2 the pharmacy technician
Chapter 2 the pharmacy technician
Ann Bentley
 
Chapter 1 pharmacy and health care
Chapter 1 pharmacy and health careChapter 1 pharmacy and health care
Chapter 1 pharmacy and health care
Ann Bentley
 
L41 slides
L41 slidesL41 slides
L41 slides
Ann Bentley
 

More from Ann Bentley (20)

Things you can do on facebook
Things you can do on facebookThings you can do on facebook
Things you can do on facebook
 
Chapter 18 common drugs
Chapter 18 common drugsChapter 18 common drugs
Chapter 18 common drugs
 
Chapter 17 other environments
Chapter 17 other environmentsChapter 17 other environments
Chapter 17 other environments
 
Chapter 16 hospital pharmacy
Chapter 16 hospital pharmacyChapter 16 hospital pharmacy
Chapter 16 hospital pharmacy
 
Chapter 15 community pharmacy
Chapter 15 community pharmacyChapter 15 community pharmacy
Chapter 15 community pharmacy
 
Chapter 14 financial issues
Chapter 14 financial issuesChapter 14 financial issues
Chapter 14 financial issues
 
Chapter 13 inventory management
Chapter 13 inventory managementChapter 13 inventory management
Chapter 13 inventory management
 
Chapter 12 information
Chapter 12 informationChapter 12 information
Chapter 12 information
 
Chapter 11 human variability
Chapter 11 human variabilityChapter 11 human variability
Chapter 11 human variability
 
Chapter 10 basic pharmaceutics
Chapter 10 basic pharmaceuticsChapter 10 basic pharmaceutics
Chapter 10 basic pharmaceutics
 
Chapter 9 compounding
Chapter 9 compoundingChapter 9 compounding
Chapter 9 compounding
 
Chapter 8 parenterals
Chapter 8 parenteralsChapter 8 parenterals
Chapter 8 parenterals
 
Chapter 7 route and formulations
Chapter 7 route and formulationsChapter 7 route and formulations
Chapter 7 route and formulations
 
Chapter 6 pharmacy calculation
Chapter 6 pharmacy calculationChapter 6 pharmacy calculation
Chapter 6 pharmacy calculation
 
Chapter 5 prescriptions
Chapter 5 prescriptionsChapter 5 prescriptions
Chapter 5 prescriptions
 
Chapter 4 terminology
Chapter 4 terminologyChapter 4 terminology
Chapter 4 terminology
 
Chapter 3 drug regulation and control
Chapter 3 drug regulation and controlChapter 3 drug regulation and control
Chapter 3 drug regulation and control
 
Chapter 2 the pharmacy technician
Chapter 2 the pharmacy technicianChapter 2 the pharmacy technician
Chapter 2 the pharmacy technician
 
Chapter 1 pharmacy and health care
Chapter 1 pharmacy and health careChapter 1 pharmacy and health care
Chapter 1 pharmacy and health care
 
L41 slides
L41 slidesL41 slides
L41 slides
 

Understanding rhythm strips

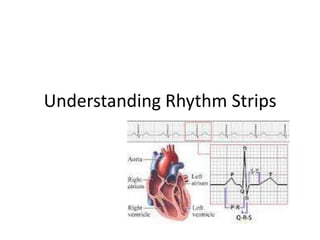
  • 2. Waveforms and Components of The ECG Pattern • A waveform – A positive or a negative defection that begins and ends at the baseline – It is an electrical representation of depolarization and repolarization occurring in the heart • When there is NO electrical activity is detected, a straight line (isoelectric or base line) is recorded • The waveforms produced by the heart’s electrical conduction system are called – P – QRS – T – May or may not be a U Wave
  • 3. ECG Waveforms • P wave – Occurs when the right and left atria are stimulated • QRS complex – Occurs when the right and left ventricles are stimulated • T wave – Represents electrical recovery or return to a resting state for the ventricles • U wave – If see, is thought to represent the repolarization of the Purkinje fibers
  • 4. ECG Waveforms • P wave – Normally an upright and rounded waveform • QRS complex – Usually the largest of all the waveforms and is spike shaped and narrow in appearance • T wave – Appears as a slightly asymmetric upright waveform – It is usually larger than the P wave and smaller than the QRS
  • 7. ECG Segments • Segment – Length of baseline between two waves • PR segment – Represents the delay of the impulse in the AV node • ST segment – Represents the early part of repolarization of the right and left ventricles
  • 8. ECG Intervals • Interval is defined as the combination of a wave or several waves and a segment • By measuring time intervals on the ECG, it can be determined how long the electrical wave takes to pass through the heart
  • 9. ECG Intervals • PR interval – P wave & PR segment – Corresponds to the spread of the electrical impulse through the atria and the delay of the impulse in the AV node before it travels to the ventricular muscle tissue • QT interval – QRS complex & ST segment & T wave – Represents electrical stimulation and recovery of the ventricles
  • 10. ECG Segments & Intervals
  • 11. ECG Paper and Measurements • ECG paper – Graph paper used to measure rates of impulse formation and the duration of the electrical events that occur in the heart – Vertical and horizontal lines, which from large and small boxes – Vertical lines • Measure voltage in millivolts – Horizontal lines • Measure time in seconds
  • 12. ECG Paper and Measurements • By counting the small or large boxes from the beginning to the end of the ECG waveforms and intervals, we can calculate the time it takes for the electricity to travel through certain parts of the heart and the rate at which impulses occur
  • 13. ECG Paper and Measurements Time Equivalents of Small Boxes Time Equivalents of Large Boxes • 1 small box = 0.04 second • 1 large box = 0.20 second • 2 small boxes = 0.08 second • 5 large boxes = 1 second • 3 small boxes = 0.12 second • 15 large boxes = 3 seconds • 4 small boxes = 0.16 second • 30 large boxes = 6 seconds • 5 small boxes = 0.20 second
  • 14. Normal ECG Pattern and Measurements • P Wave: Upright, smooth and rounded, and no more than 2.5 mm in height
  • 15. Normal ECG Pattern and Measurements • PR Interval: Measure 0.12 to 0.20 second wide or 3 to 5 small boxes
  • 16. Normal ECG Pattern and Measurements • QRS: Narrow in appearance, upright in Leads I, II, and III. Measures 0.04 to 0.11 second wide or 1 to 2 ½ small boxes
  • 17. Normal ECG Pattern and Measurements • ST Segment: Isoelectric
  • 18. Normal ECG Pattern and Measurements • T Wave: Slightly asymmetric, upright, and less than half the height of the QRS complex or 5 mm in height or less
  • 19. Normal ECG Pattern and Measurements • QT interval: QT interval is less than half the R- R interval or 0.36 to 0.44 seconds or 9 to 11 small boxes – The duration of the QT interval varies according to age, gender, and heart rate • As the heart rate increases – QT interval decreases • As the heart rate decreases – QT interval increases
  • 20. Normal ECG Pattern and Measurements • QT Interval – Fast heart rate • Small QT interval – Slow heart rate • Large QT interval
  • 21. Normal ECG Pattern and Measurements • U Wave: Upright and rounded. Usually less than 2 mm in height and smaller than that of the preceding T wave
  • 22. Abnormal Characteristics of the ECG Pattern • Abnormal P wave – Wide or notched-Left atrial enlargement or ectopic impulse from atria – Tall and pointed (peaked) – Right atrial enlargement or ectopic impulse from atria – Negative (Inverted) - ectopic pacemaker in the AV junction
  • 23. Abnormal Characteristics of the ECG Pattern • Wide or notched • Tall and pointed (peaked) • Negative (inverted)
  • 24. Abnormal Characteristics of the ECG Pattern • Abnormal PR Interval – A PR interval greater than 0.20 second wide is abnormal – This may be seen in • AV blocks • Hypothyroidism • Digitalis toxicity
  • 25. Abnormal Characteristics of the ECG Pattern • Abnormal QRS complex: – A wide QRS (greater than 0.12 second wide) • may be seen when an impulse originates from an ectopic site in the ventricular myocardium • If there is a delay or block of the impulse in the bundle branches
  • 26. Abnormal Characteristics of the ECG Pattern • Abnormal ST segment – Elevated ST segment • Elevated more than 1 mm in the limb leads or 2 mm in the precordial leads – Suggestive of myocardial injury » infarction
  • 27. Abnormal Characteristics of the ECG Pattern • Abnormal ST segment – Scoop ST depression • May be caused by digitalis toxicity – Depressed ST segment • More than 1 mm – Suggestive of myocardial ischemia
  • 28. Abnormal Characteristics of the ECG Pattern • Abnormal T wave – Negative (inverted) • Suggest myocardial ischemia or infarction
  • 29. Abnormal Characteristics of the ECG Pattern • Abnormal T wave – Low, flattened T waves • Can be seen with hypokalemia (low potassium)
  • 30. Abnormal Characteristics of the ECG Pattern • Abnormal T Wave – Tall Tented T waves • Suggestive of hyperkalemia (high potassium)
  • 31. Abnormal Characteristics of the ECG Pattern • Abnormal QT interval – Prolonged (greater than 0.44 seconds) • May be congenital or acquired – i.e. medications, electrolyte abnormalities
  • 32. Abnormal Characteristics of the ECG Pattern • Abnormal U Wave – A U wave taller than 2 mm • Electrolyte imbalance • Medications • Hyperthyroidism • Central nervous system disease
  • 33. Steps for Analyzing a Rhythm Strip • A quick method for analyzing a rhythm strip – There are several steps in analyzing a rhythm strip – When analyzing a rhythm strip, don’t forget to check the patient
  • 34. Steps for Analyzing a Rhythm Strip • Step 1: – Evaluate the P waves • Look for the presence of P waves and compare the shape and size of all P waves • All the P waves should be upright and rounded and uniform in appearance • P wave should be present before each QRS
  • 35. Steps for Analyzing a Rhythm Strip • Step 2: – Evaluate QRS Complexes • All of the QRS’s should be uniform and narrow in appearance
  • 36. Steps for Analyzing a Rhythm Strip • Step 2: continued – Measuring the QRS less than 0.12 • Begin from the point where the first wave of the complex begins to deviate from the baseline and end where the complex returns to the baseline • Count the number of small boxes and multiply by o.o4 seconds
  • 37. Steps for Analyzing a Rhythm Strip • Step 3: – Calculate the Atrial and Ventricular Heart Rates • There are a couple of methods to discuss • One will only be used by an MST – Six-Second Method
  • 38. Steps for Analyzing a Rhythm Strip • Step 3: continued – A normal heart rate in the resting adult is between 60 and 100 – A rate below 60 • bradycardia – A rate above 100 • tachycardia – The atrial rate should be the same as the ventricular rate
  • 39. Steps for Analyzing a Rhythm Strip • Step 3: continued – Six-Second Method (can be used for regular or irregular rhythm patterns) • Print off six seconds of ECG paper (use markers at the top or bottom of the paper – Atrial Rate » Count the number of P waves within a period of six seconds and multiply that number by 10 – Ventricular Rate » Count the number of QRS complexes within six seconds and multiply by 10
  • 40. Steps for Analyzing a Rhythm Strip • Step 3: continued – Small Box Method (best used if the rhythm is regular, but may be used if the rhythm is irregular and a rate range is given) • Atrial rate – Count the number of small boxes between two P waves, and find the corresponding rate on the small box calculation chart • Ventricular rate – Count the number of small boxes between two QRS complexes and find the corresponding rate on the small box calculation chart
  • 41. Steps for Analyzing a Rhythm Strip • Step 4: – Determine the regularity of the rhythm (pattern) • Measure the distance between two consecutive QRS’s and compare that distance with the other R-R intervals • If the rhythm is regular, the R-R intervals will be the same
  • 42. Steps for Analyzing a Rhythm Strip • Step 5: – Measure the PR intervals • Count the number of small boxes from the beginning of the P wave to the beginning of the QRS • Multiply this number by 0.04 seconds • The PR intervals should all be the same and measure 0.12 to 0.20 seconds
  • 43. Steps for Analyzing a Rhythm Strip • Step 6: – Measure the QT interval • Count the number of small boxes from the beginning of the Q wave to the end of the T wave • Multiply this number by 0.04 seconds • 0.36 to 0.44 seconds or 9 to 11 small boxes for normal range
  • 44. Steps for Analyzing a Rhythm Strip • Step 7: – Compare your findings to what is normal for the patient