Download as PPSX, PPTX
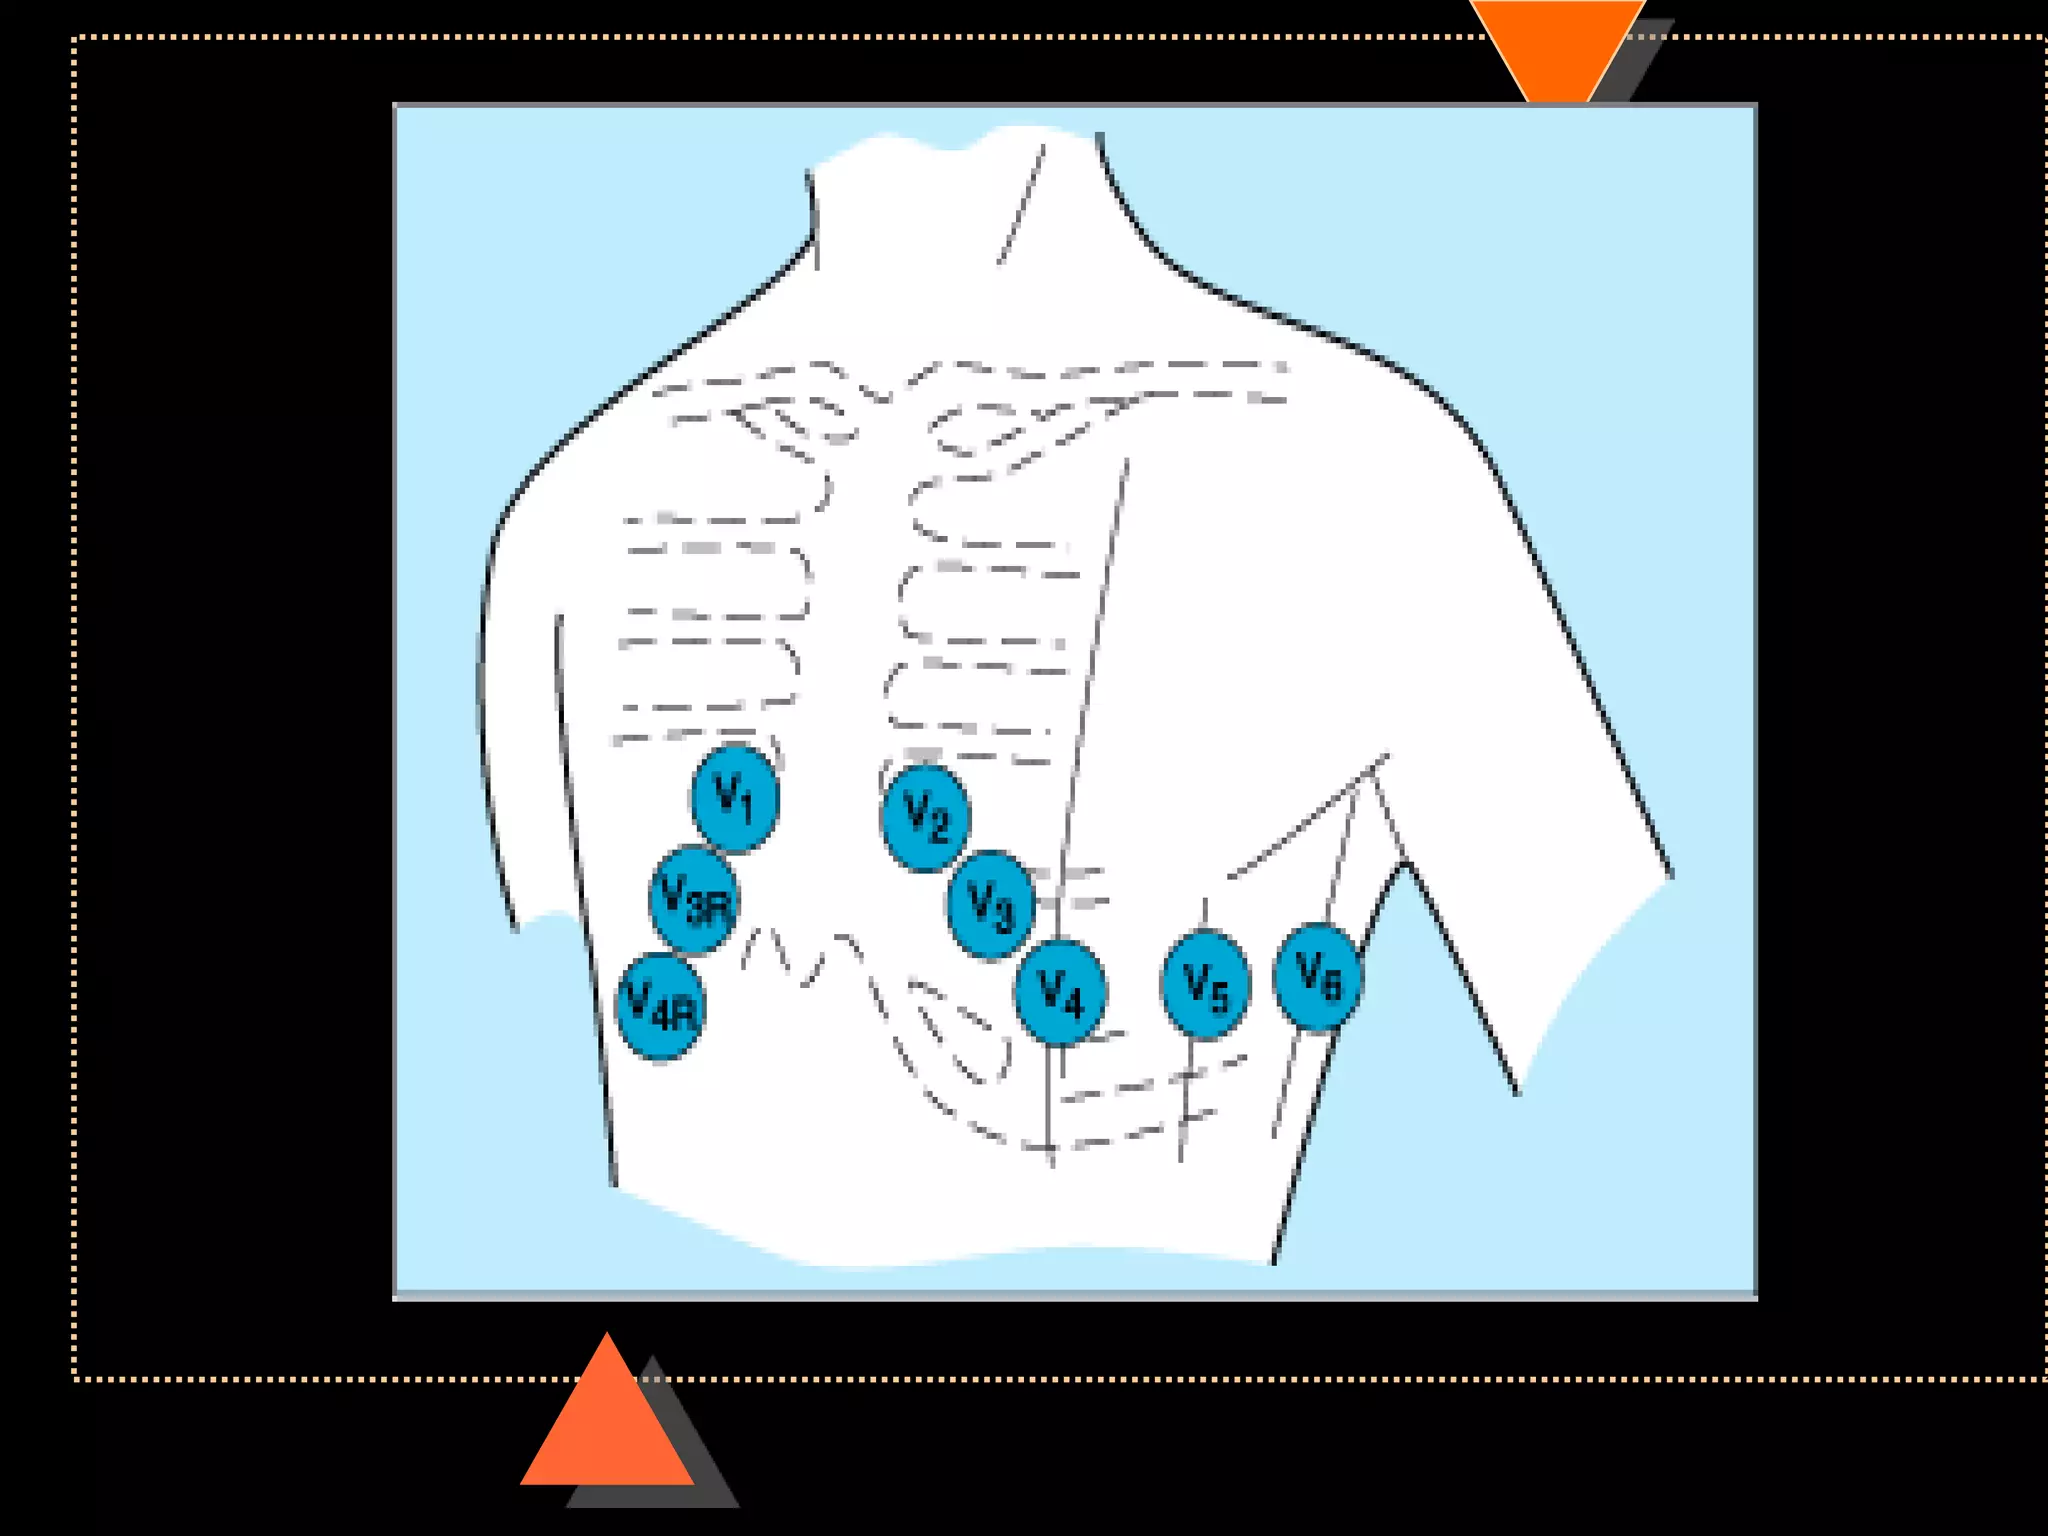
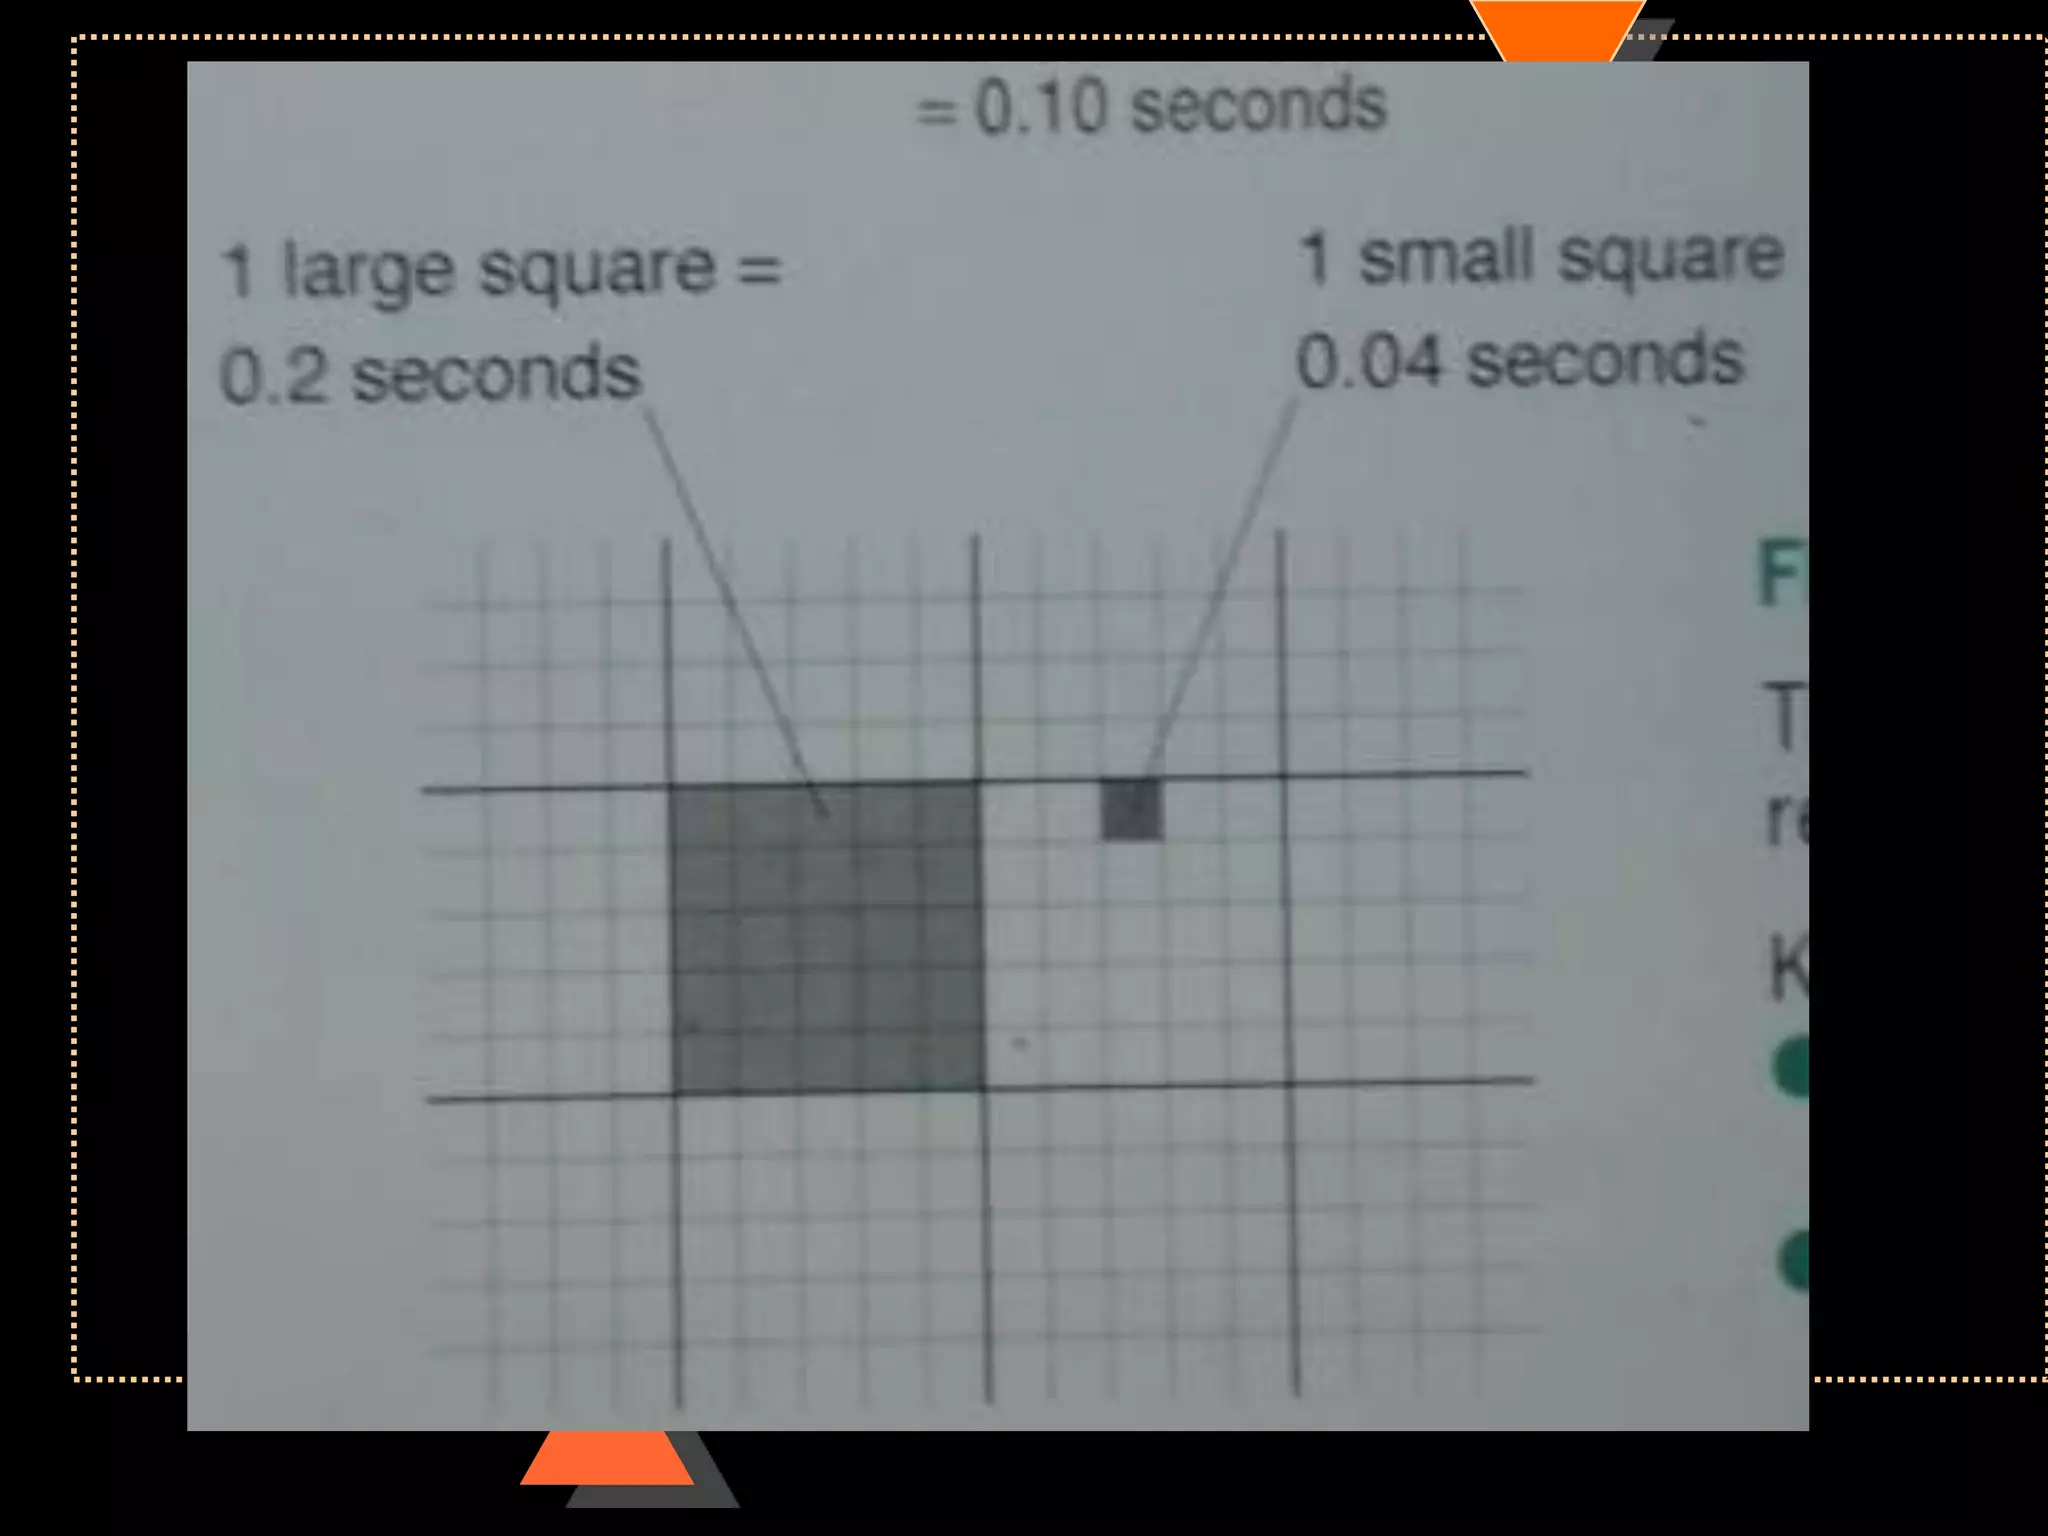
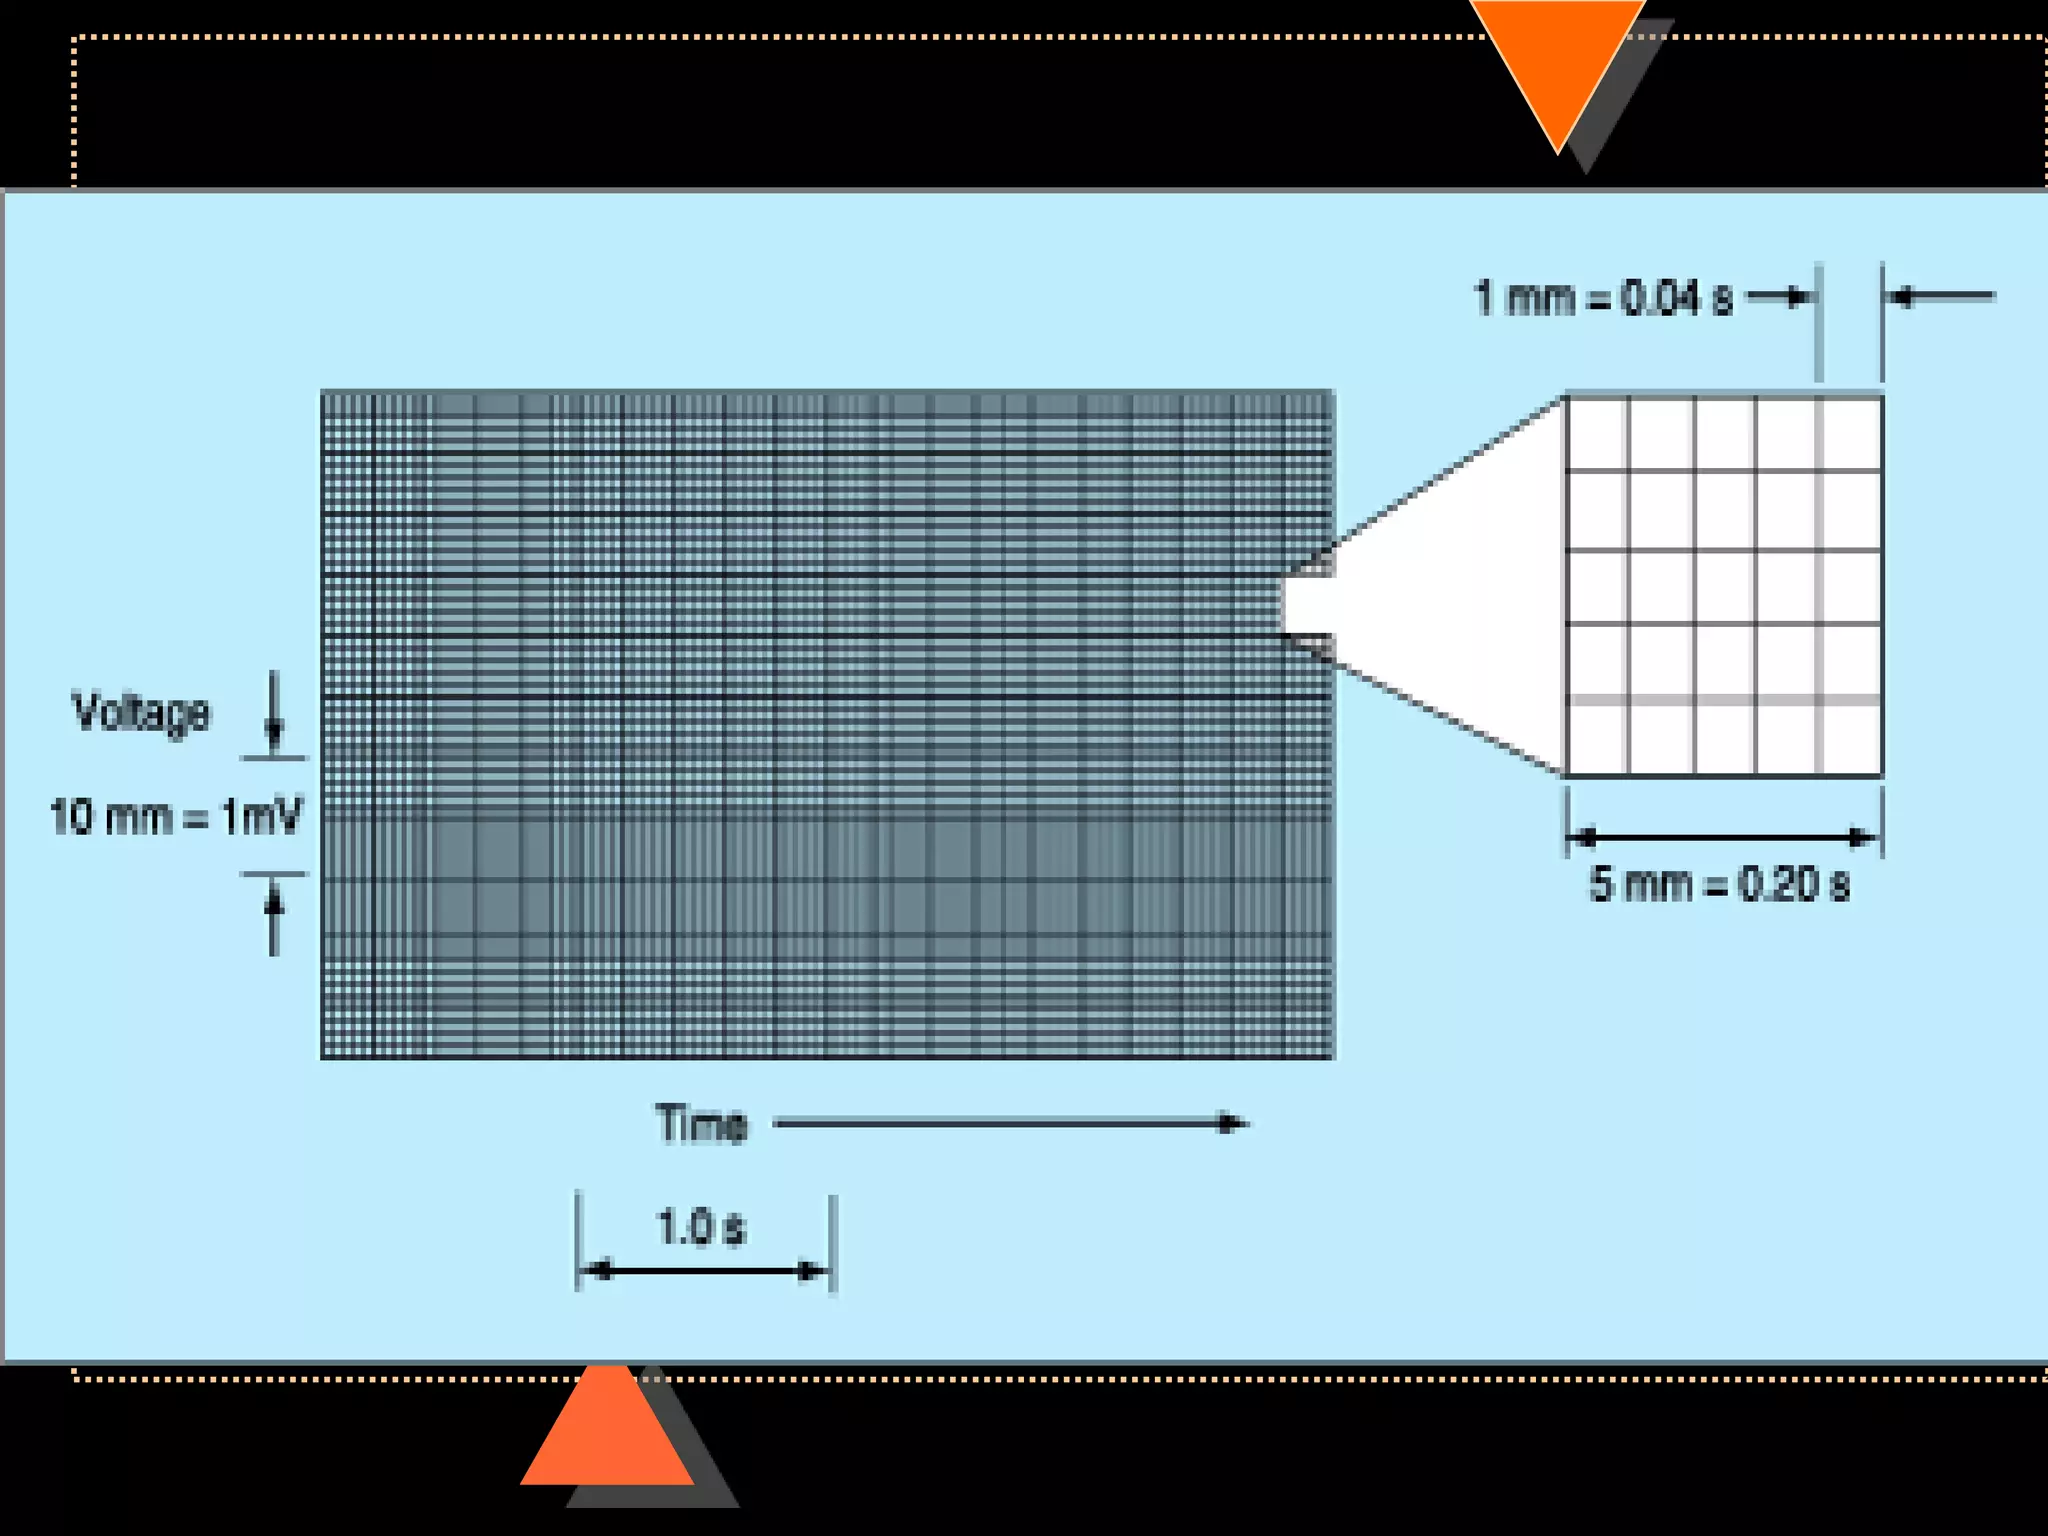
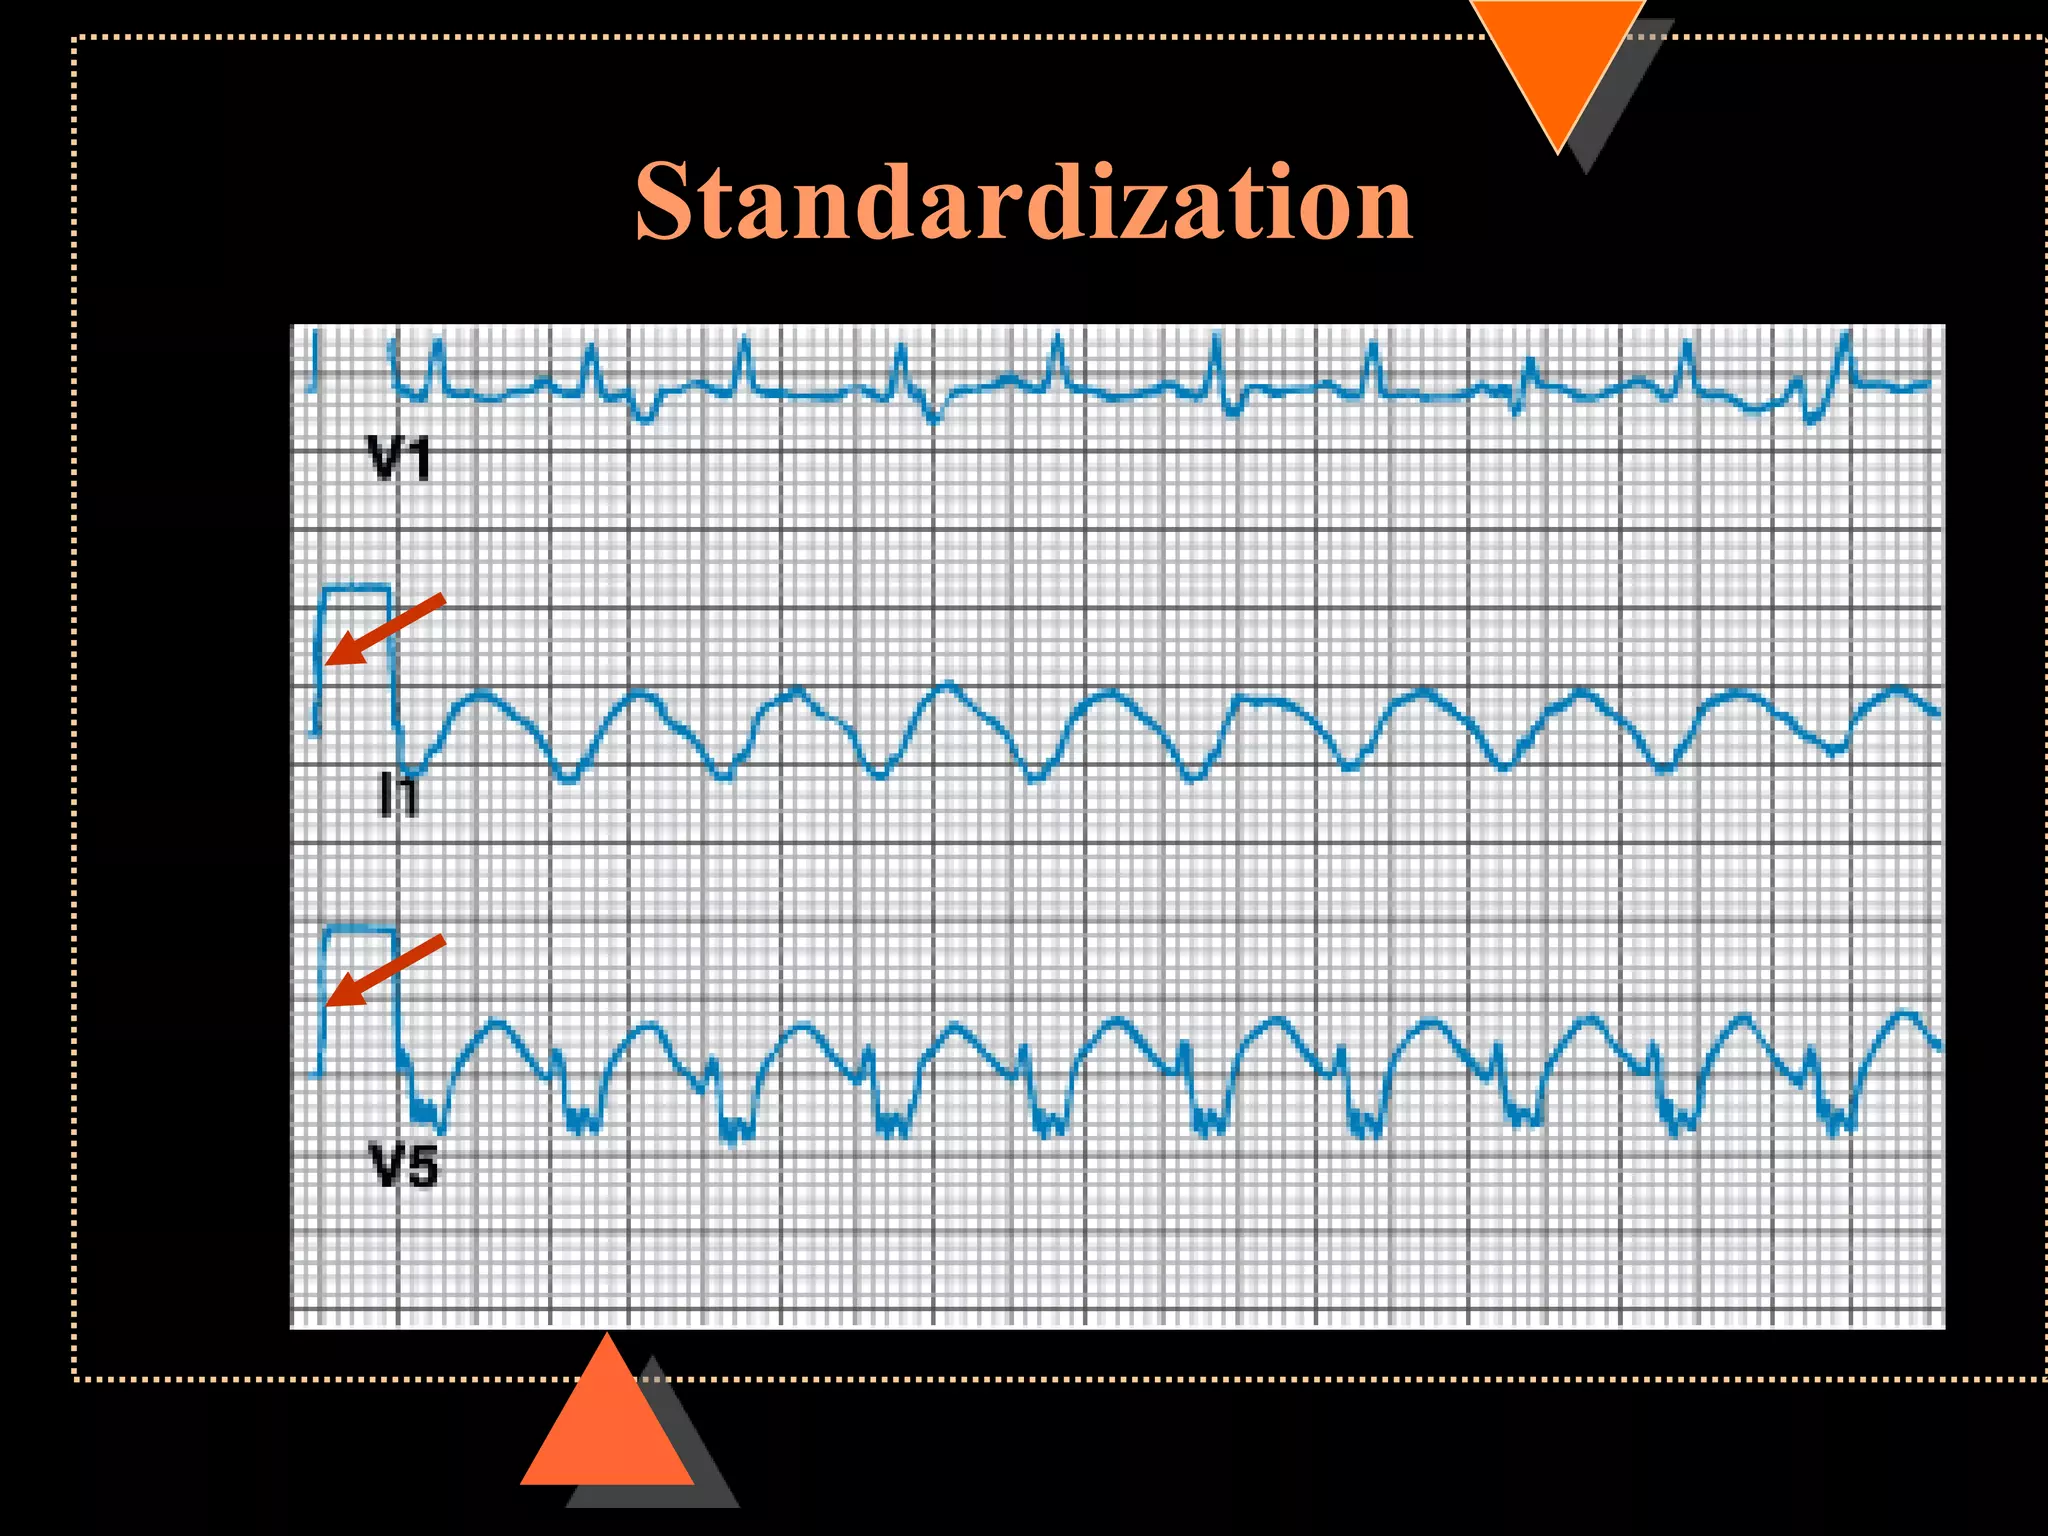
![ECG paper
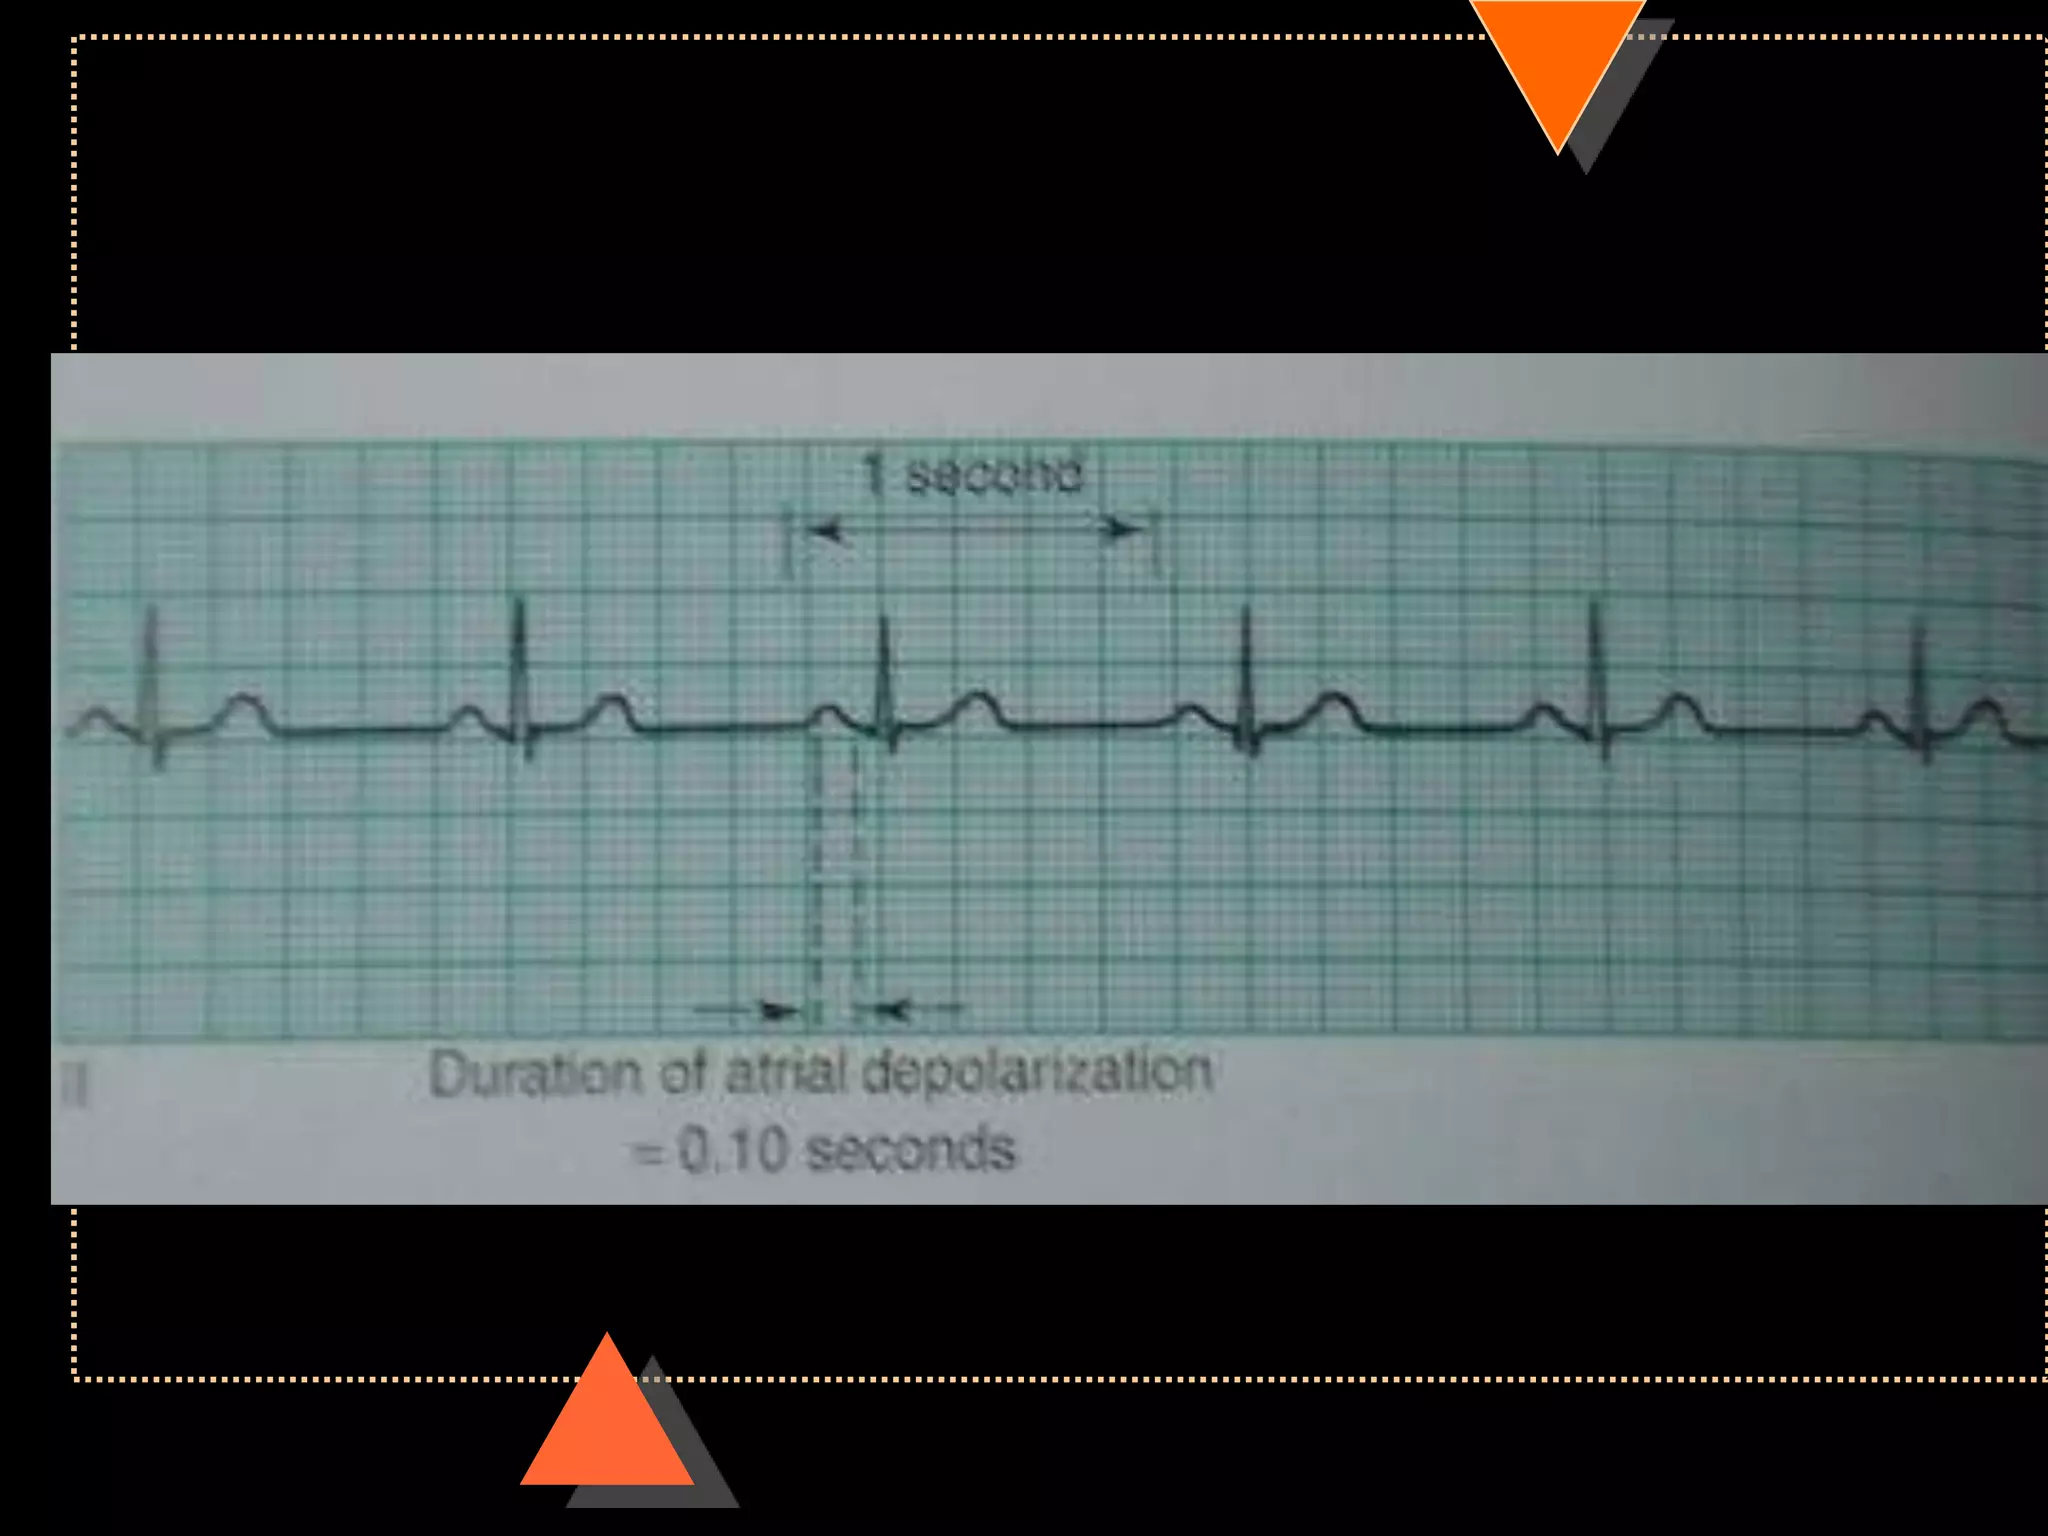
Speed 25mm/s
• 1 large square= 5 small square [5mm]
Voltage
• 10mm =1mV](https://image.slidesharecdn.com/howtoreadecg-130901100253-phpapp02/75/How-to-read-ECG-6-2048.jpg)
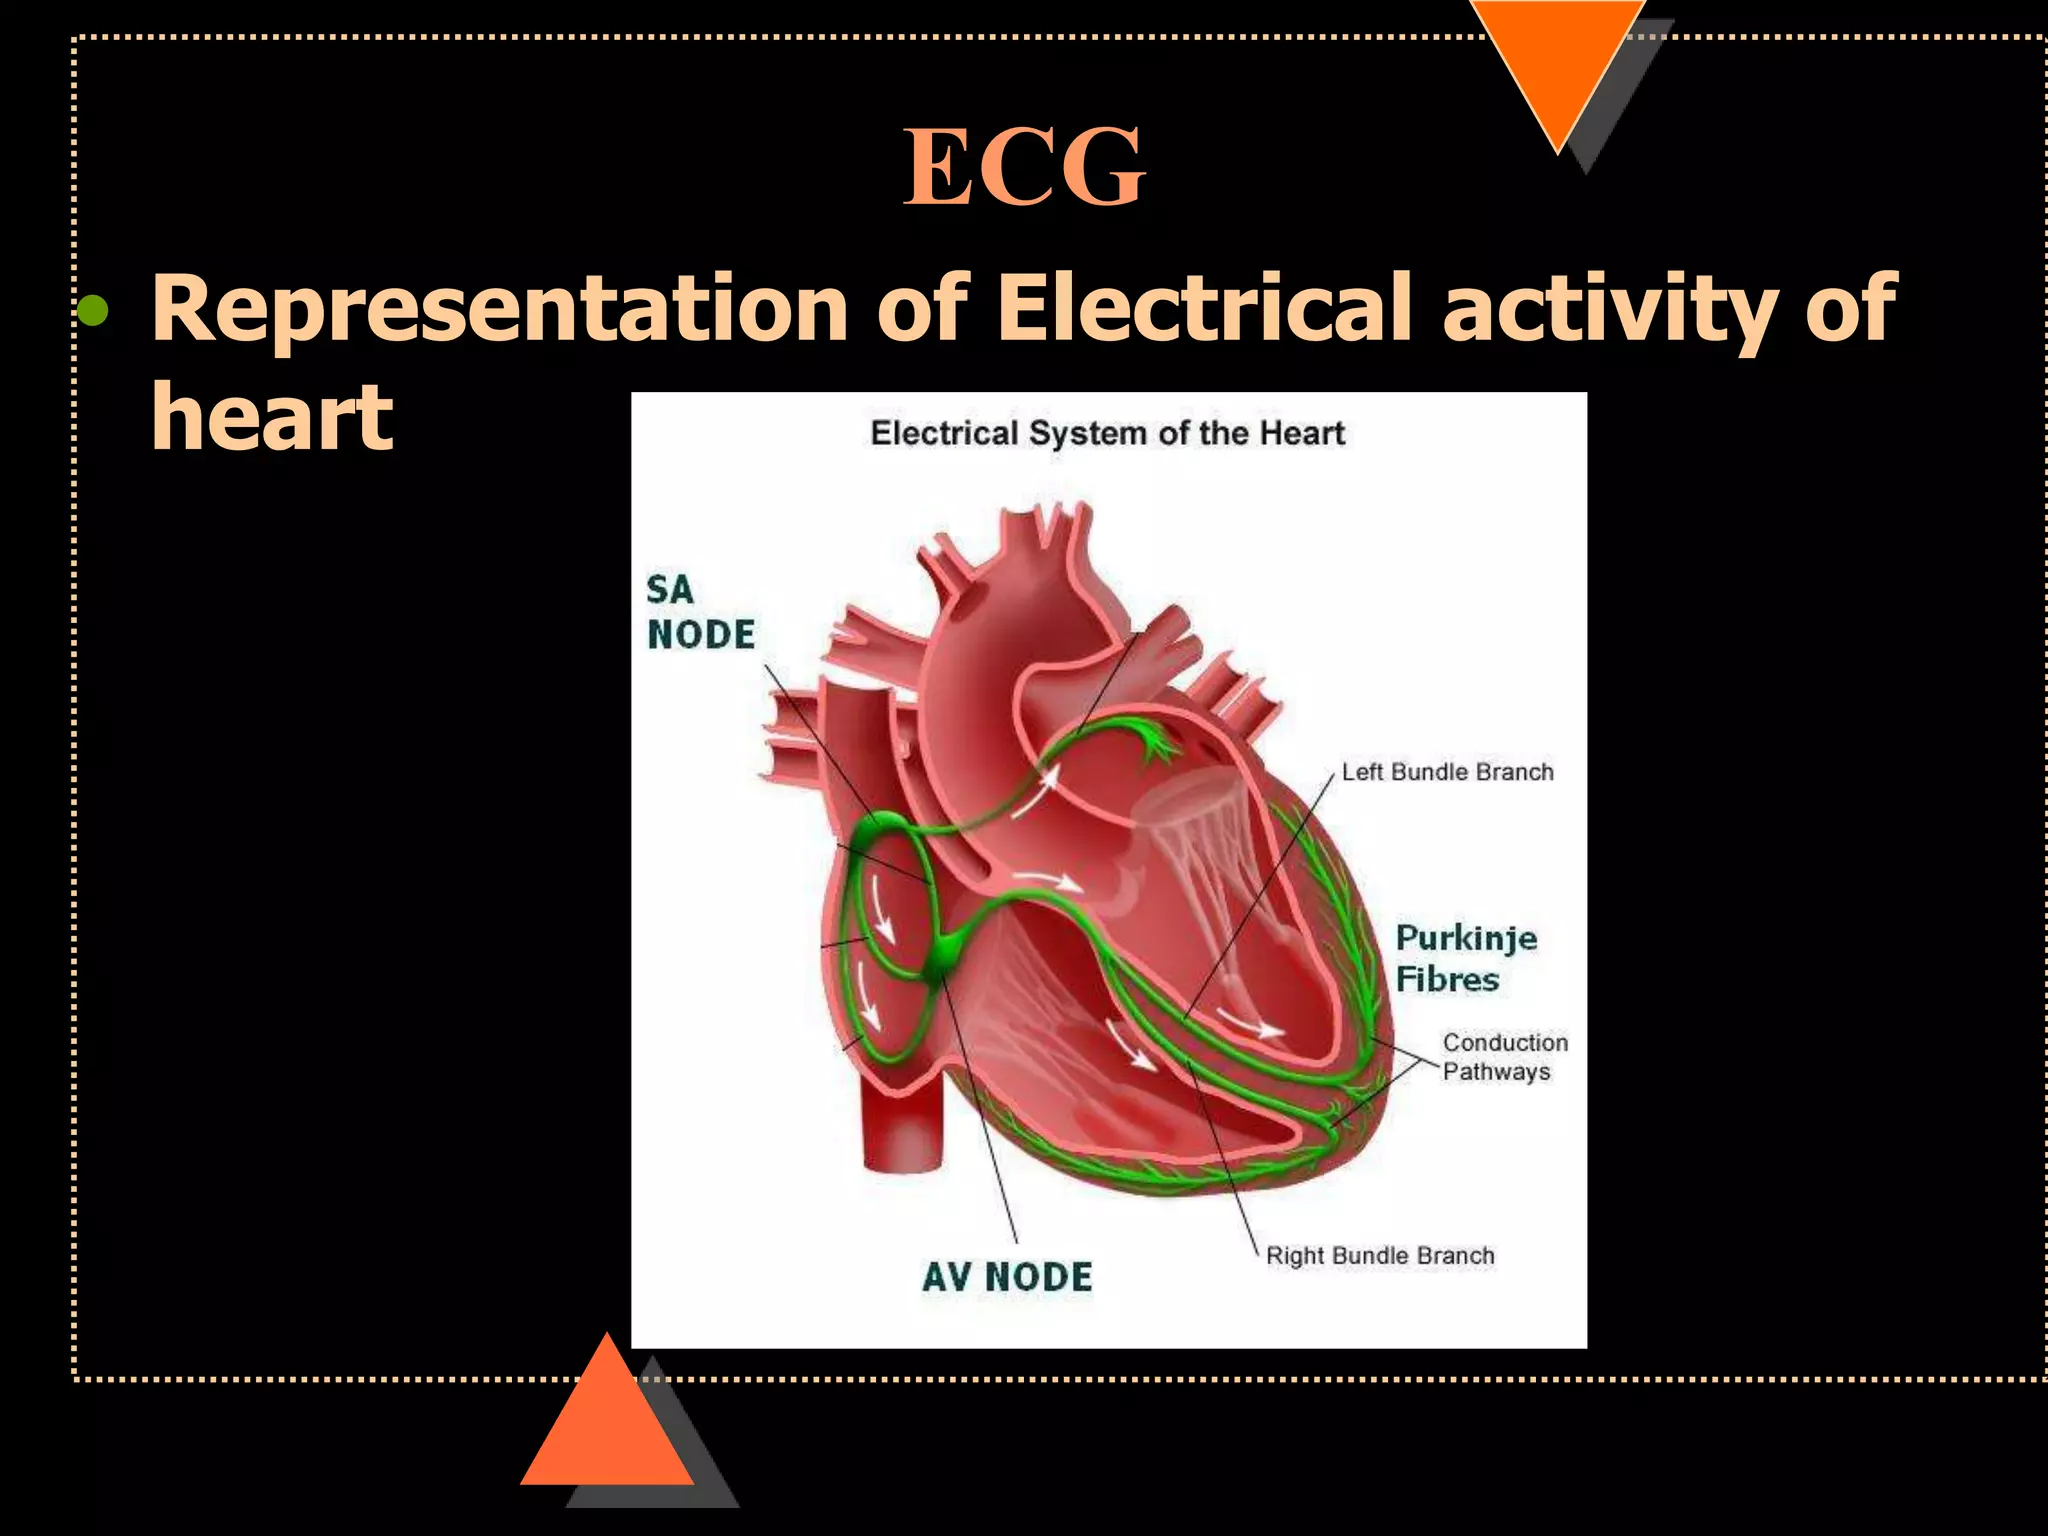
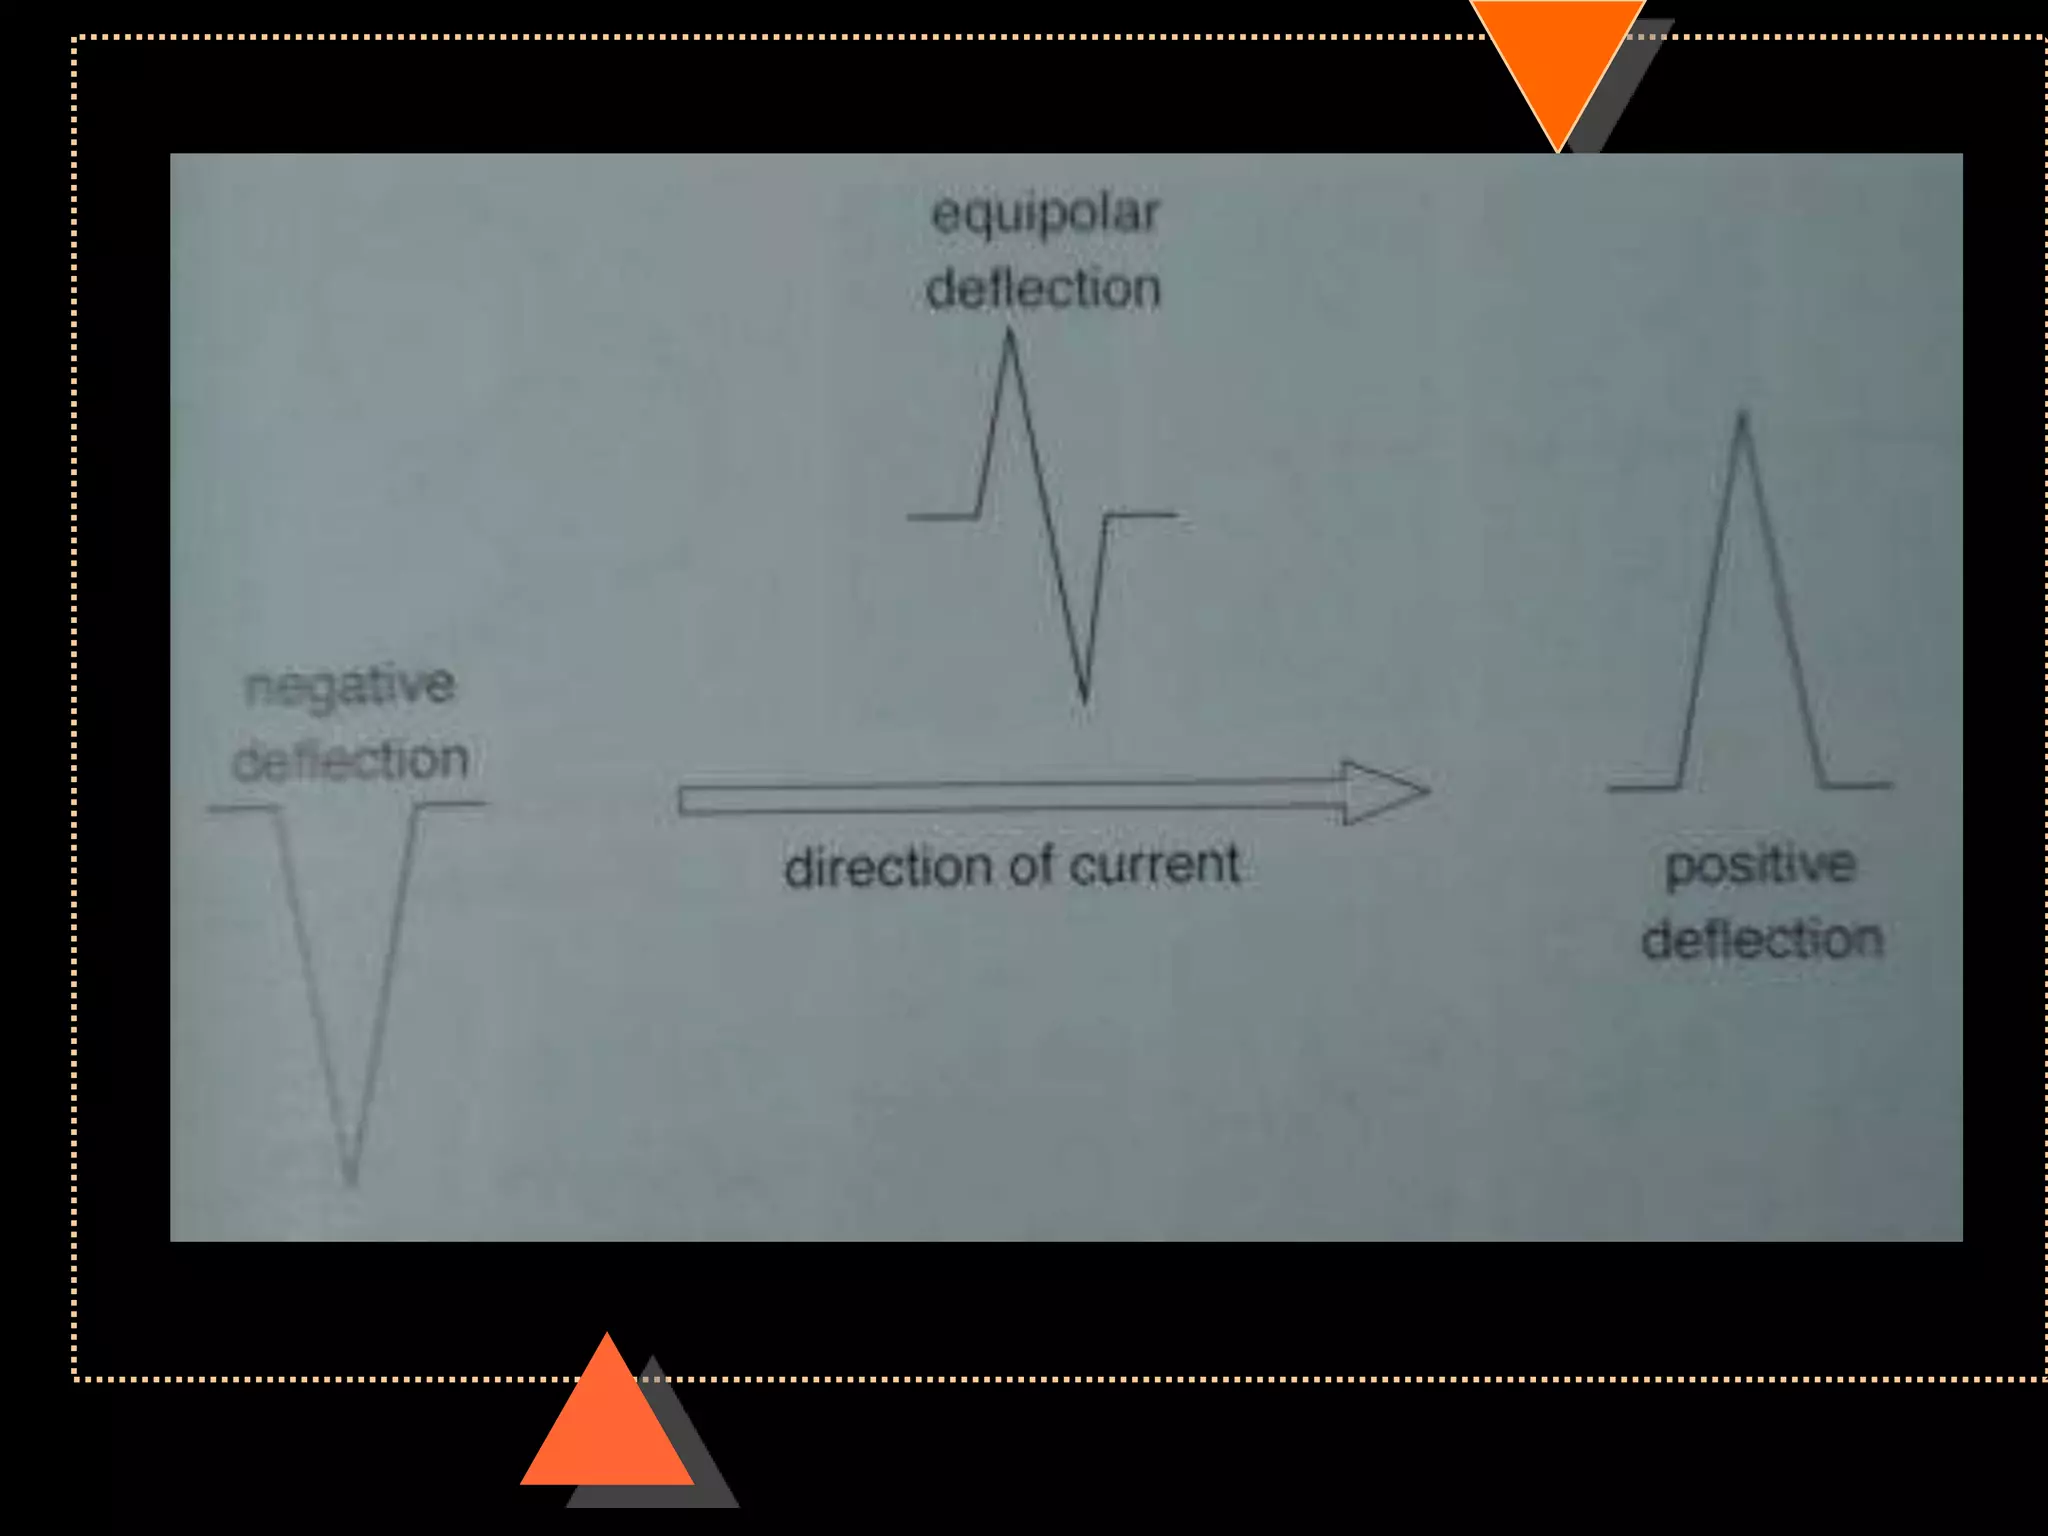
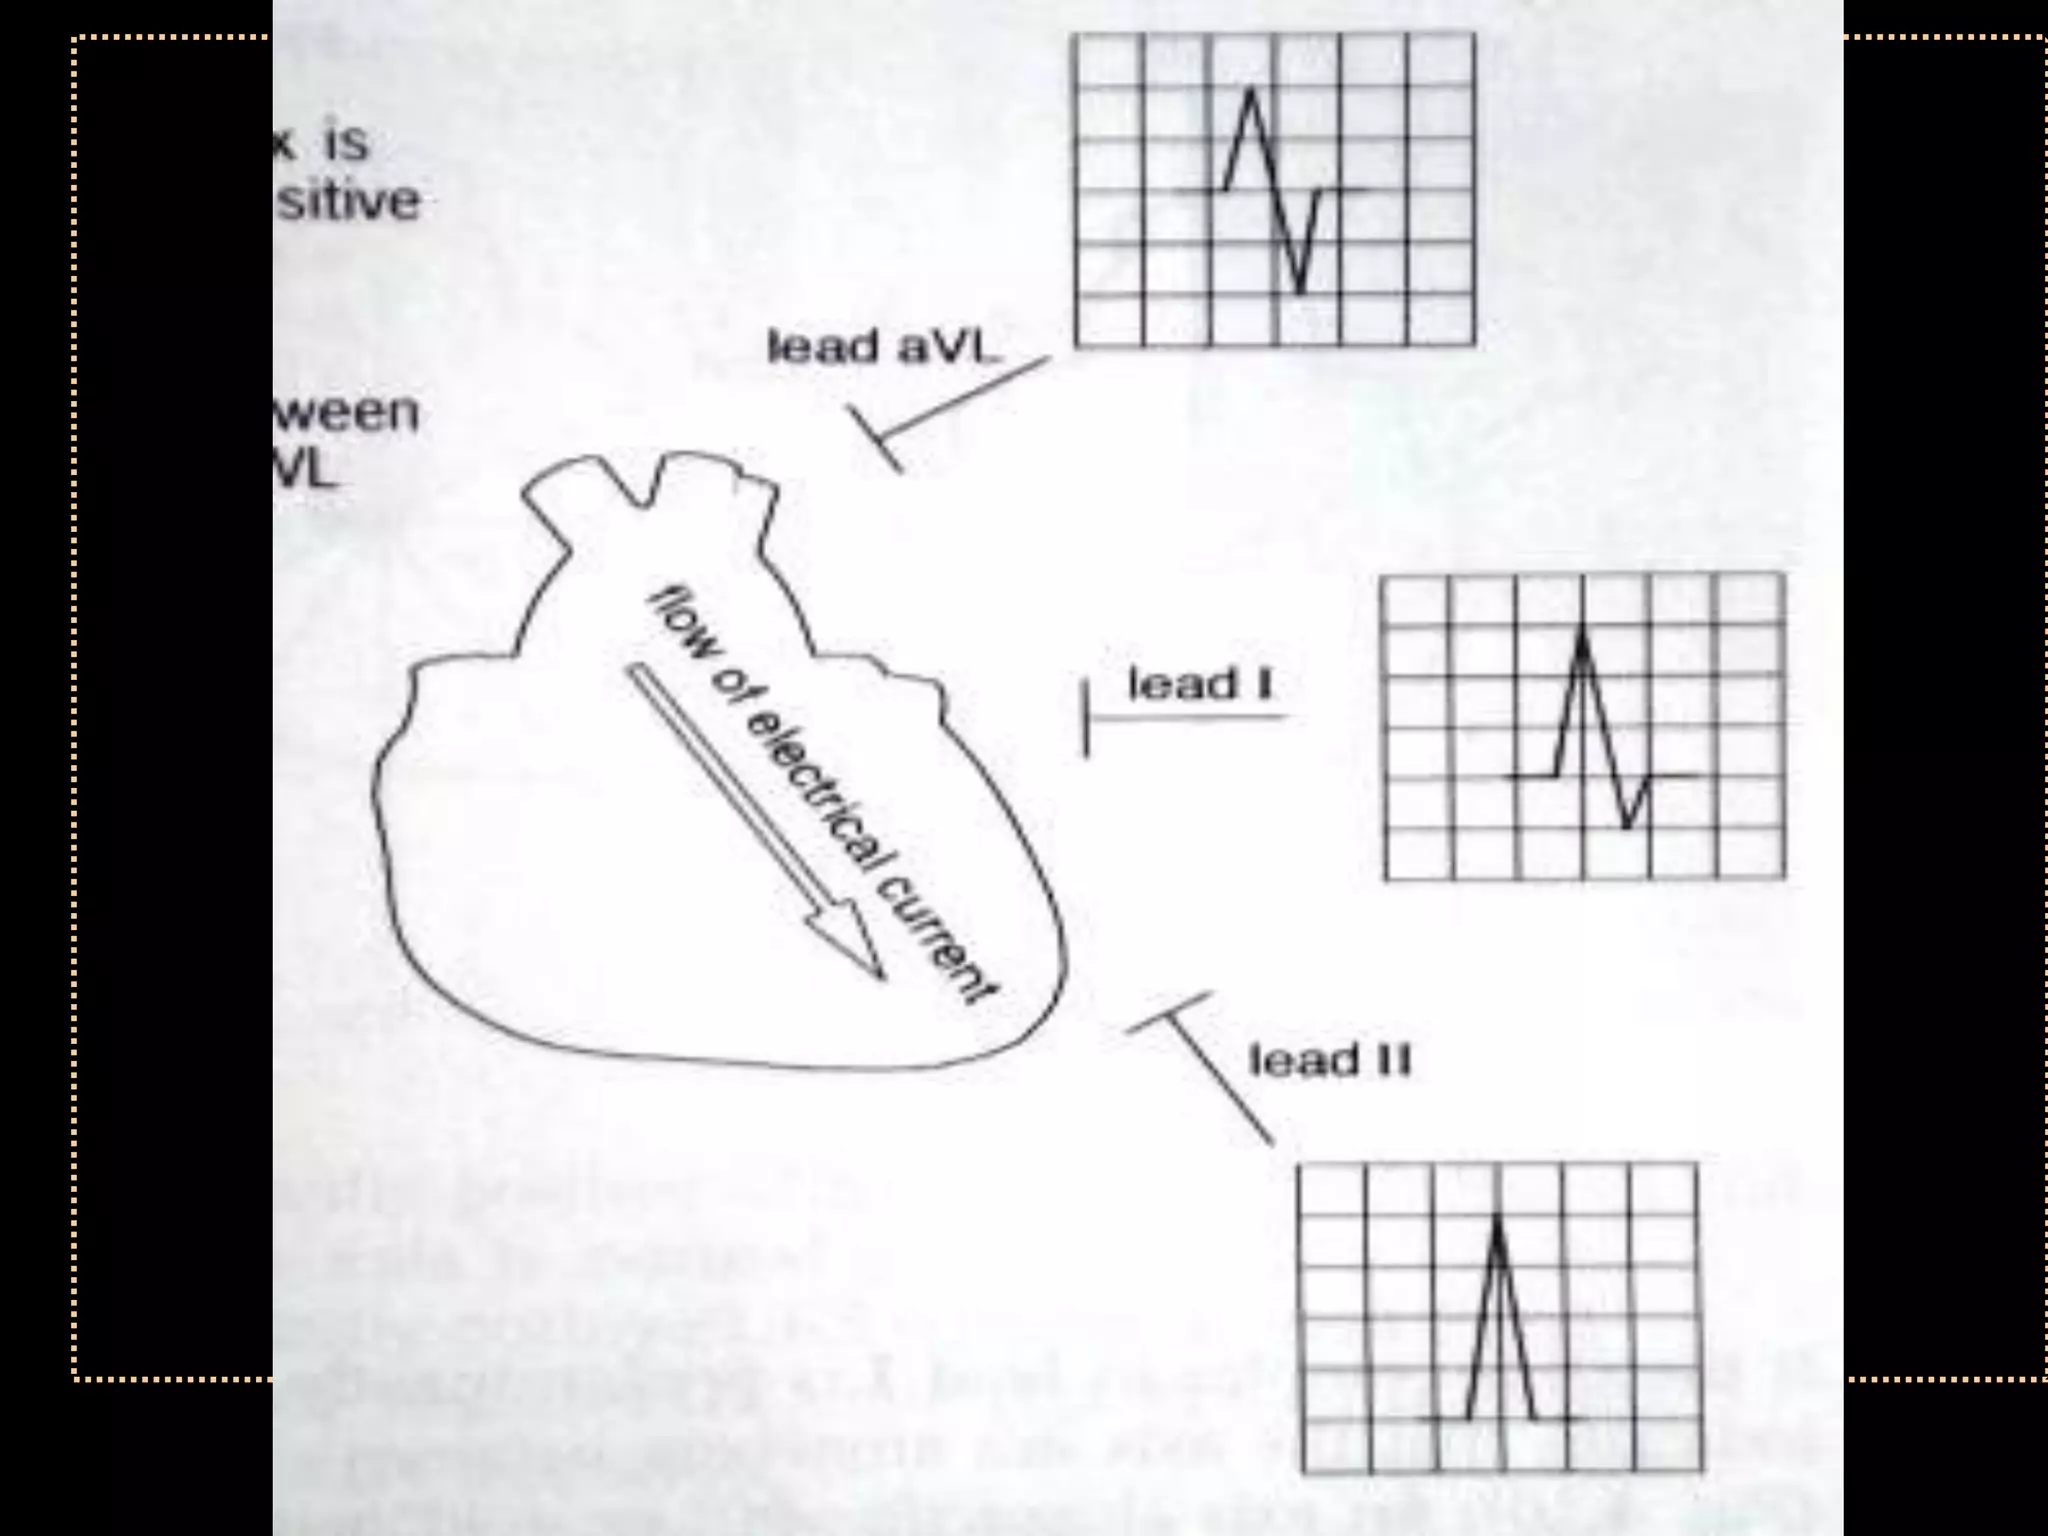
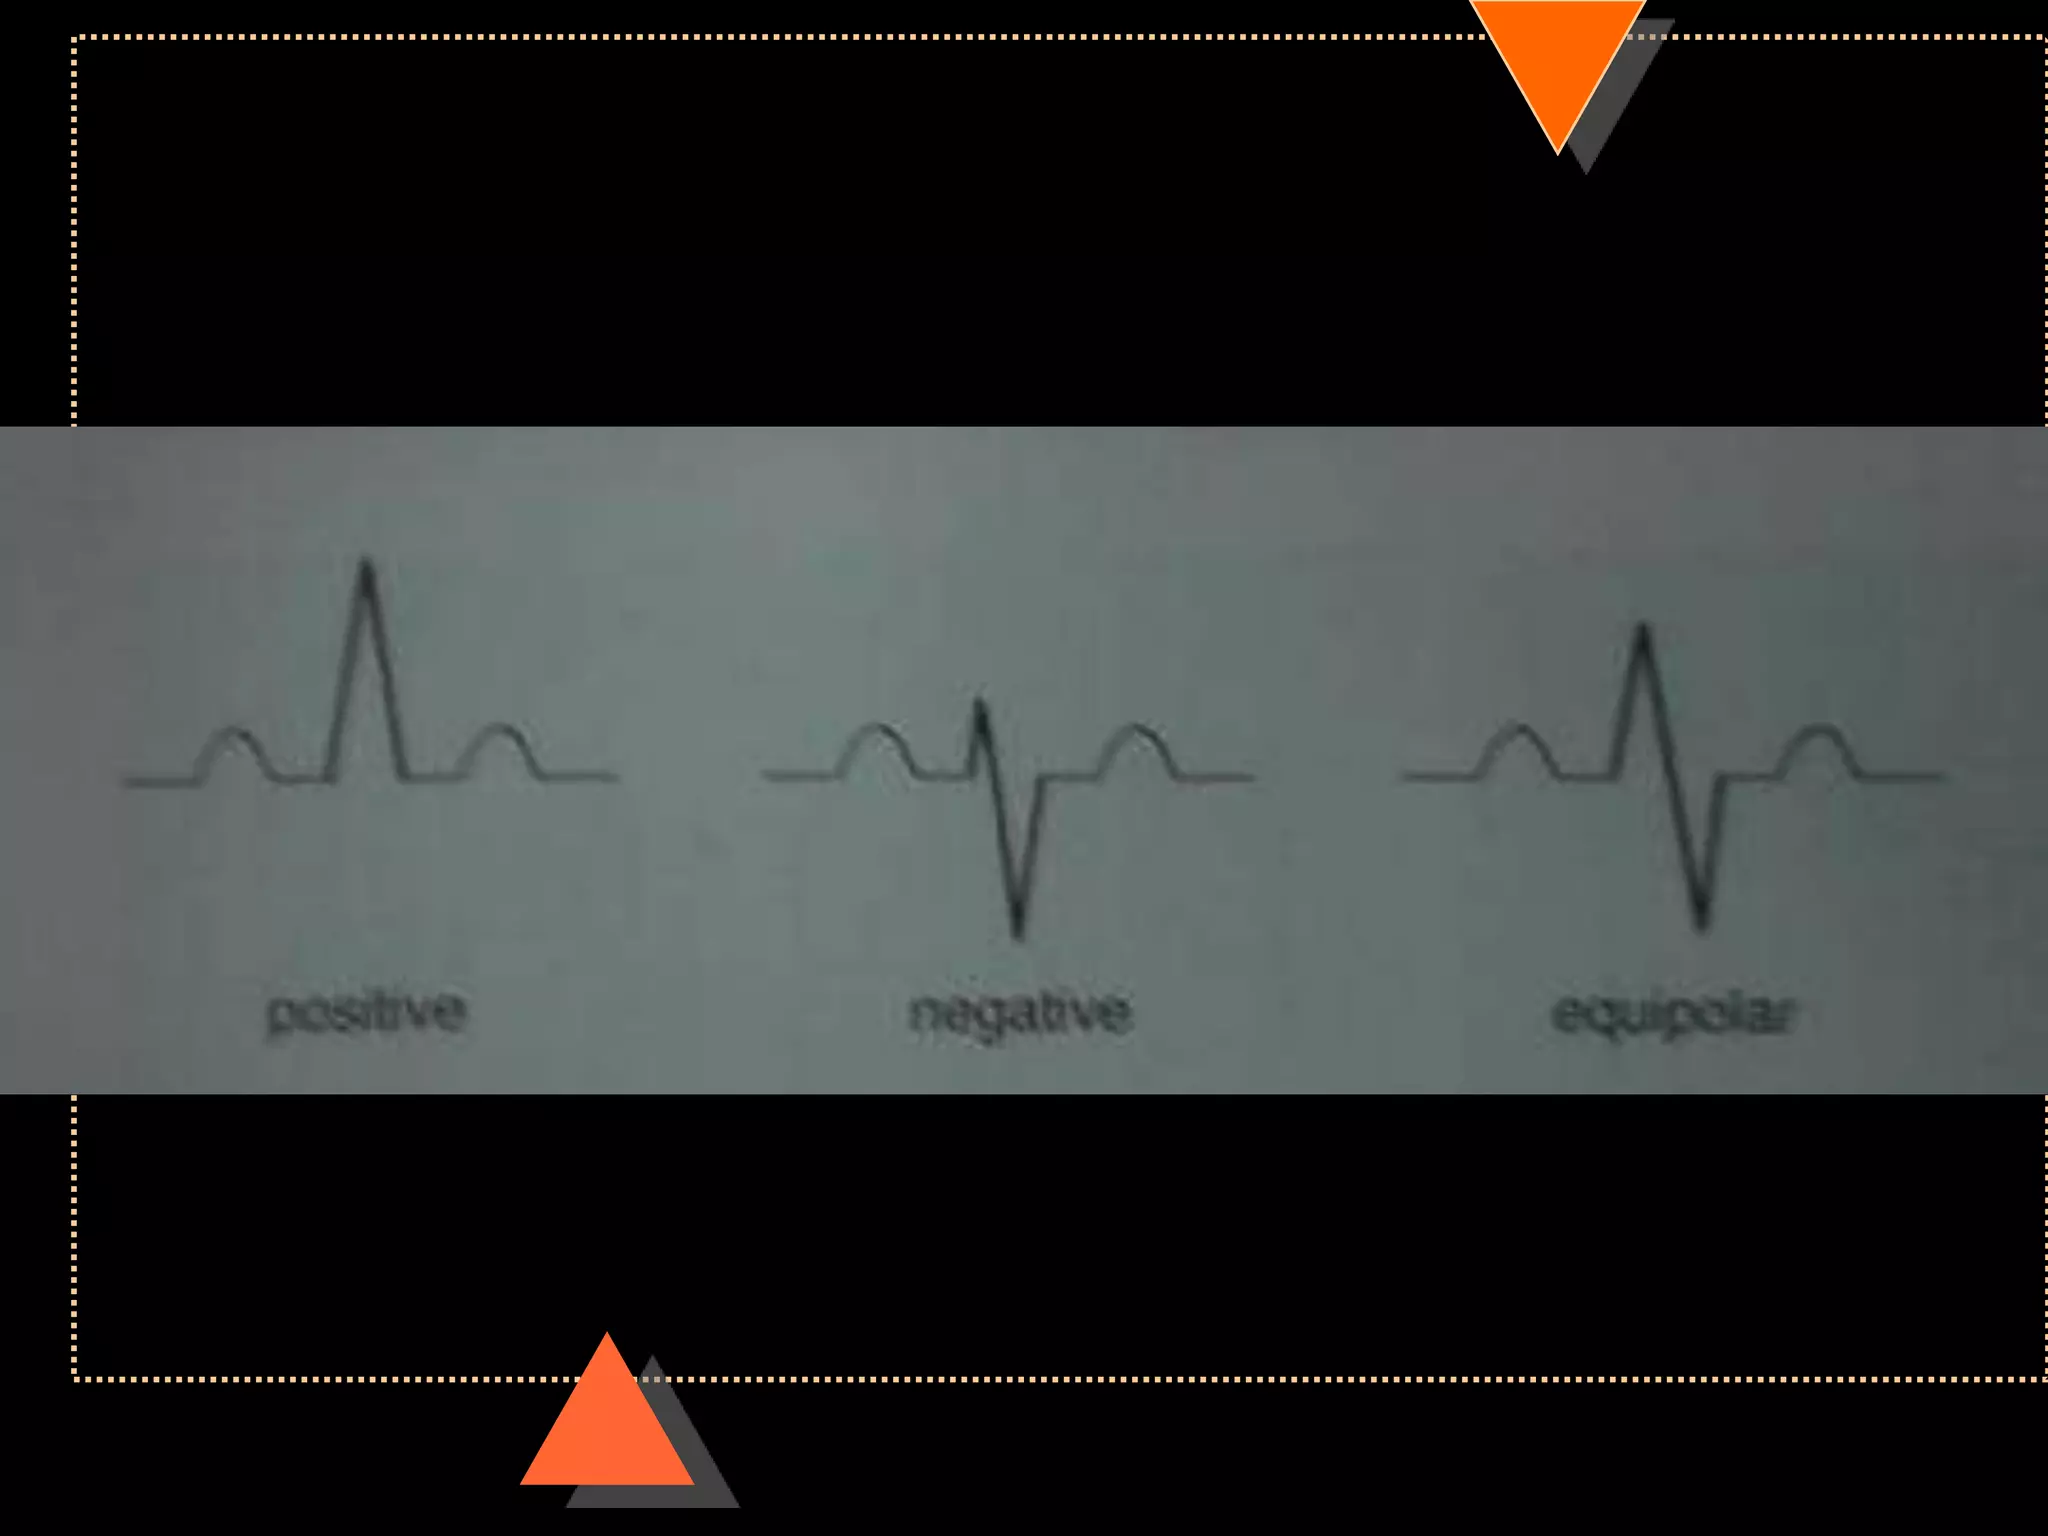
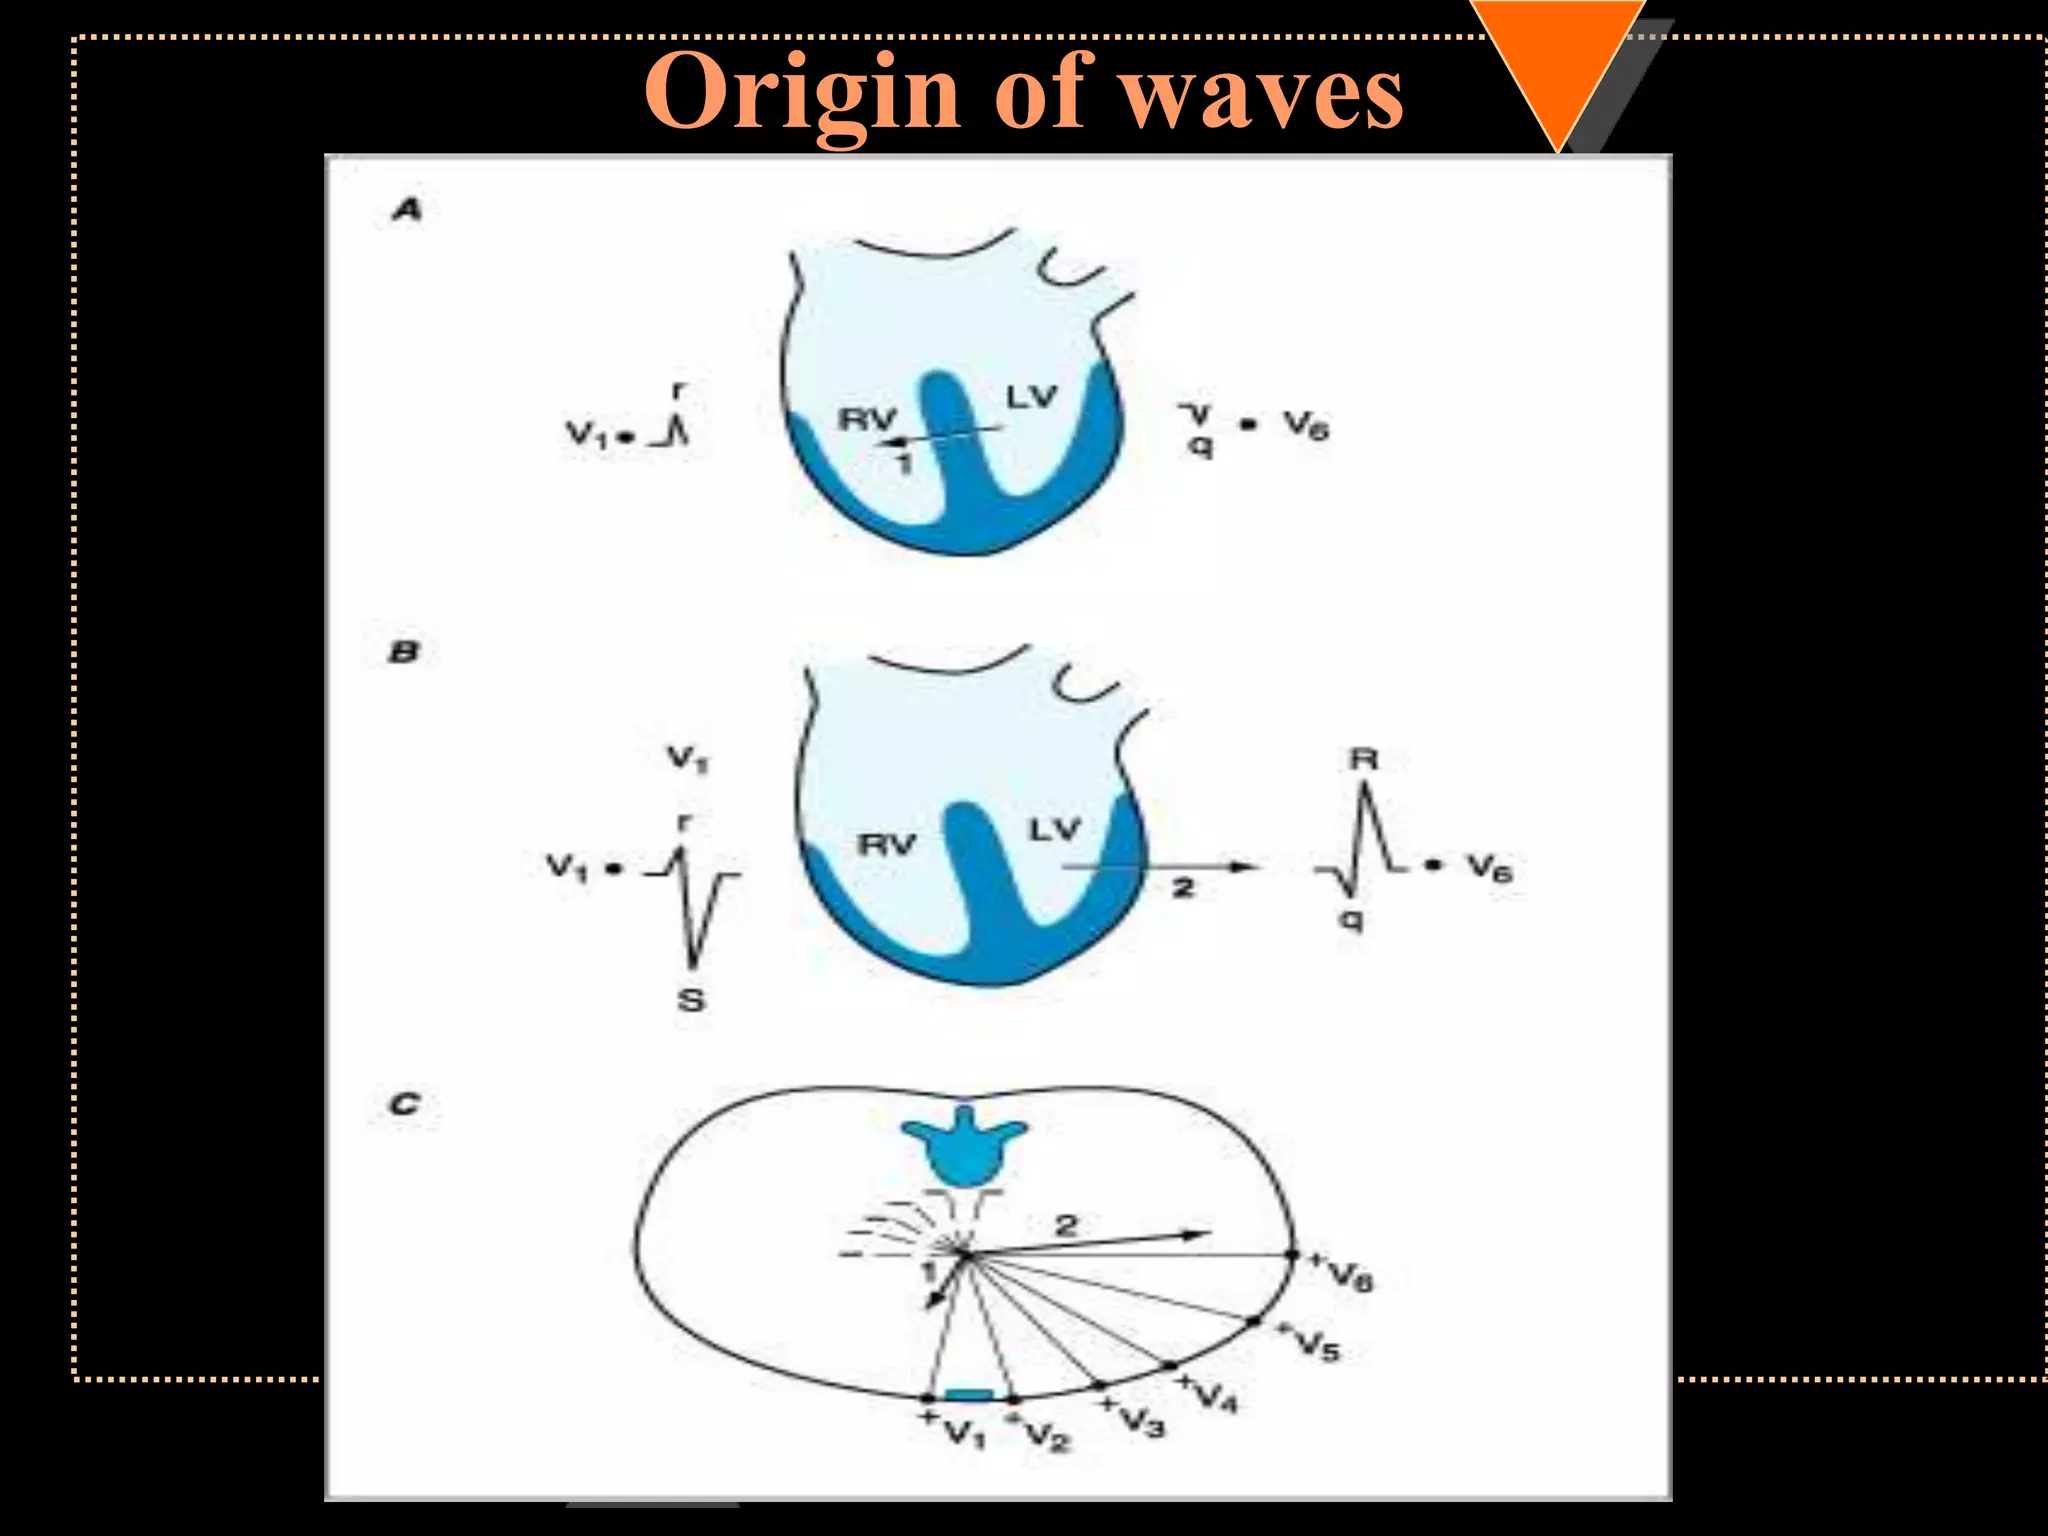
![Appearance of waves
• Positive deflection [upward]
• If electrical impulses flowing towards
that lead
• Negative deflection [downward]
• If electrical impulses flowing away from
that lead](https://image.slidesharecdn.com/howtoreadecg-130901100253-phpapp02/75/How-to-read-ECG-9-2048.jpg)
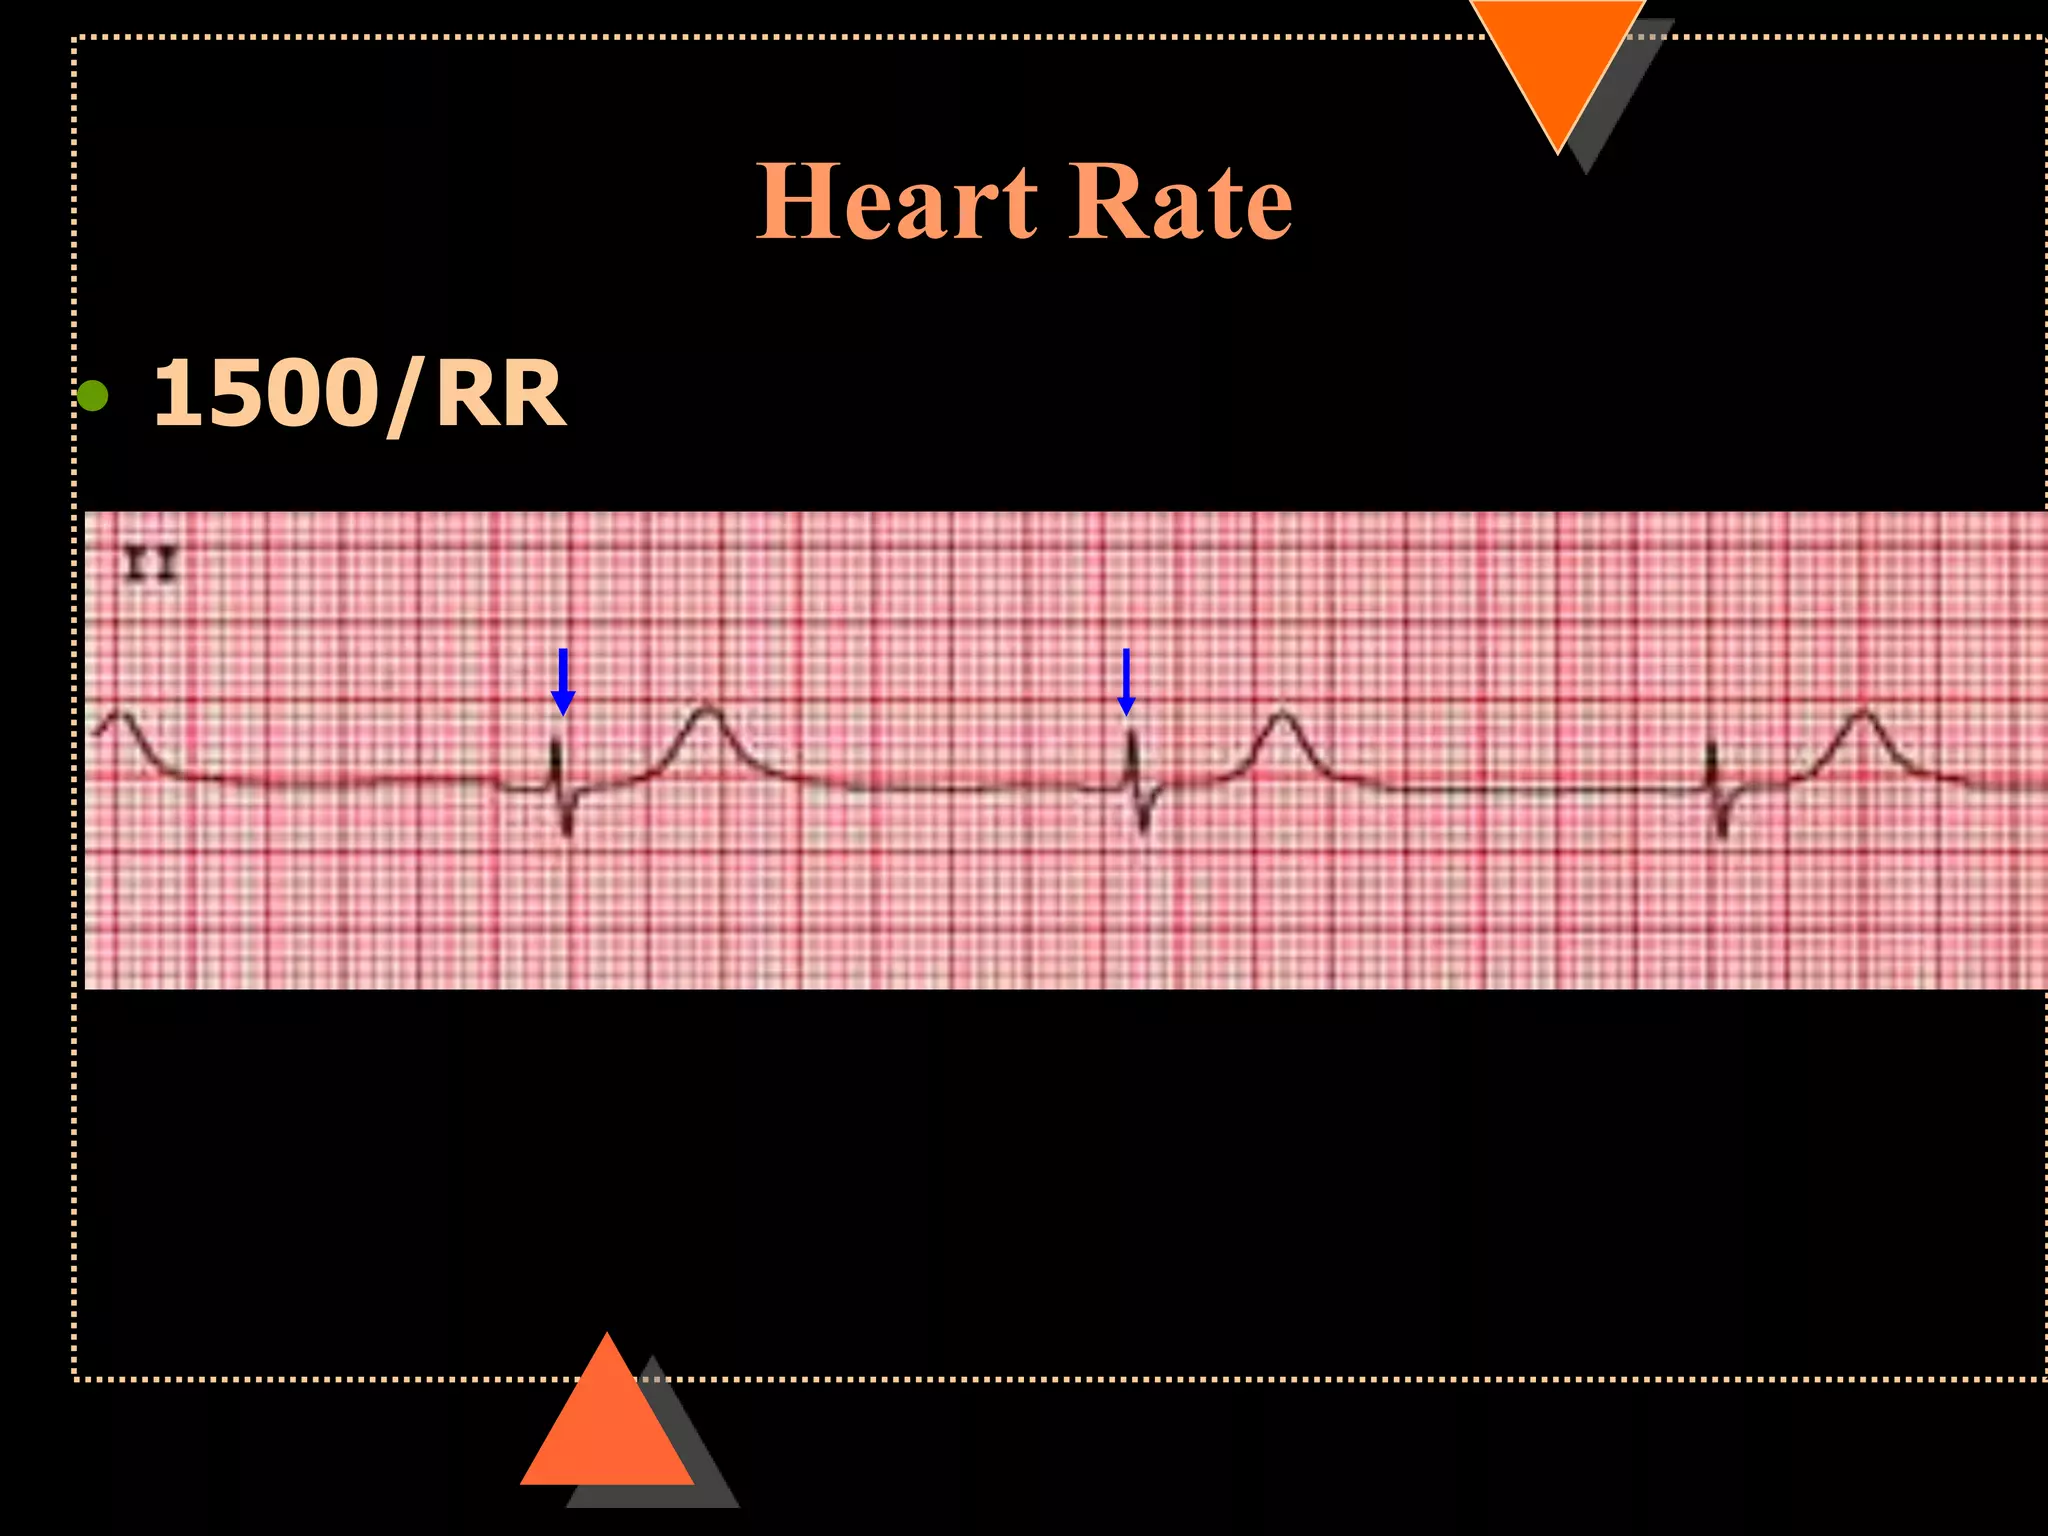
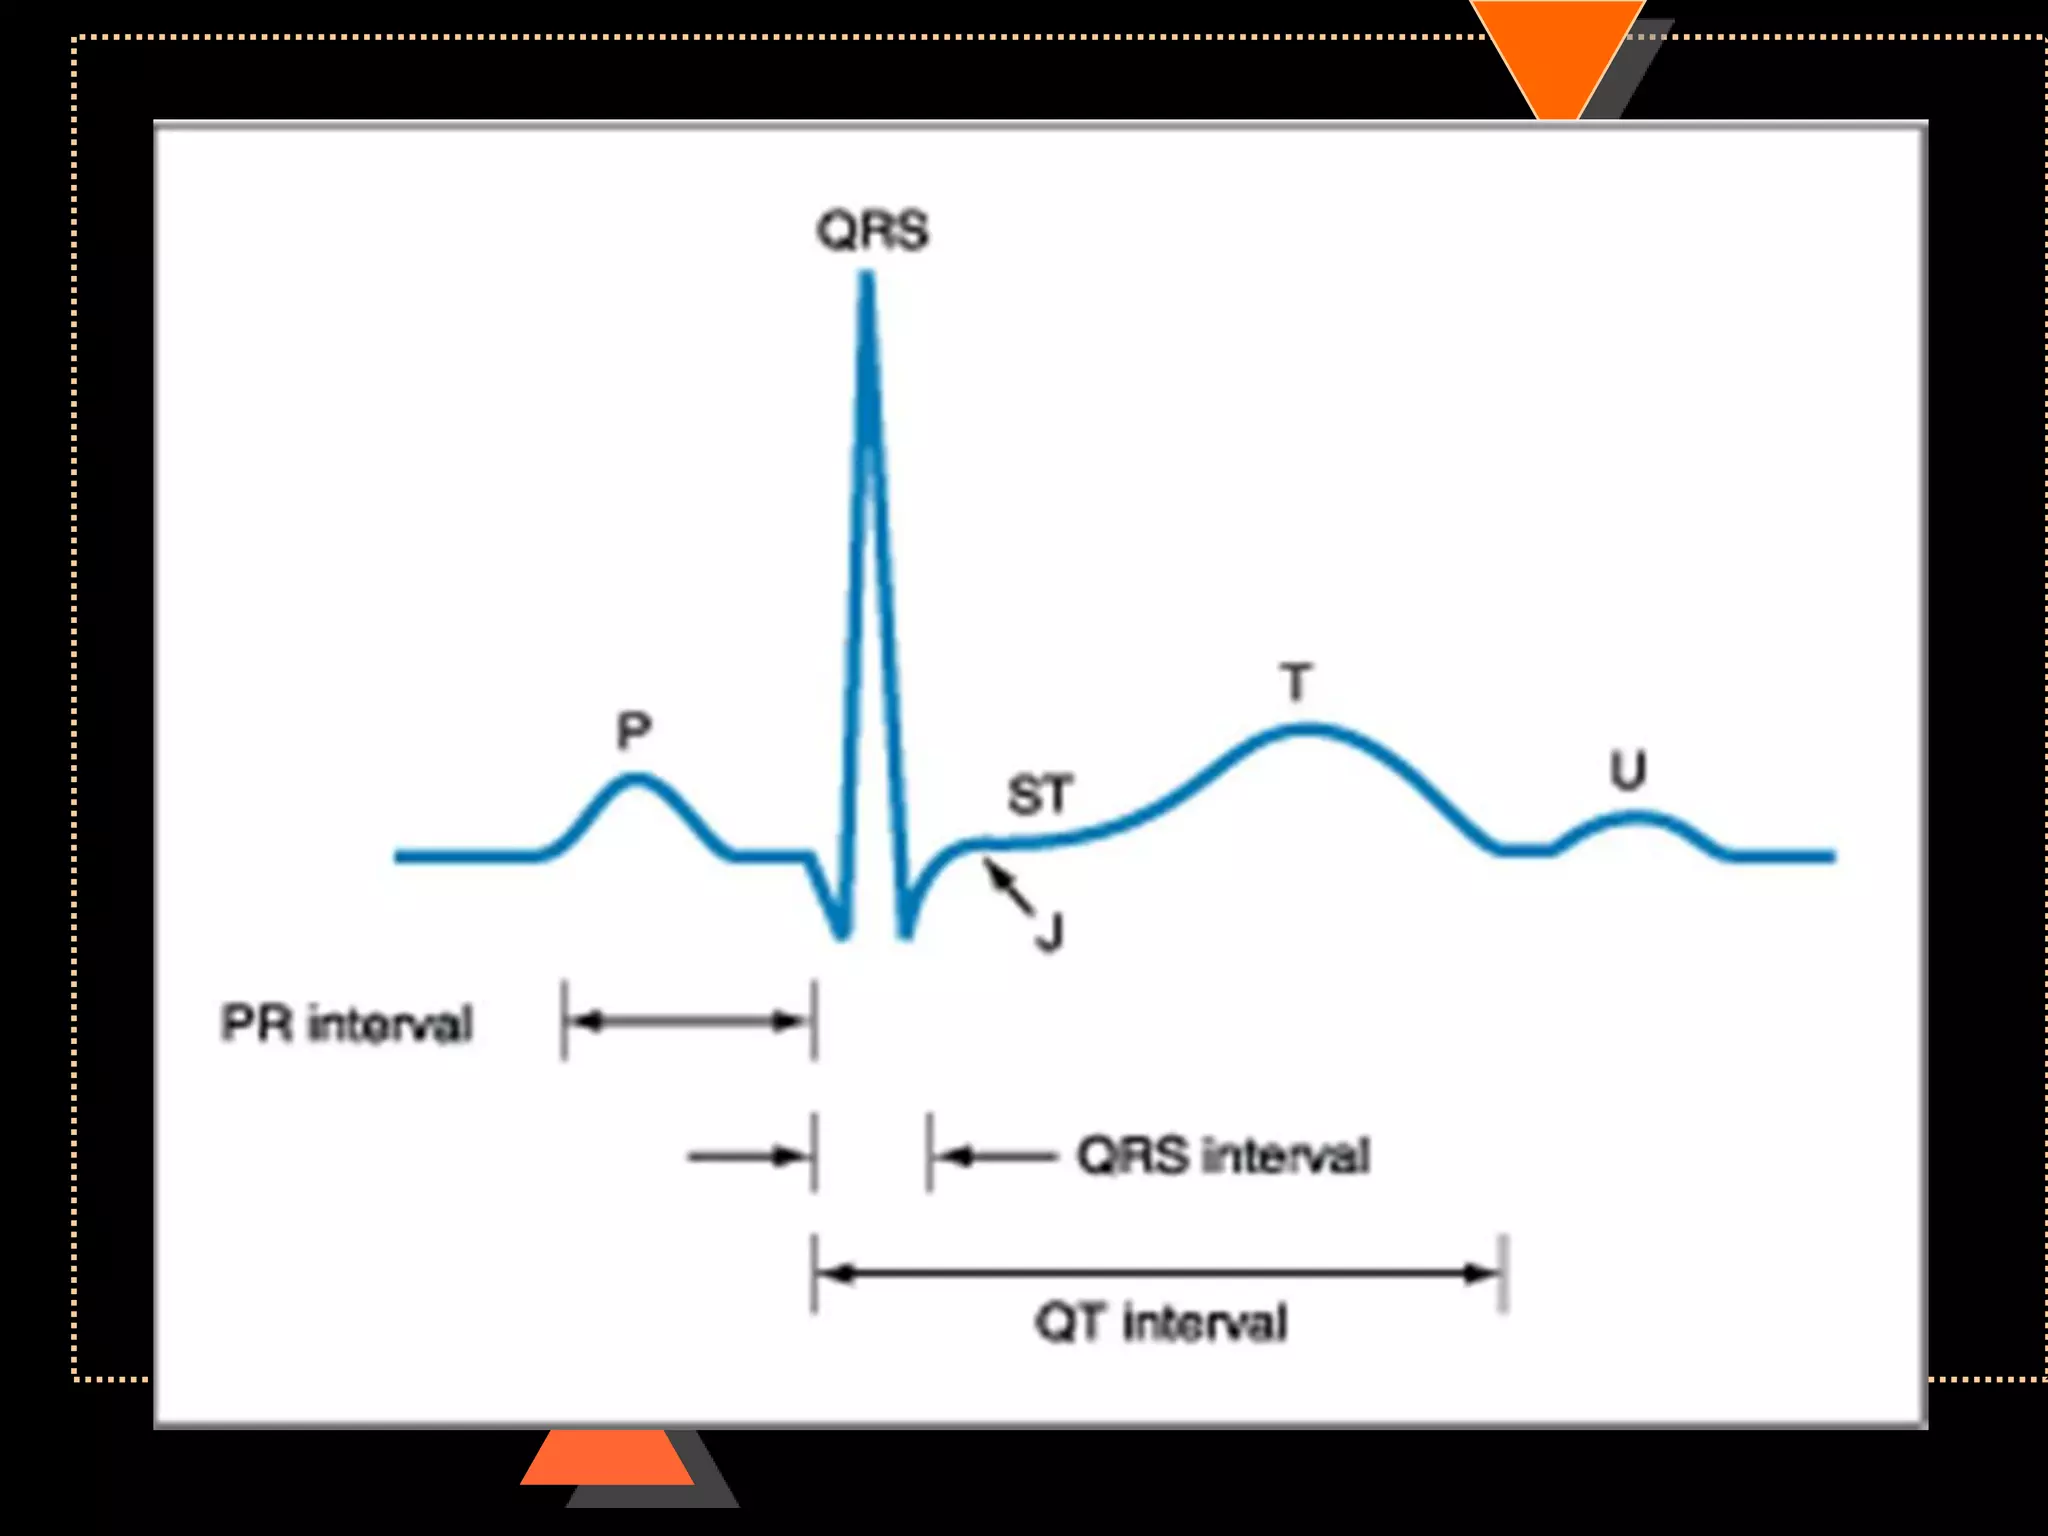
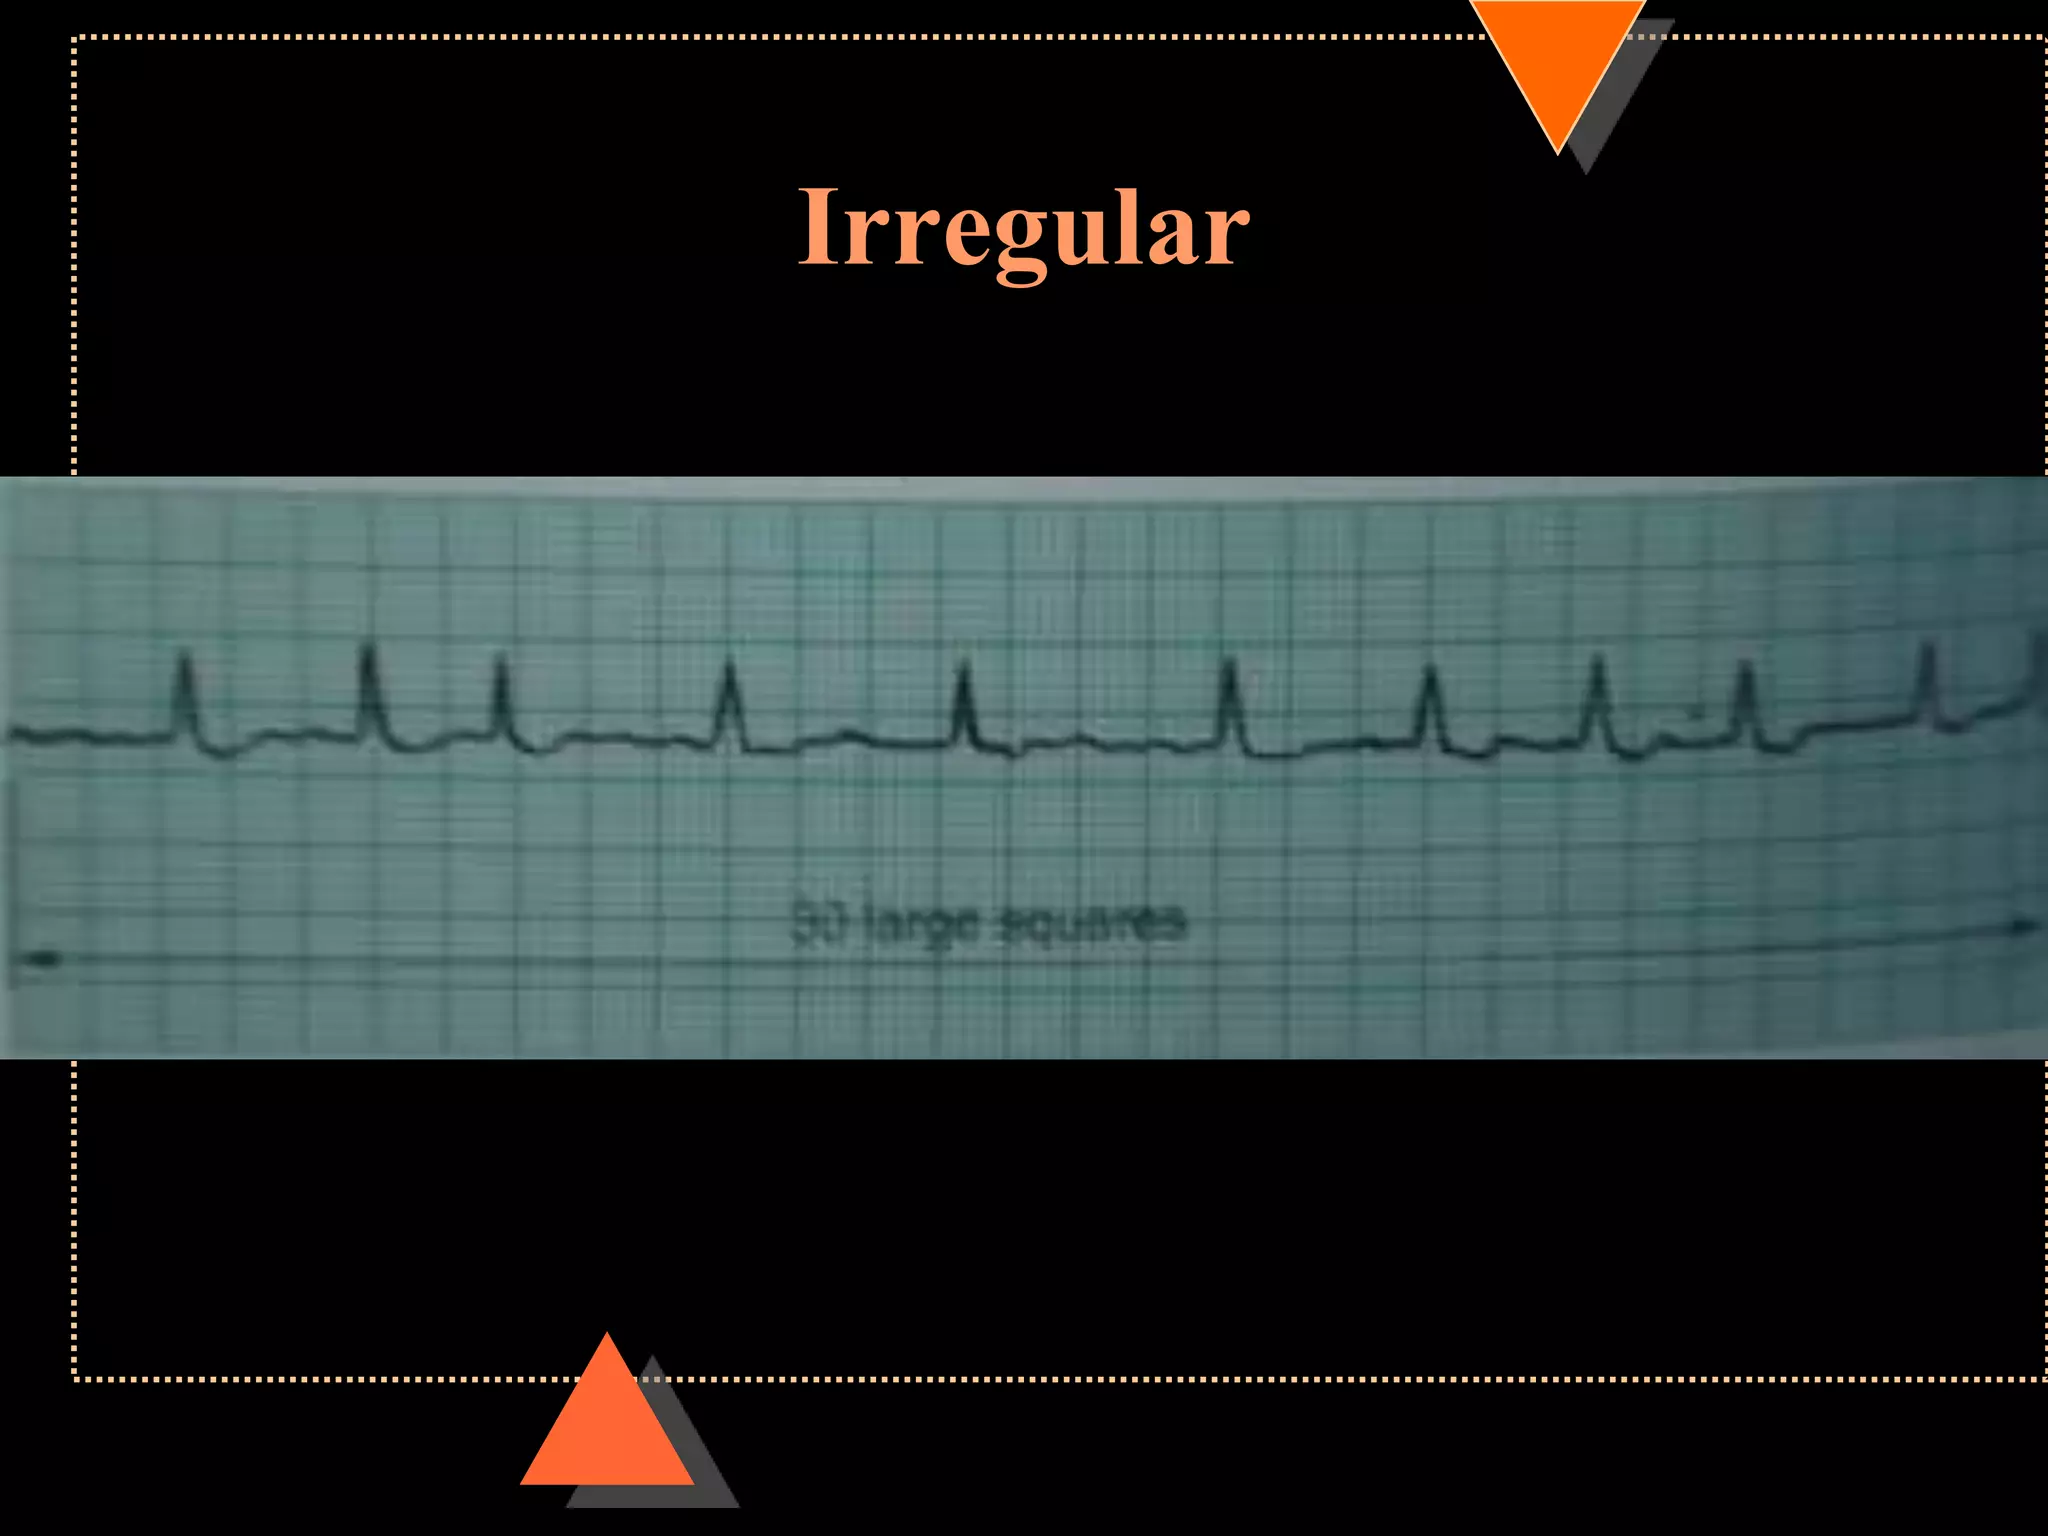
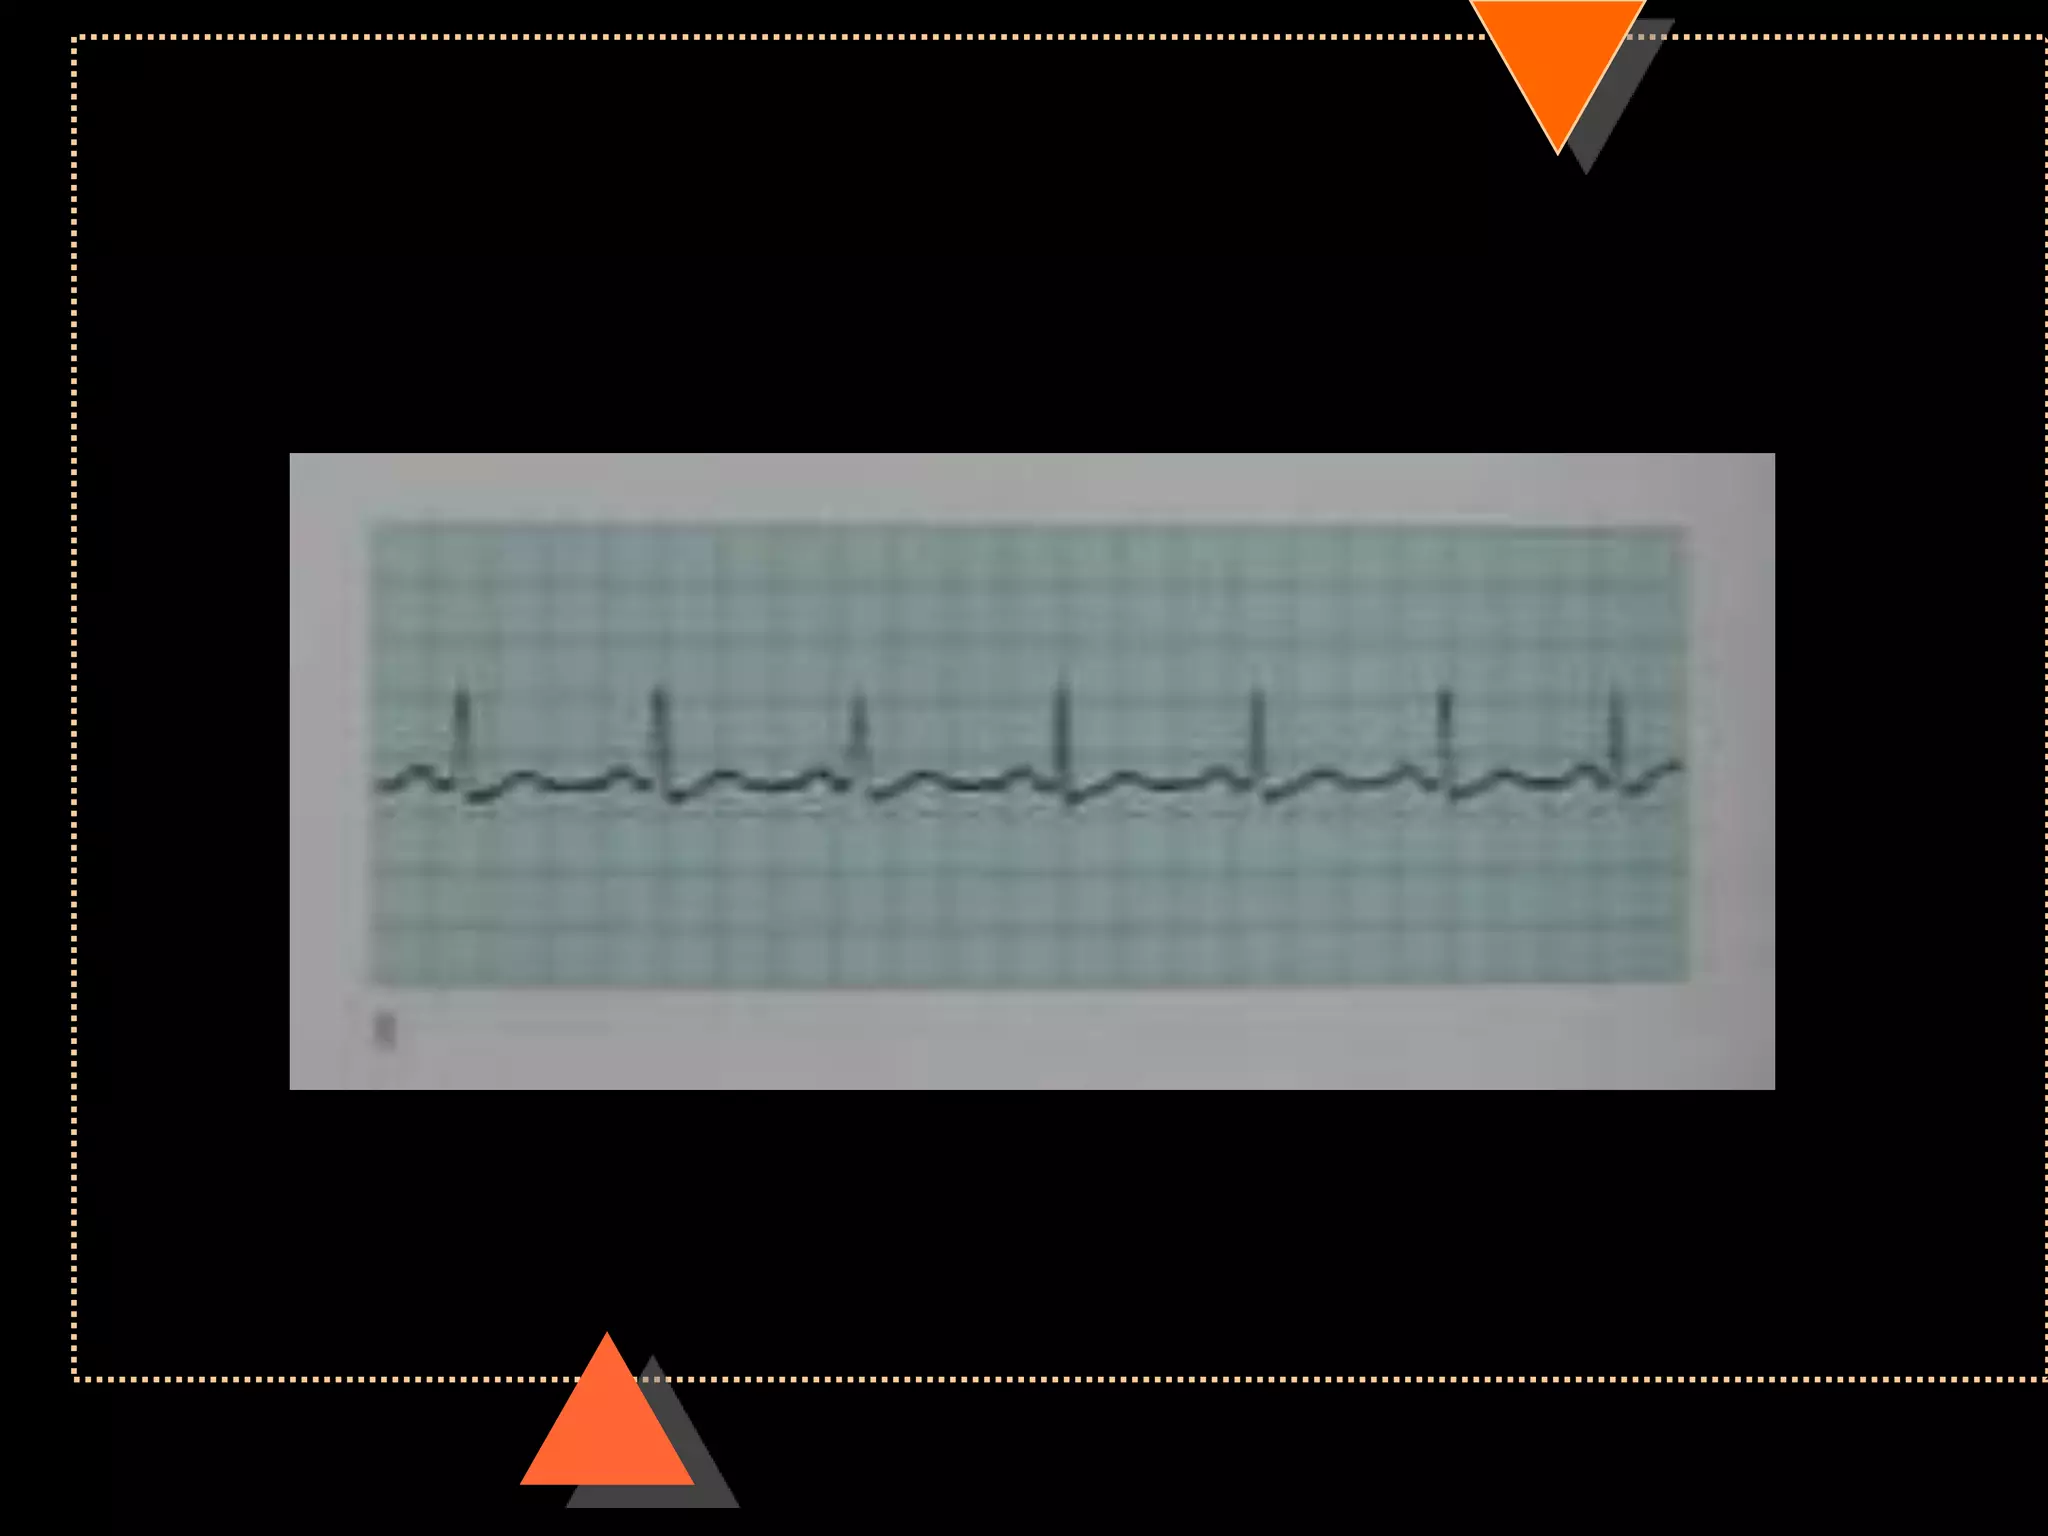
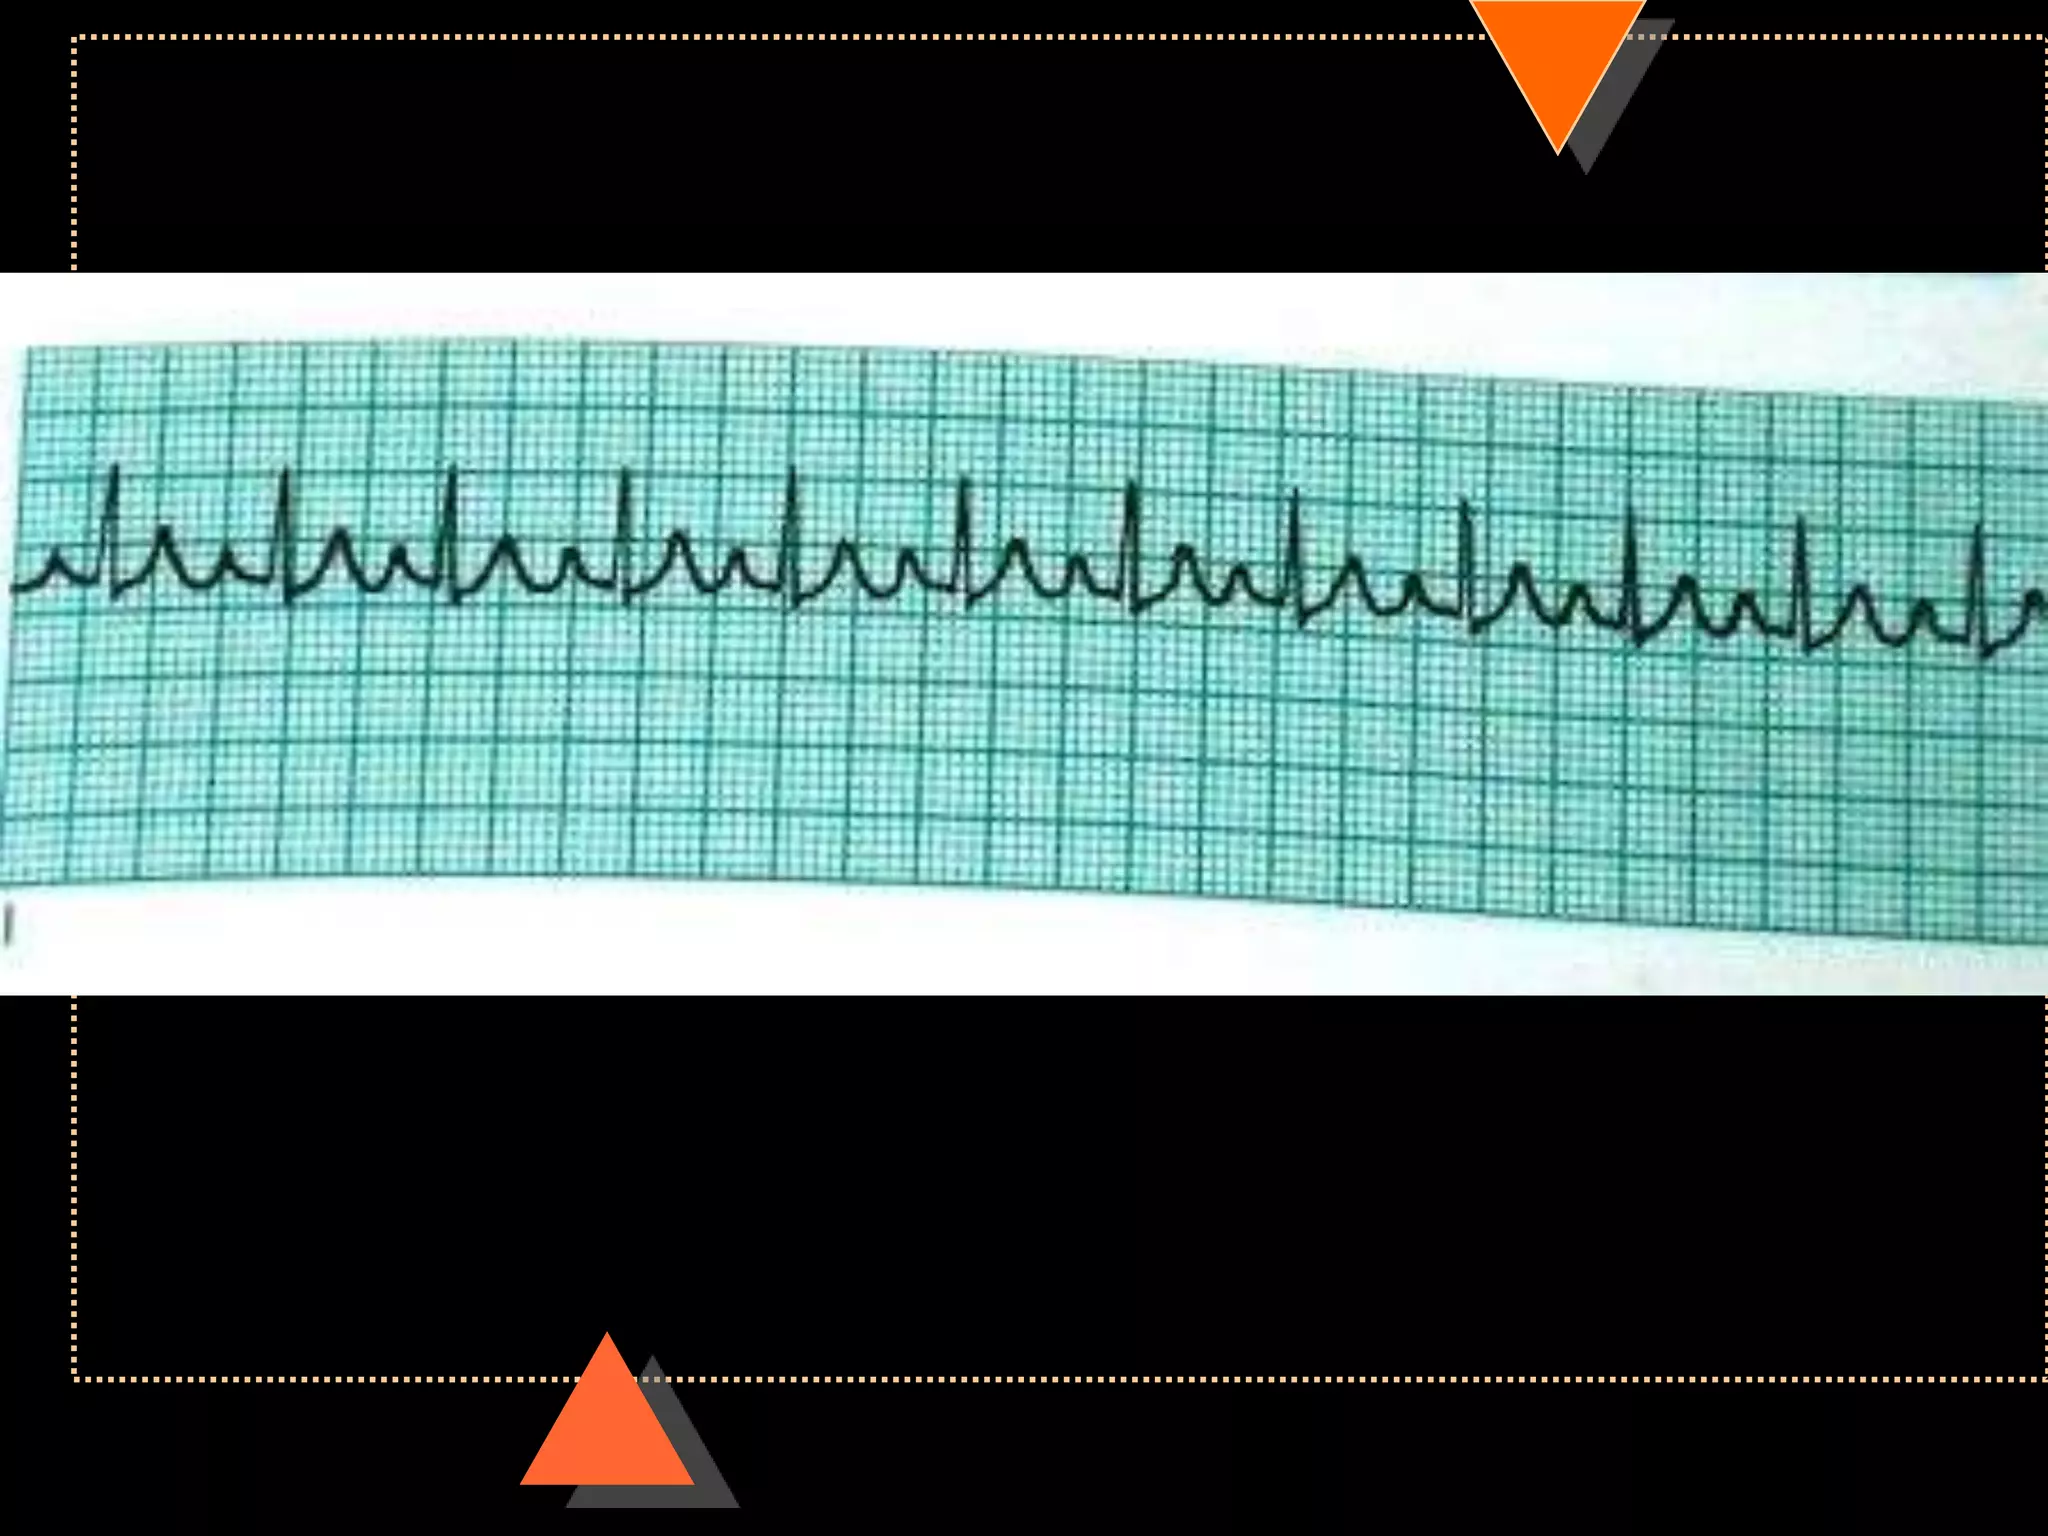
![•If HR is irregular
Count no. of QRS complexes in 30 large squares=
6 sec
Multiply it with 10
HR [per min]](https://image.slidesharecdn.com/howtoreadecg-130901100253-phpapp02/75/How-to-read-ECG-21-2048.jpg)

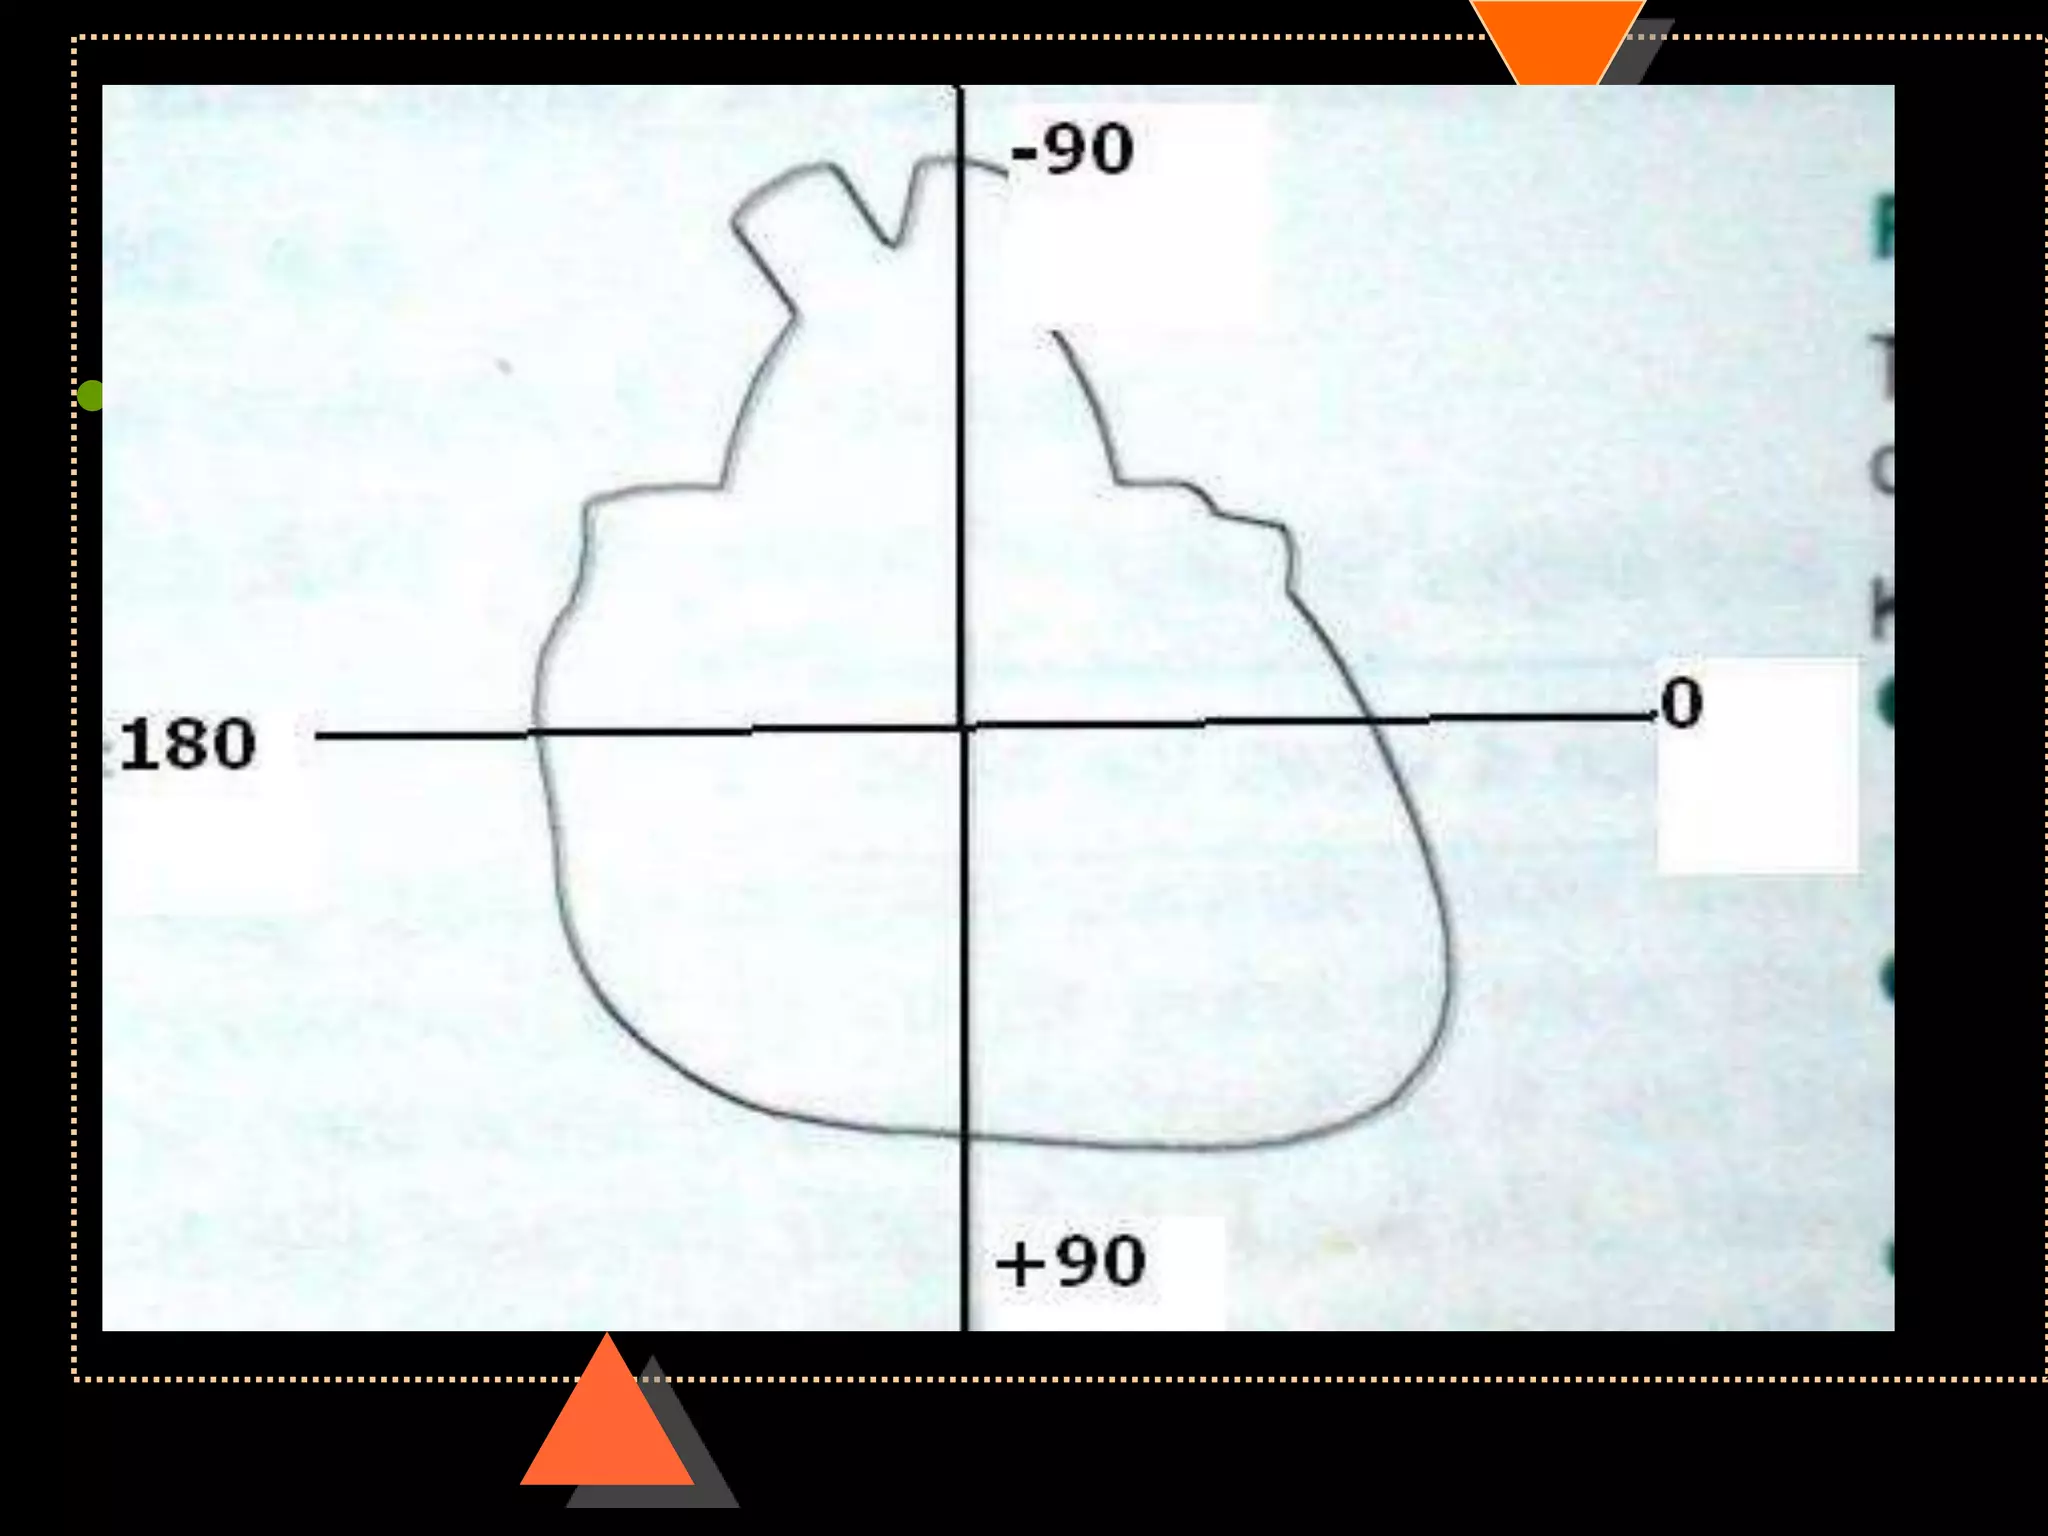
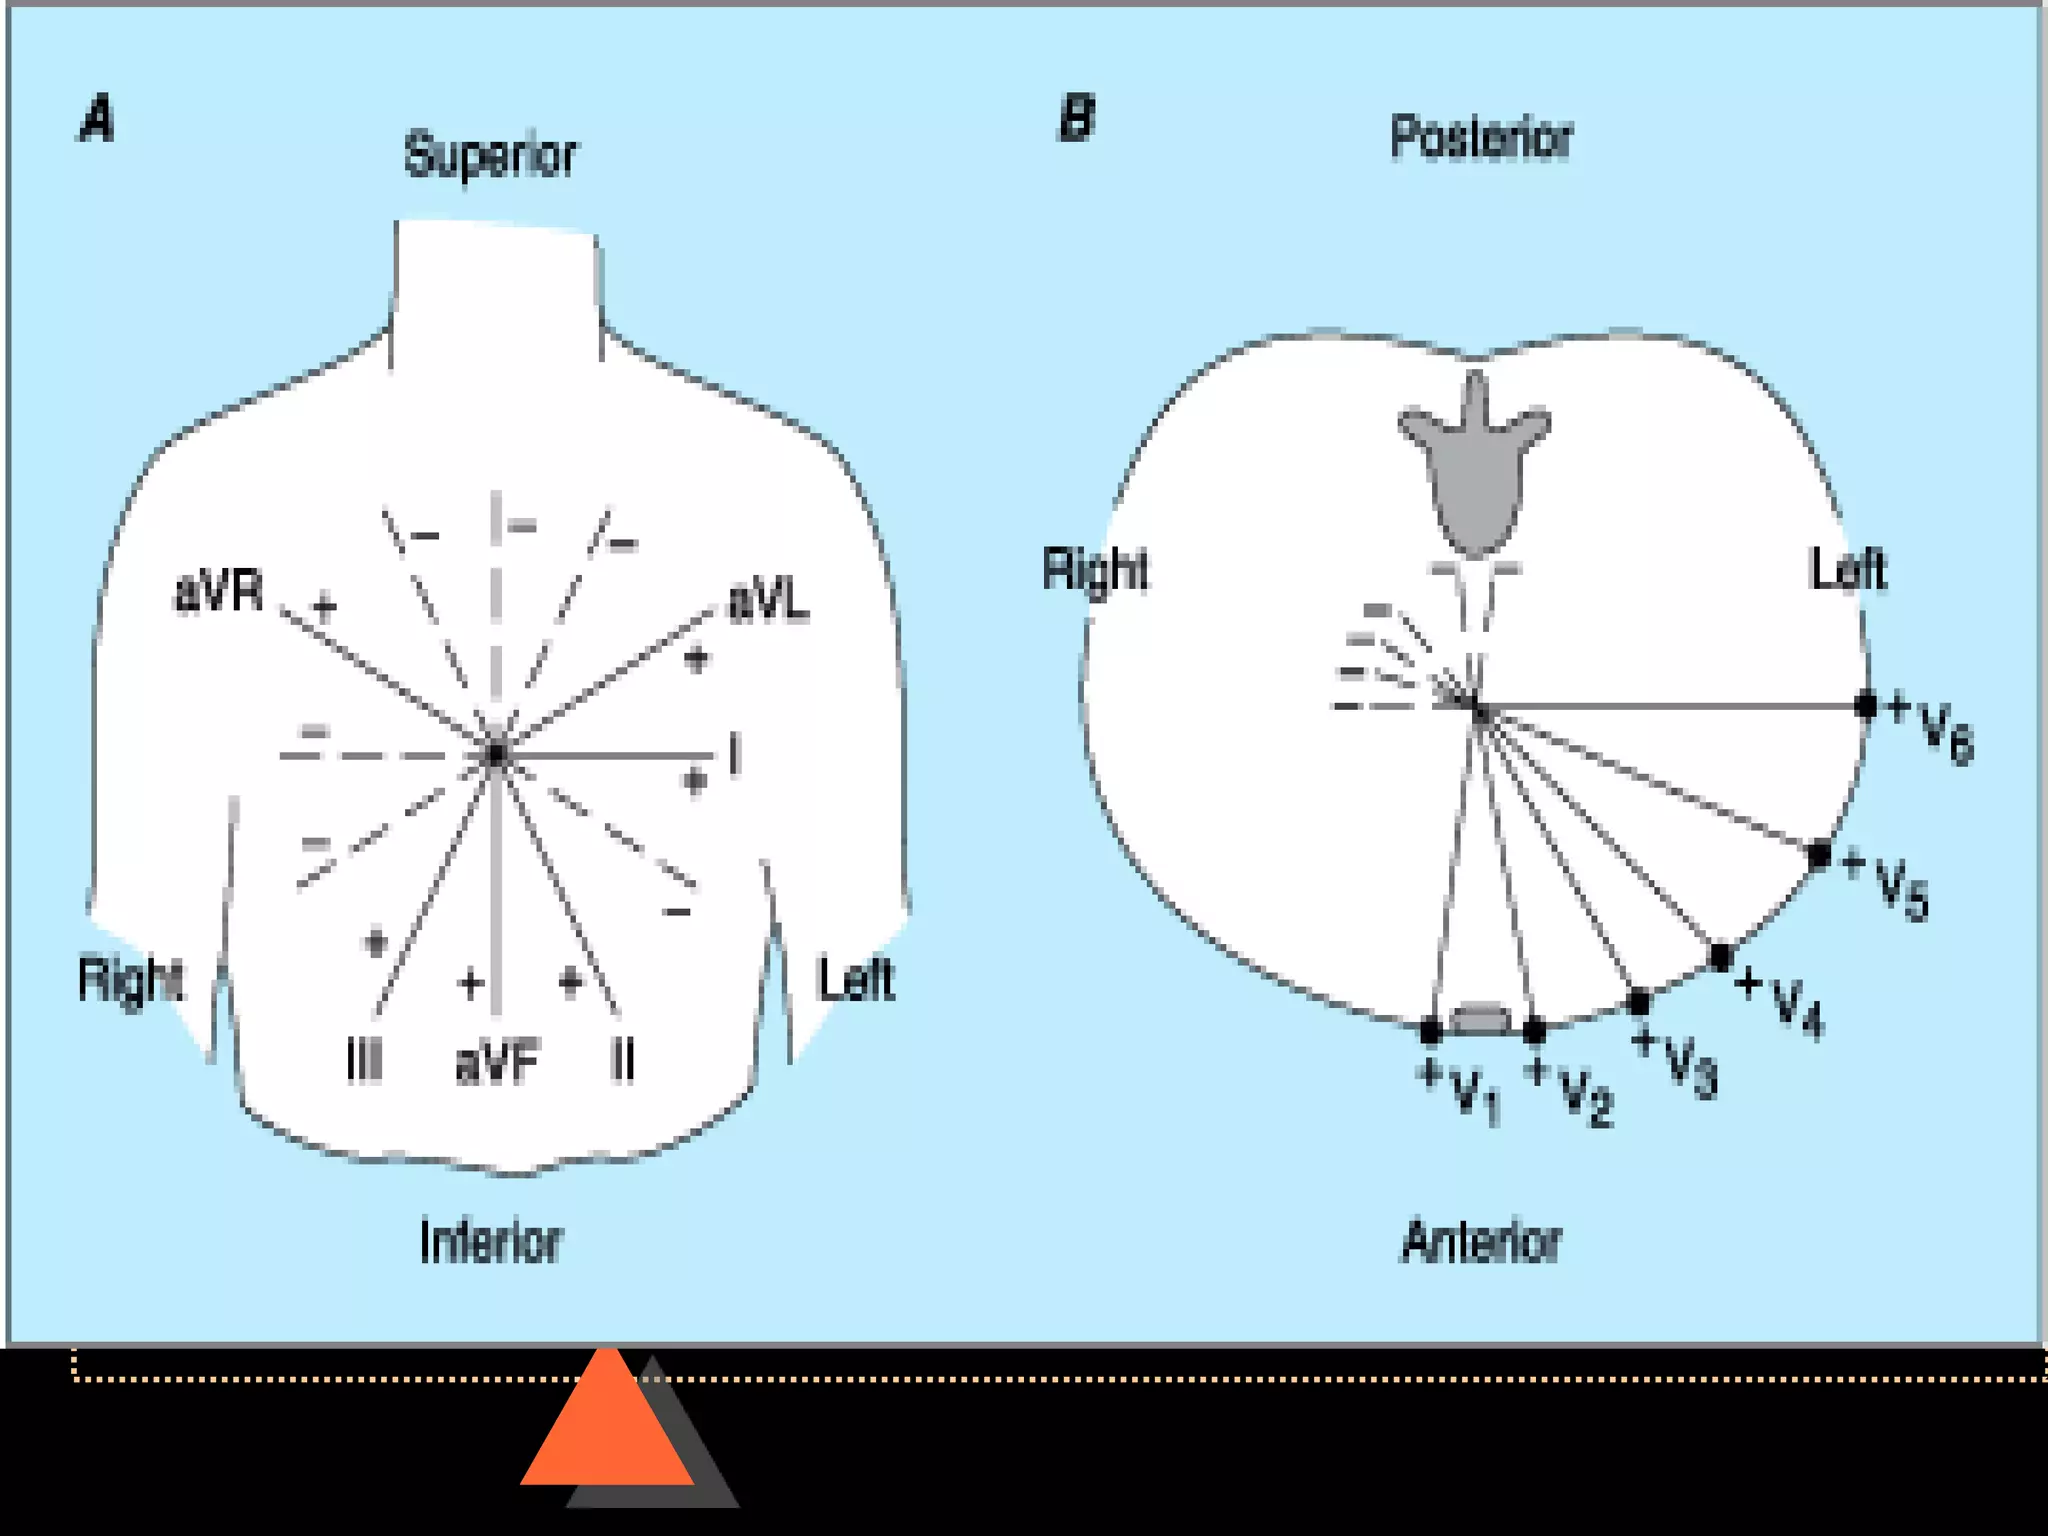
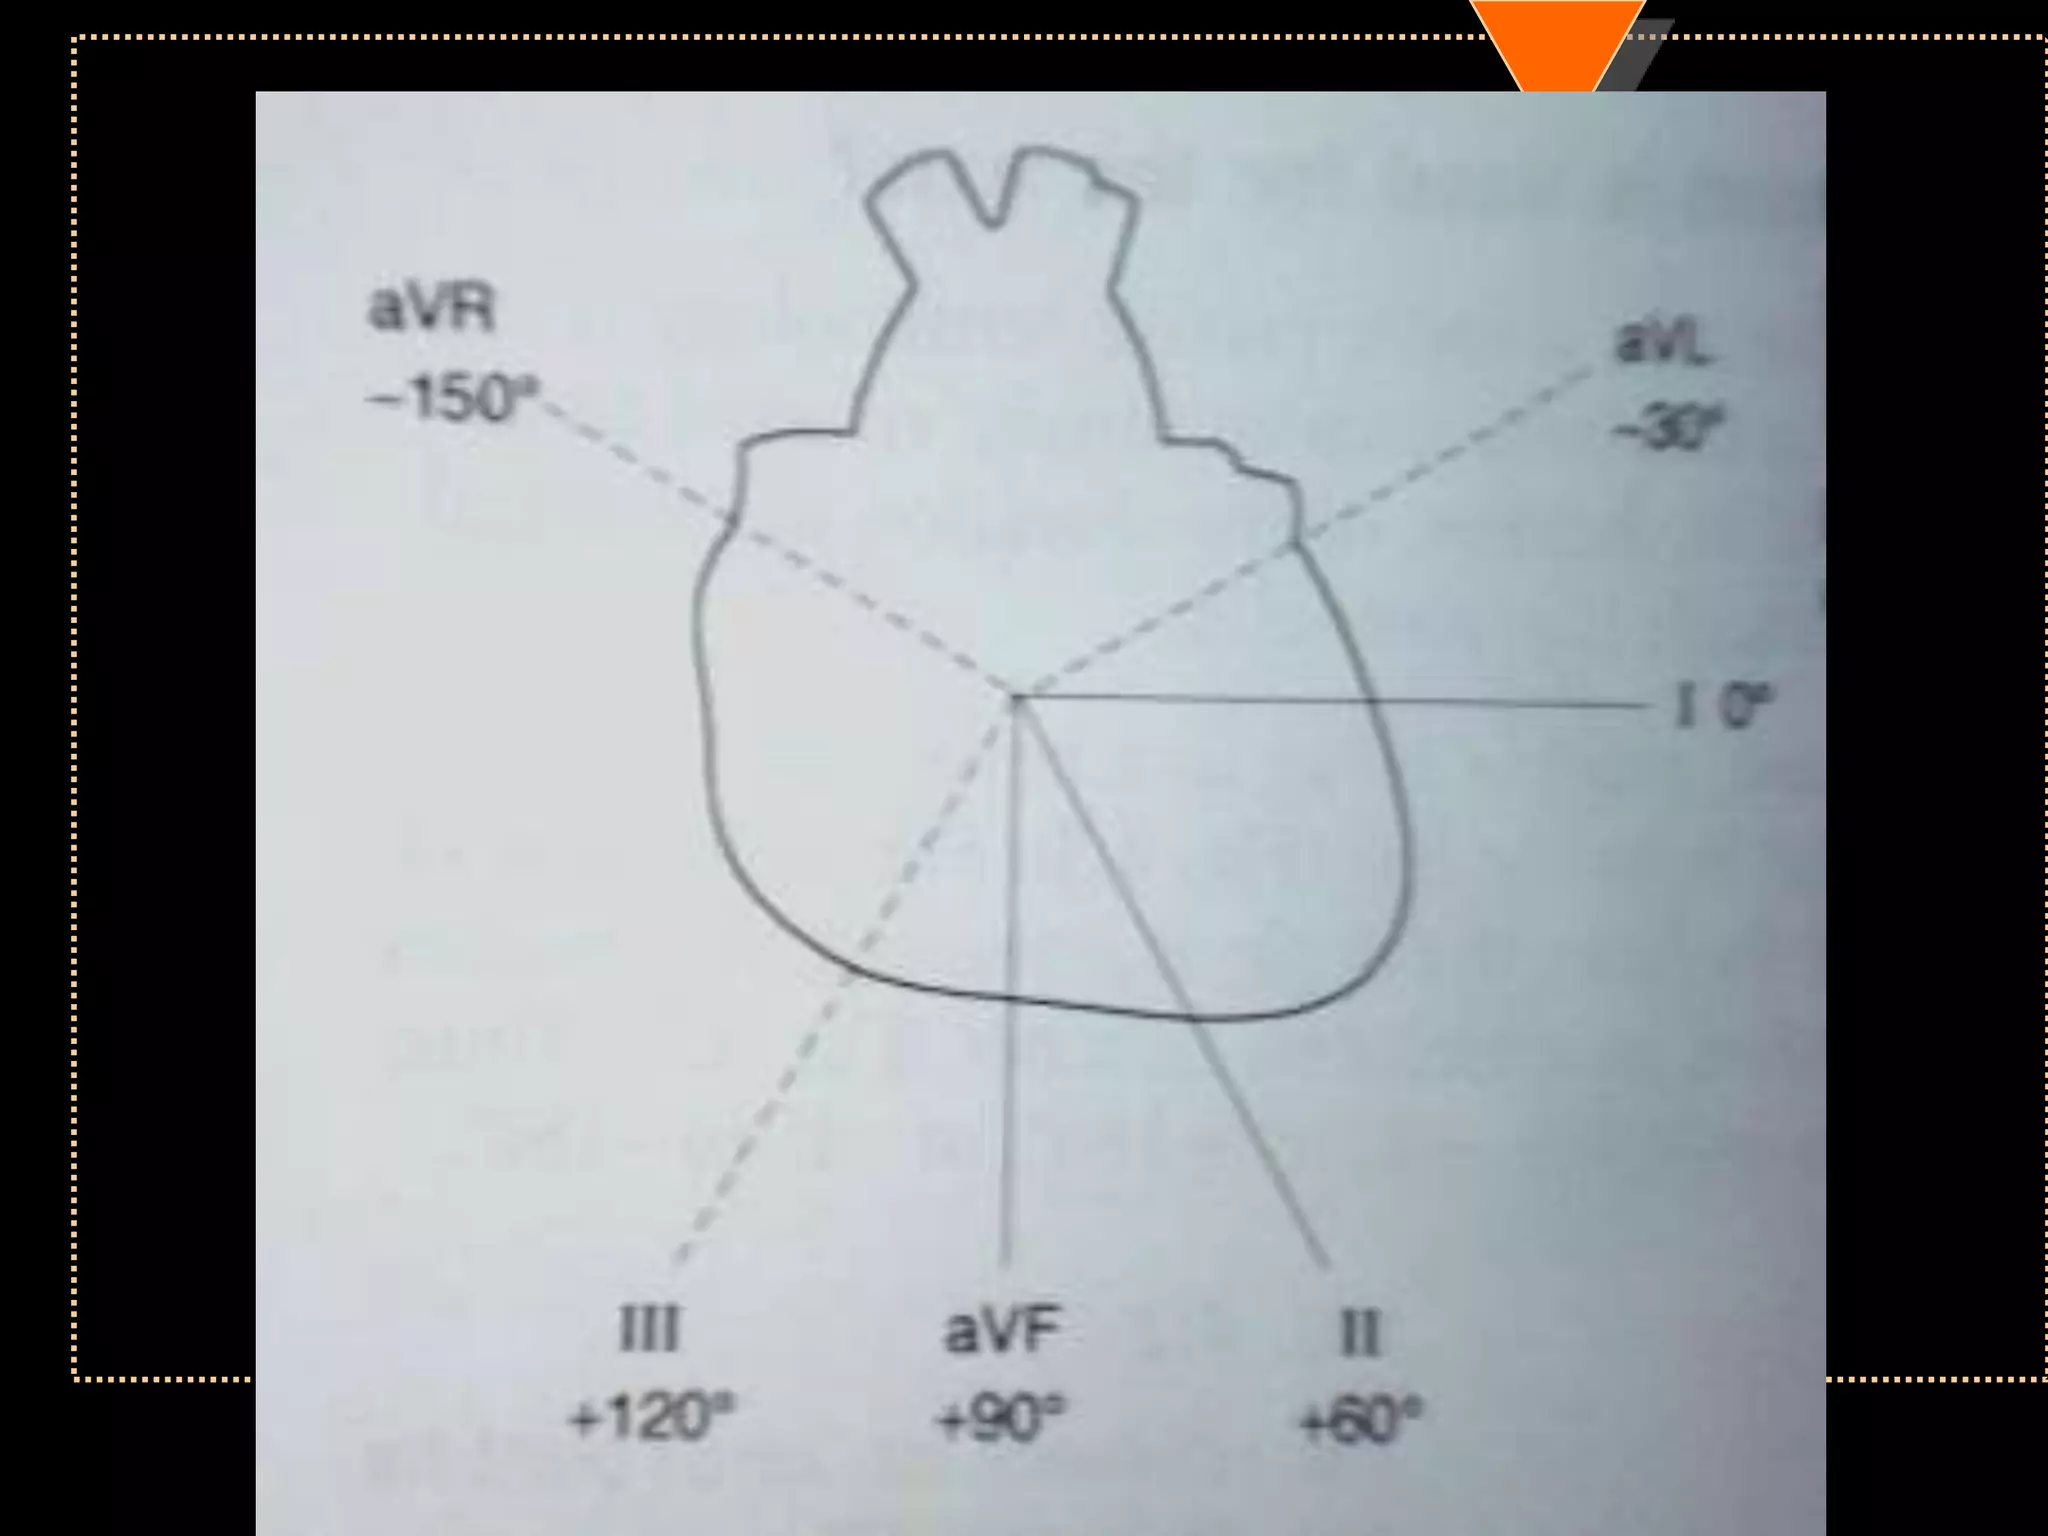
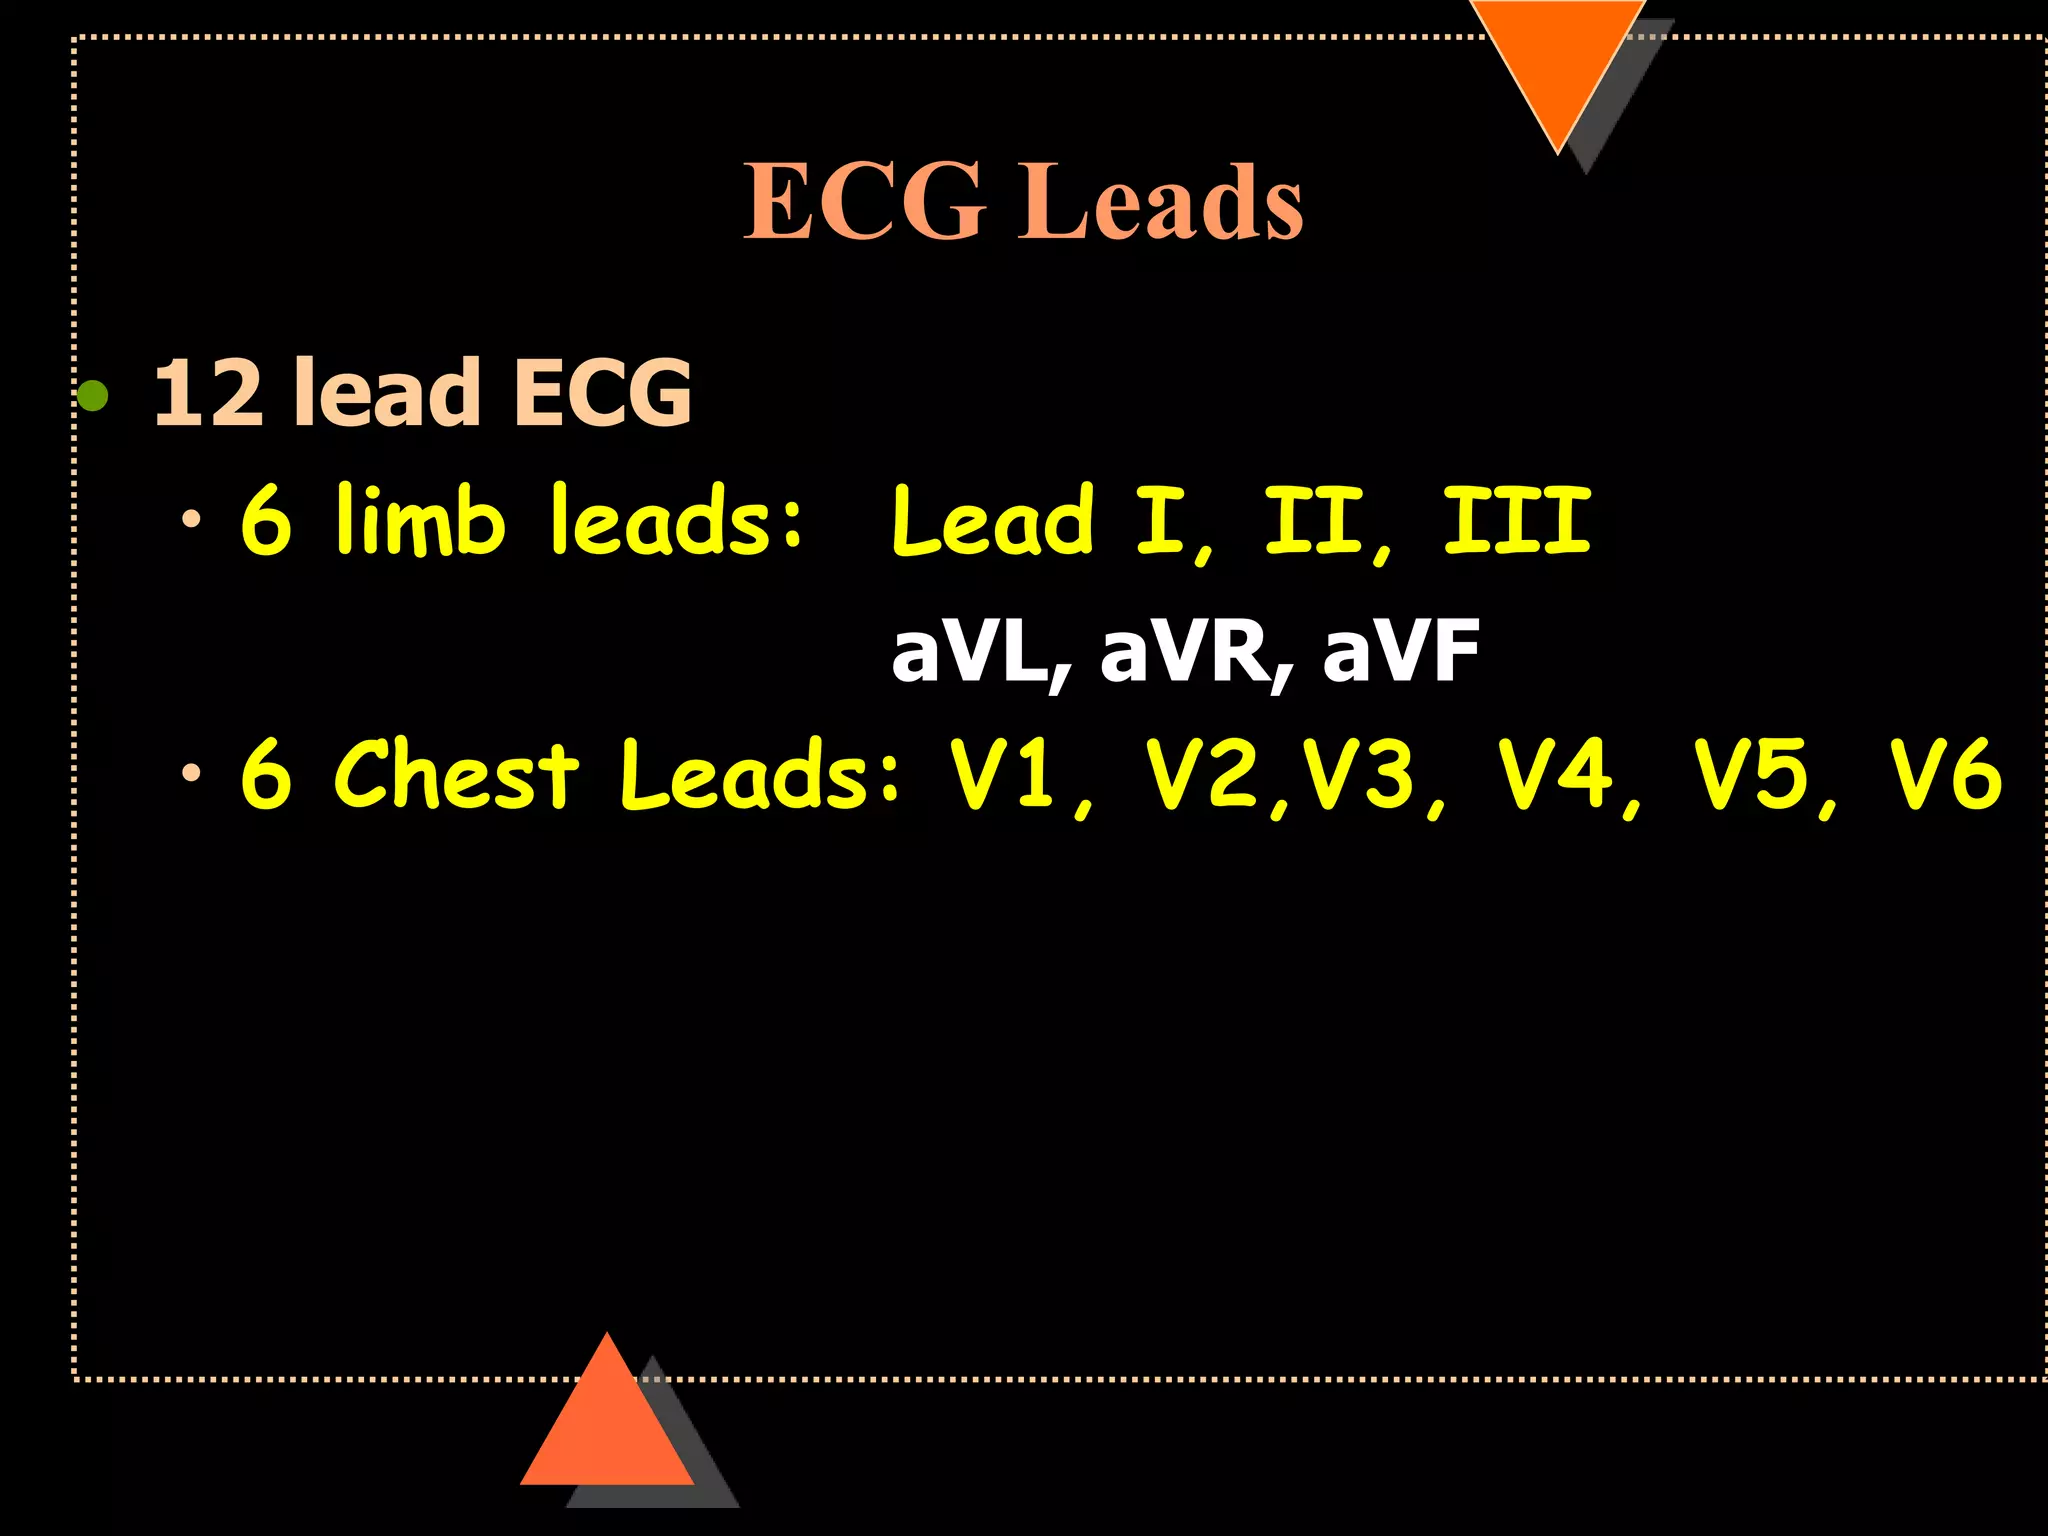
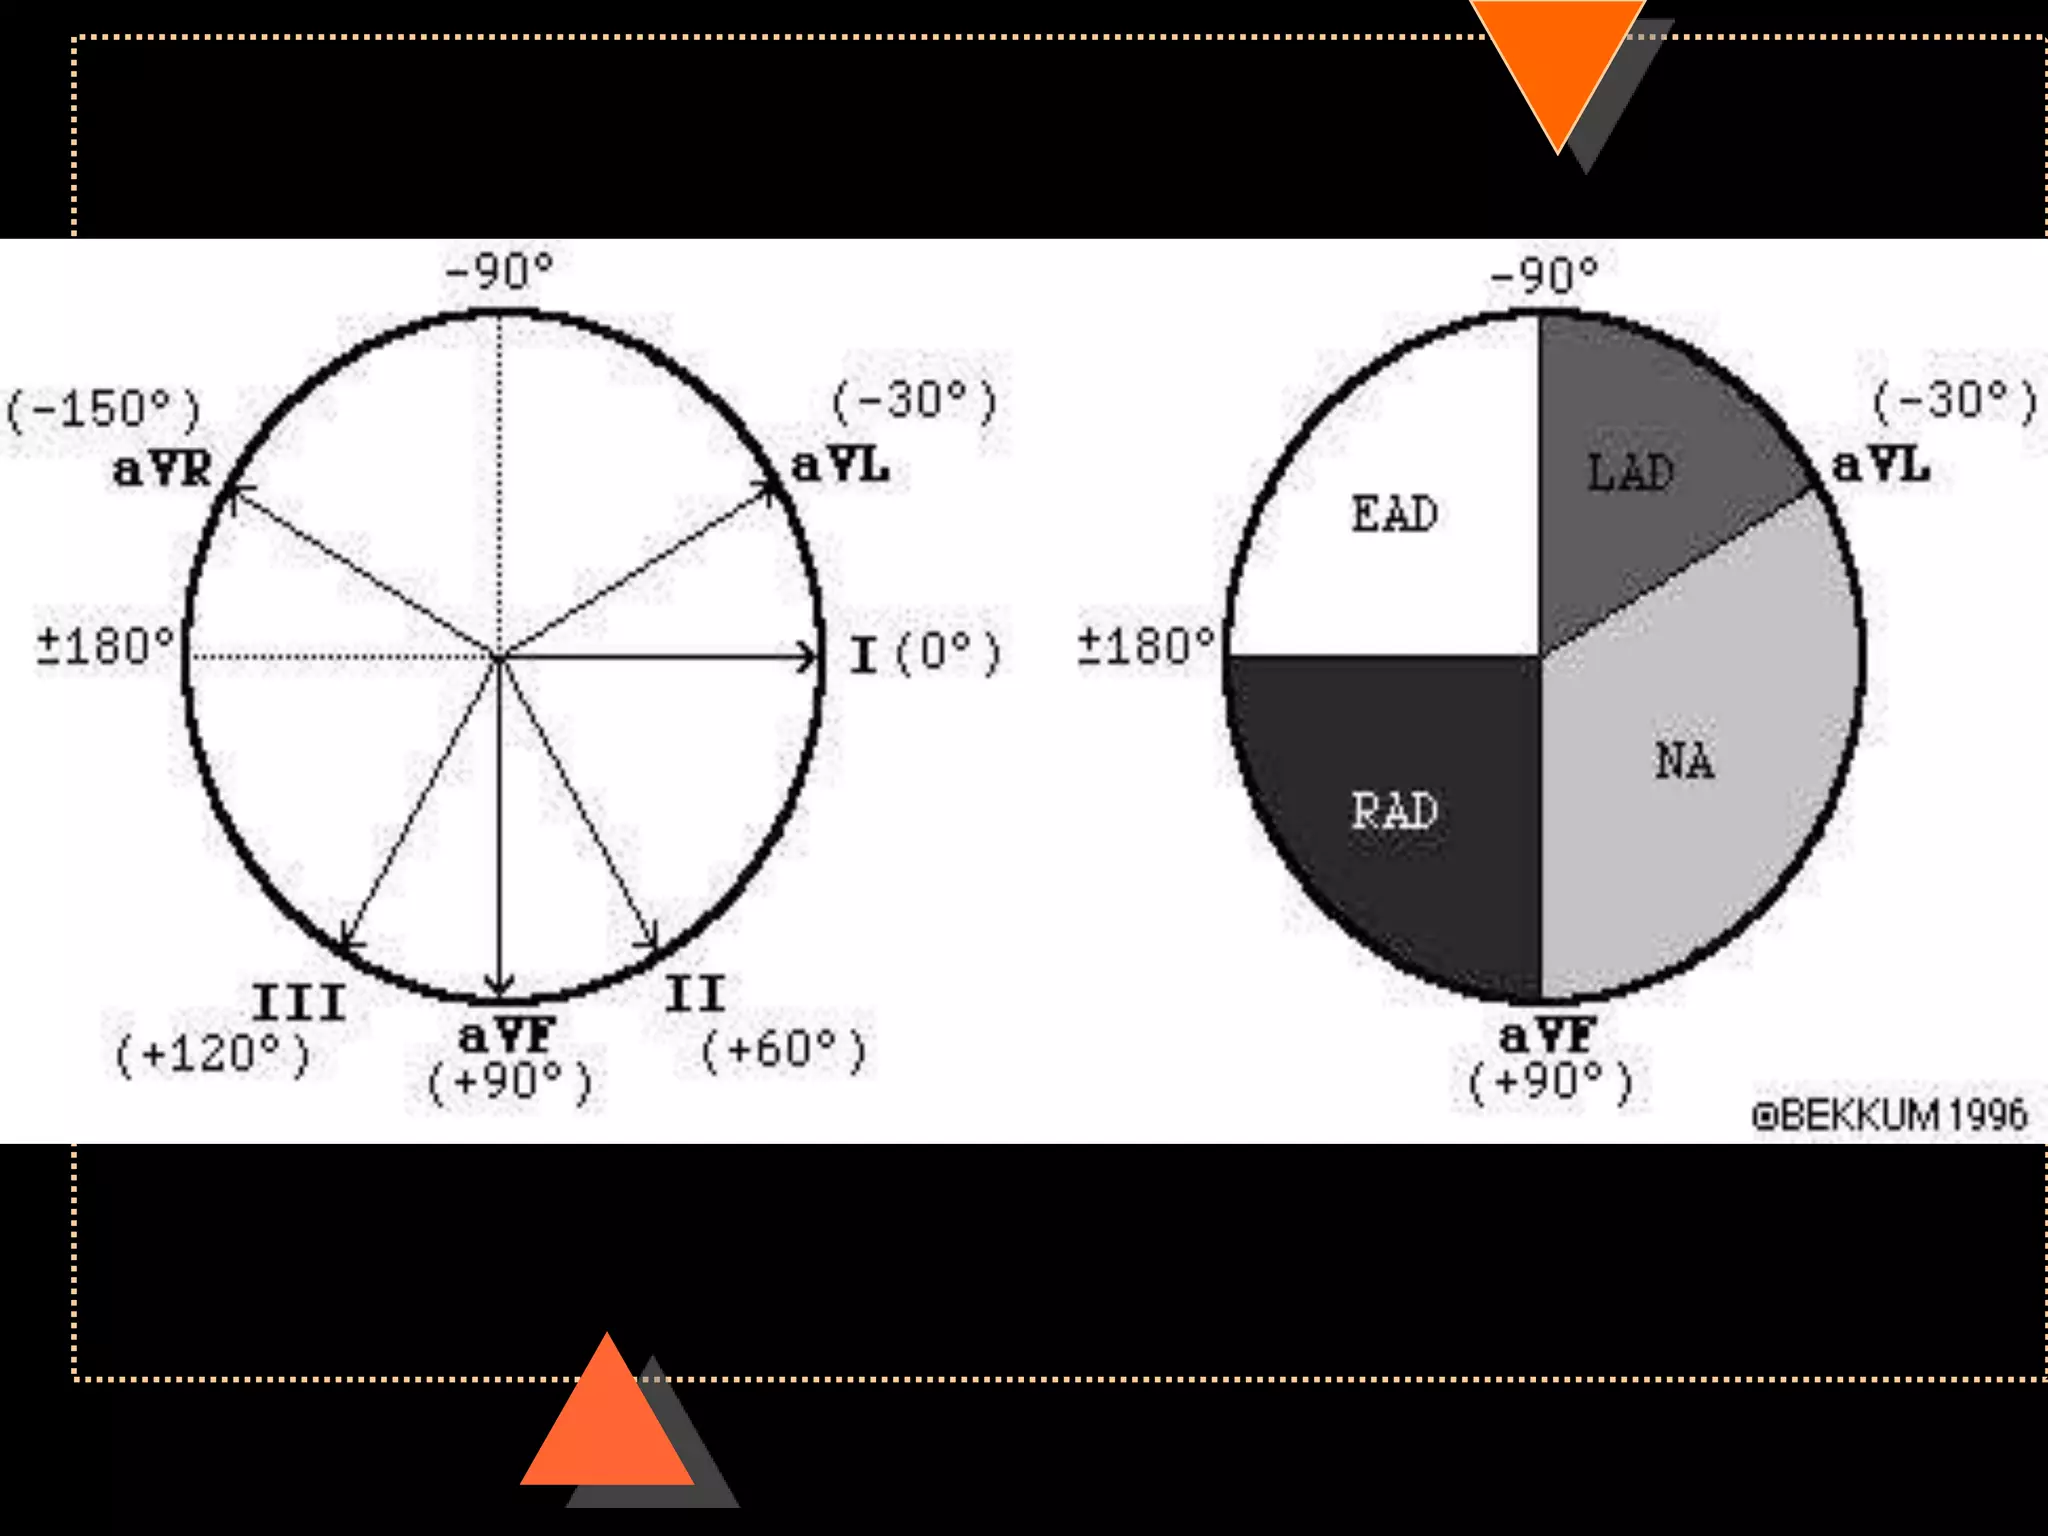
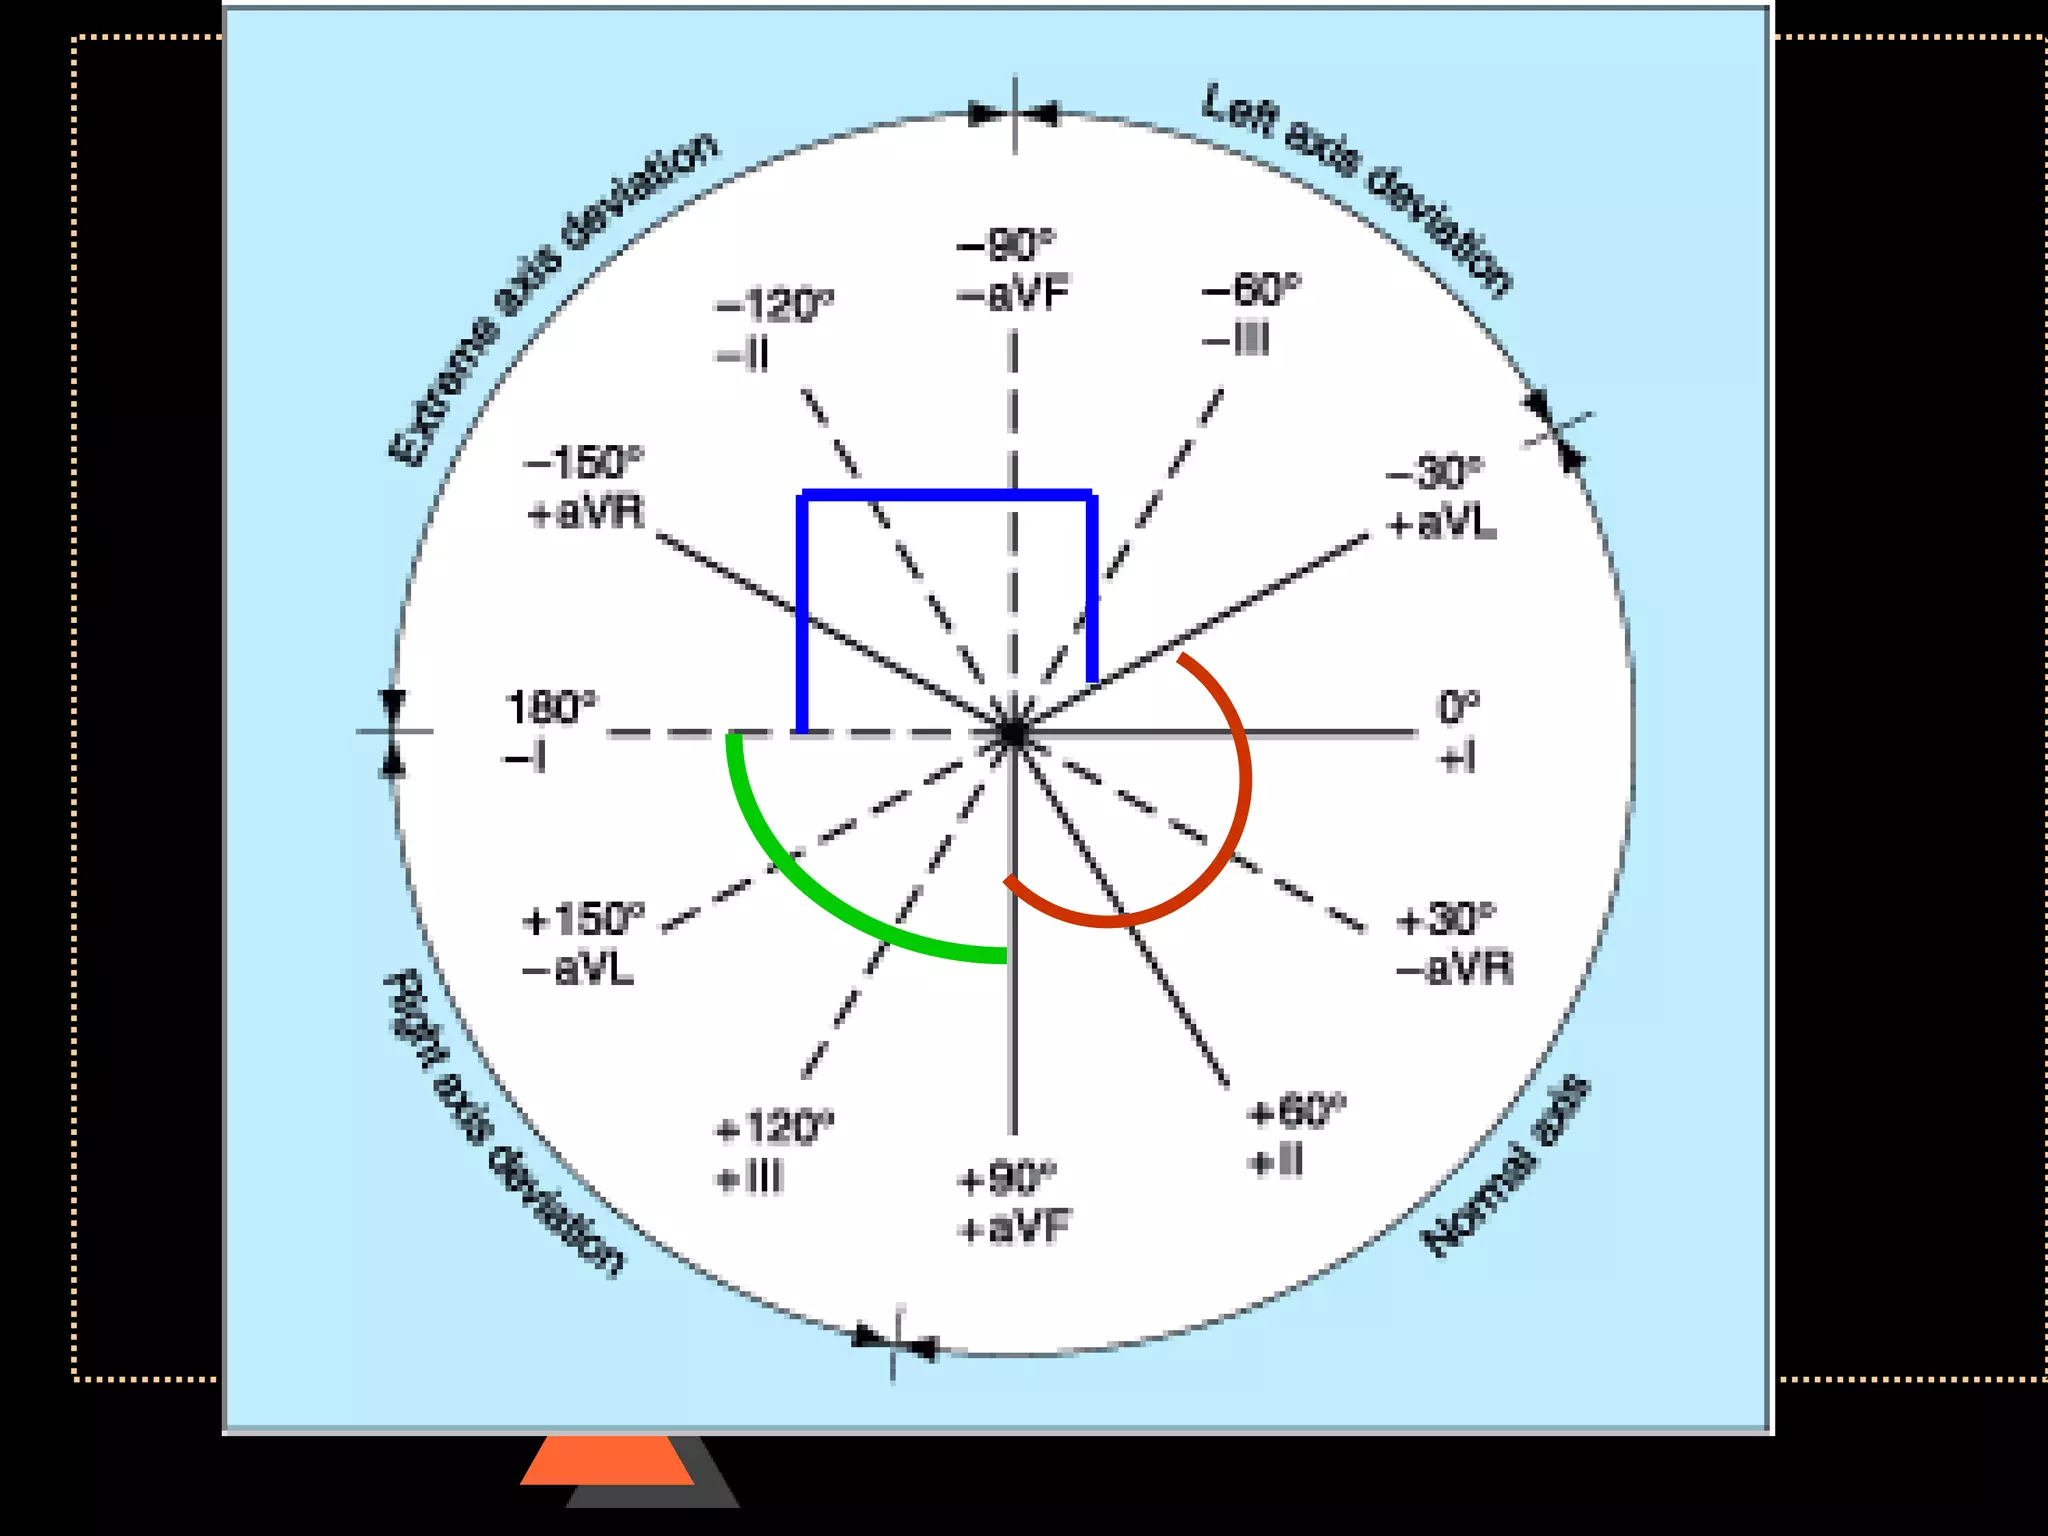
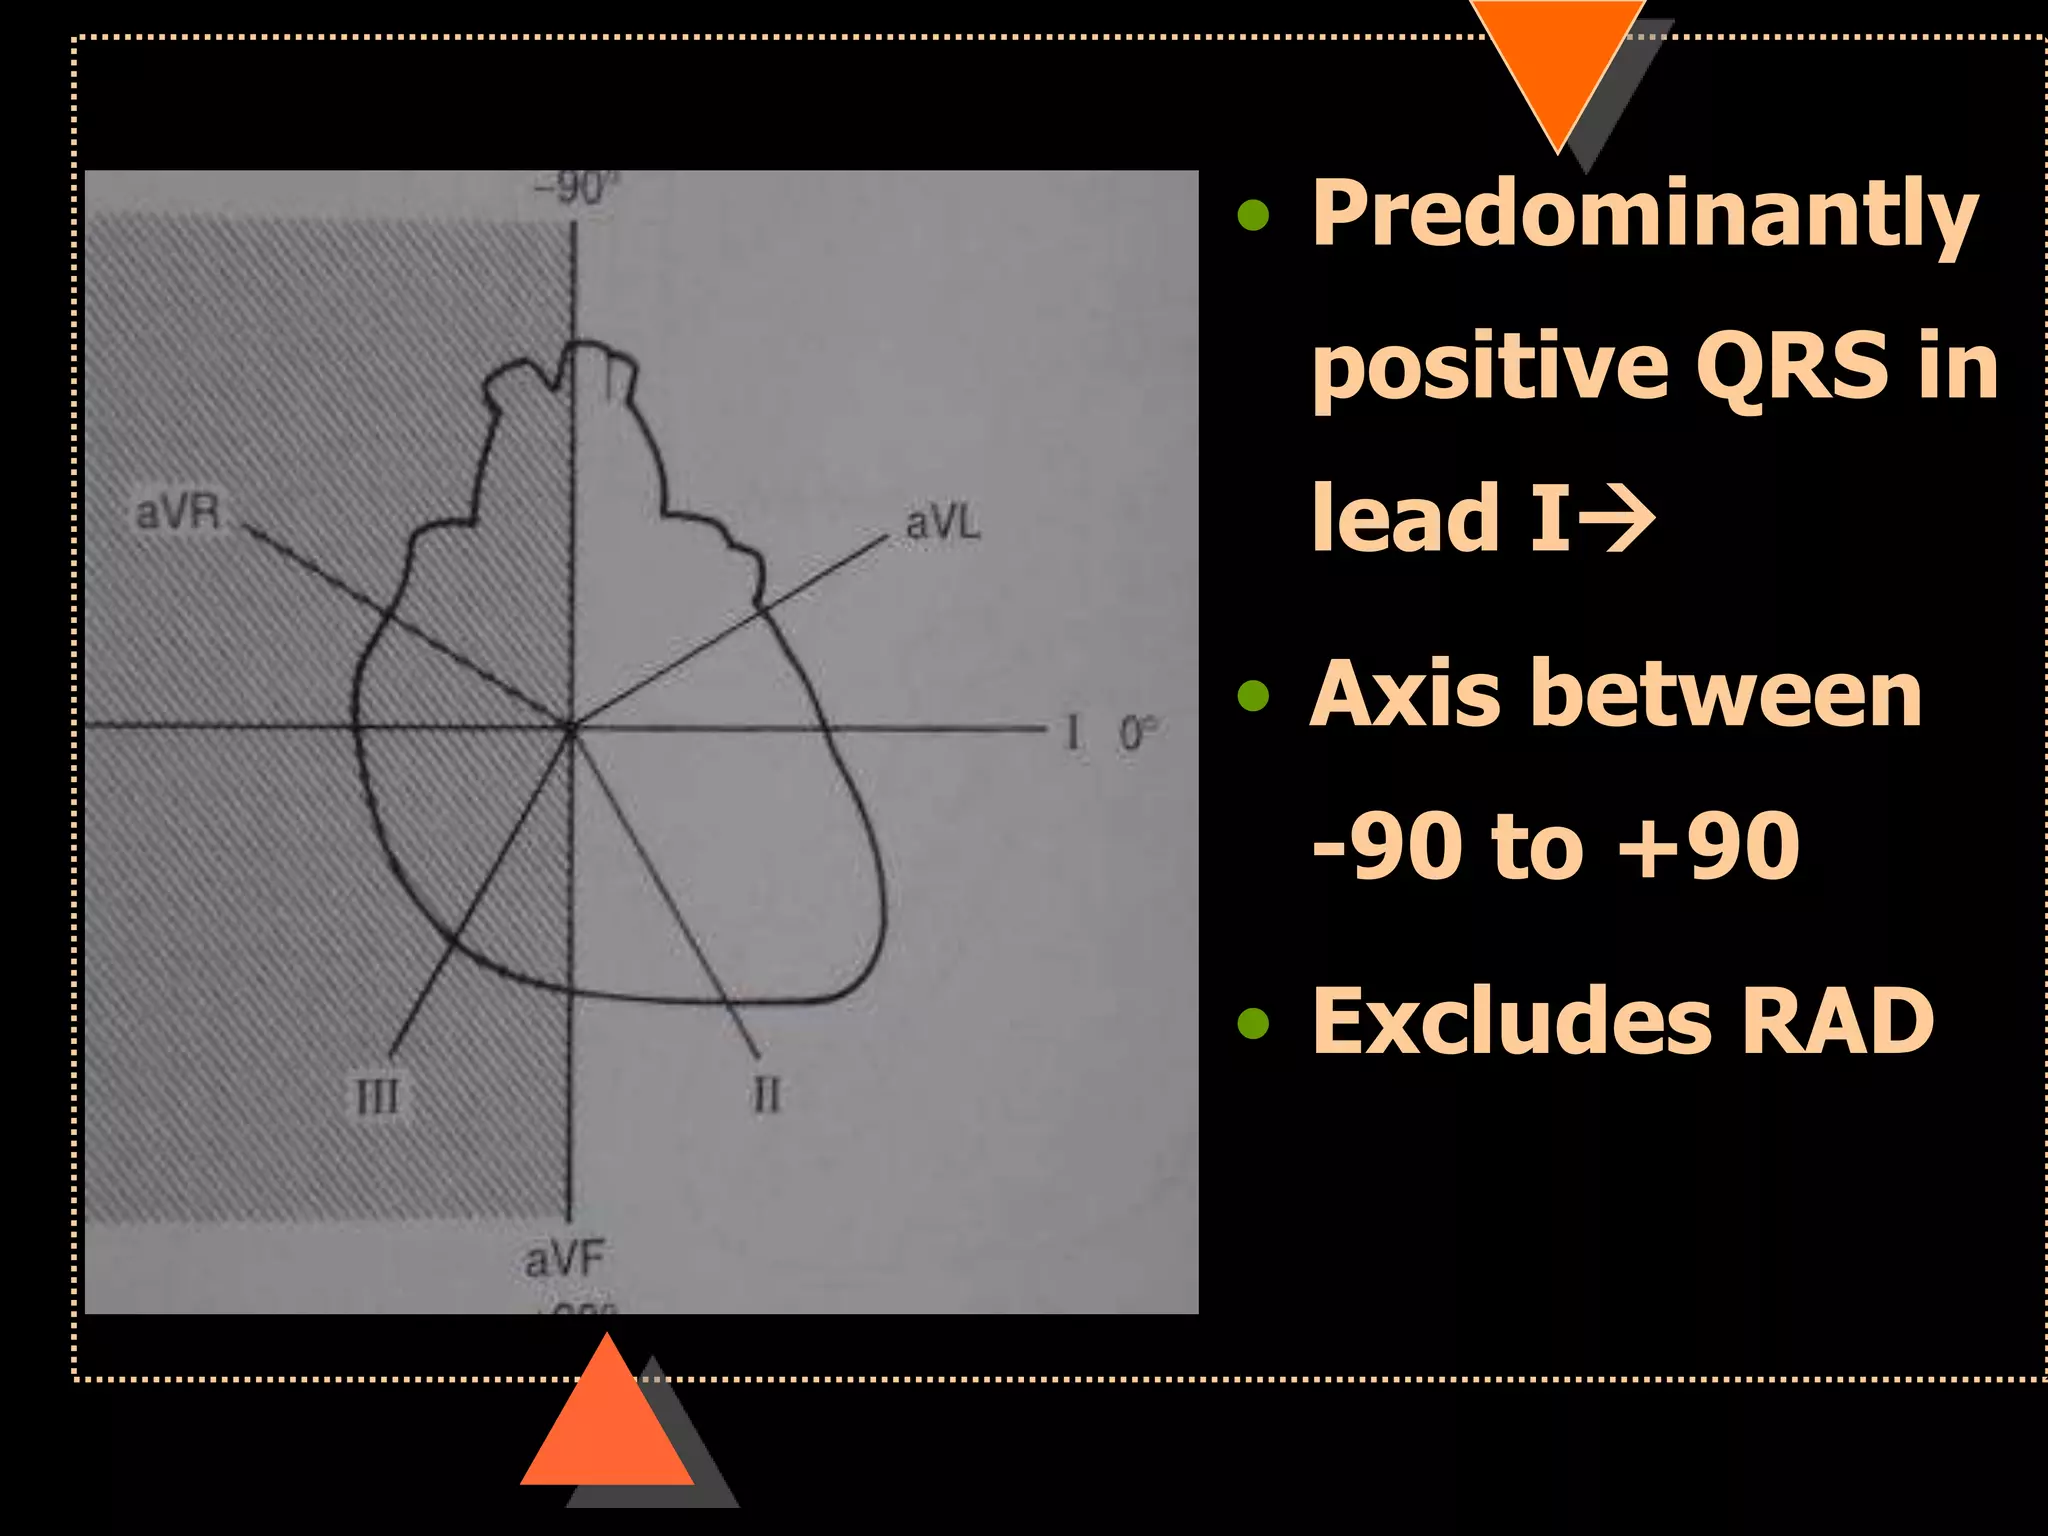
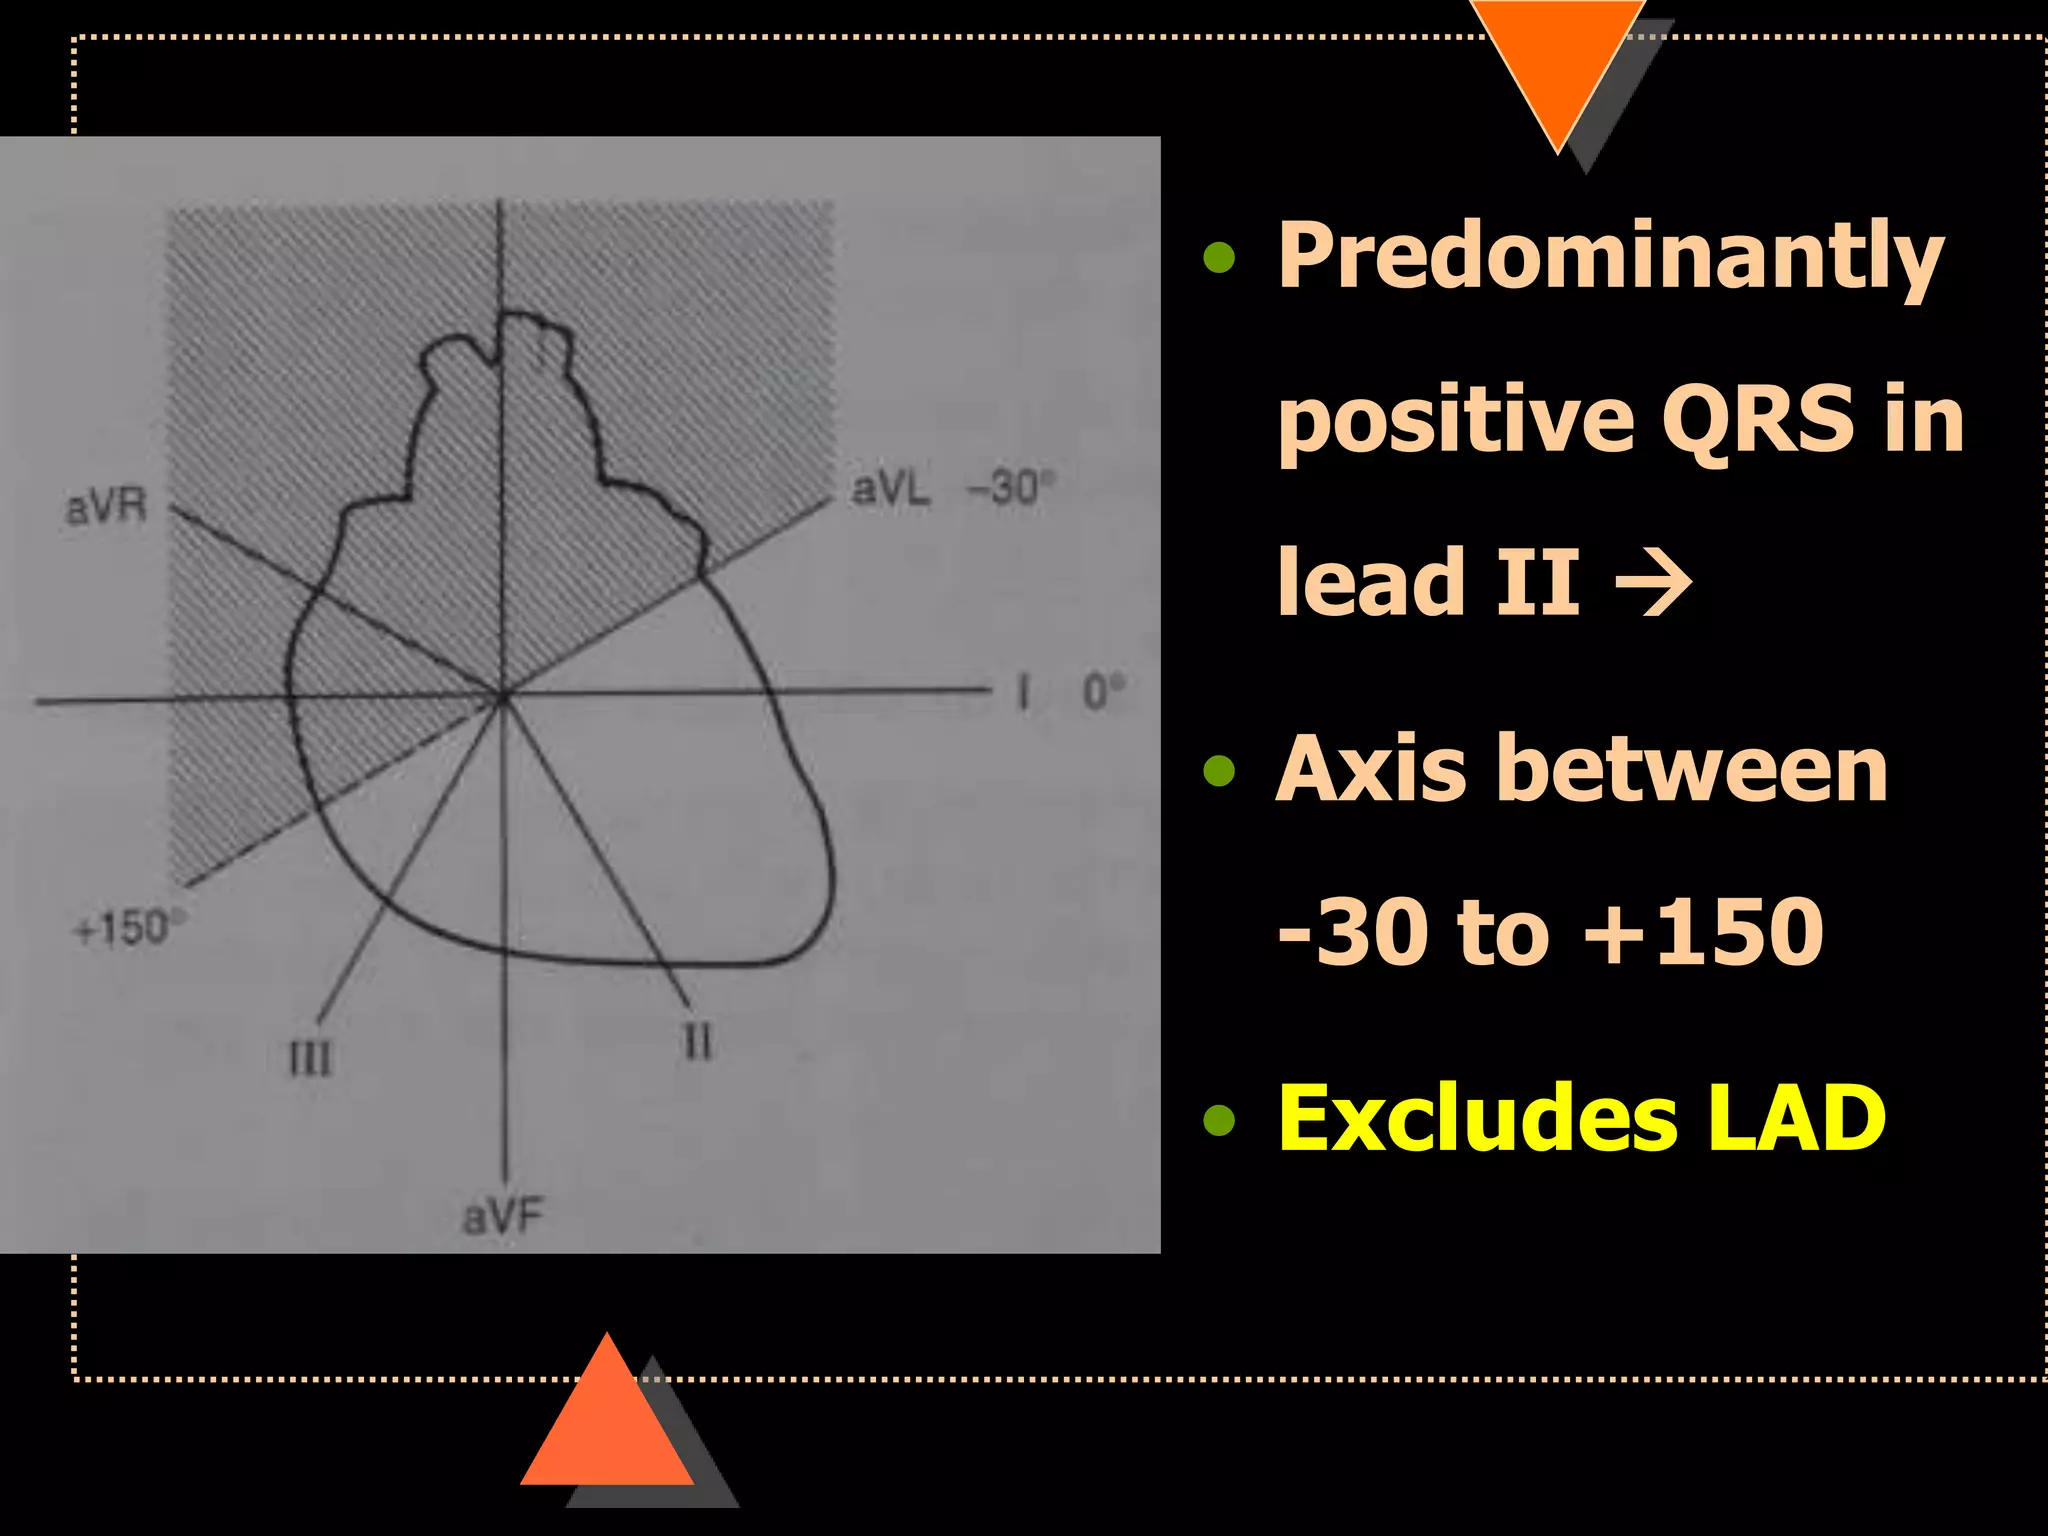
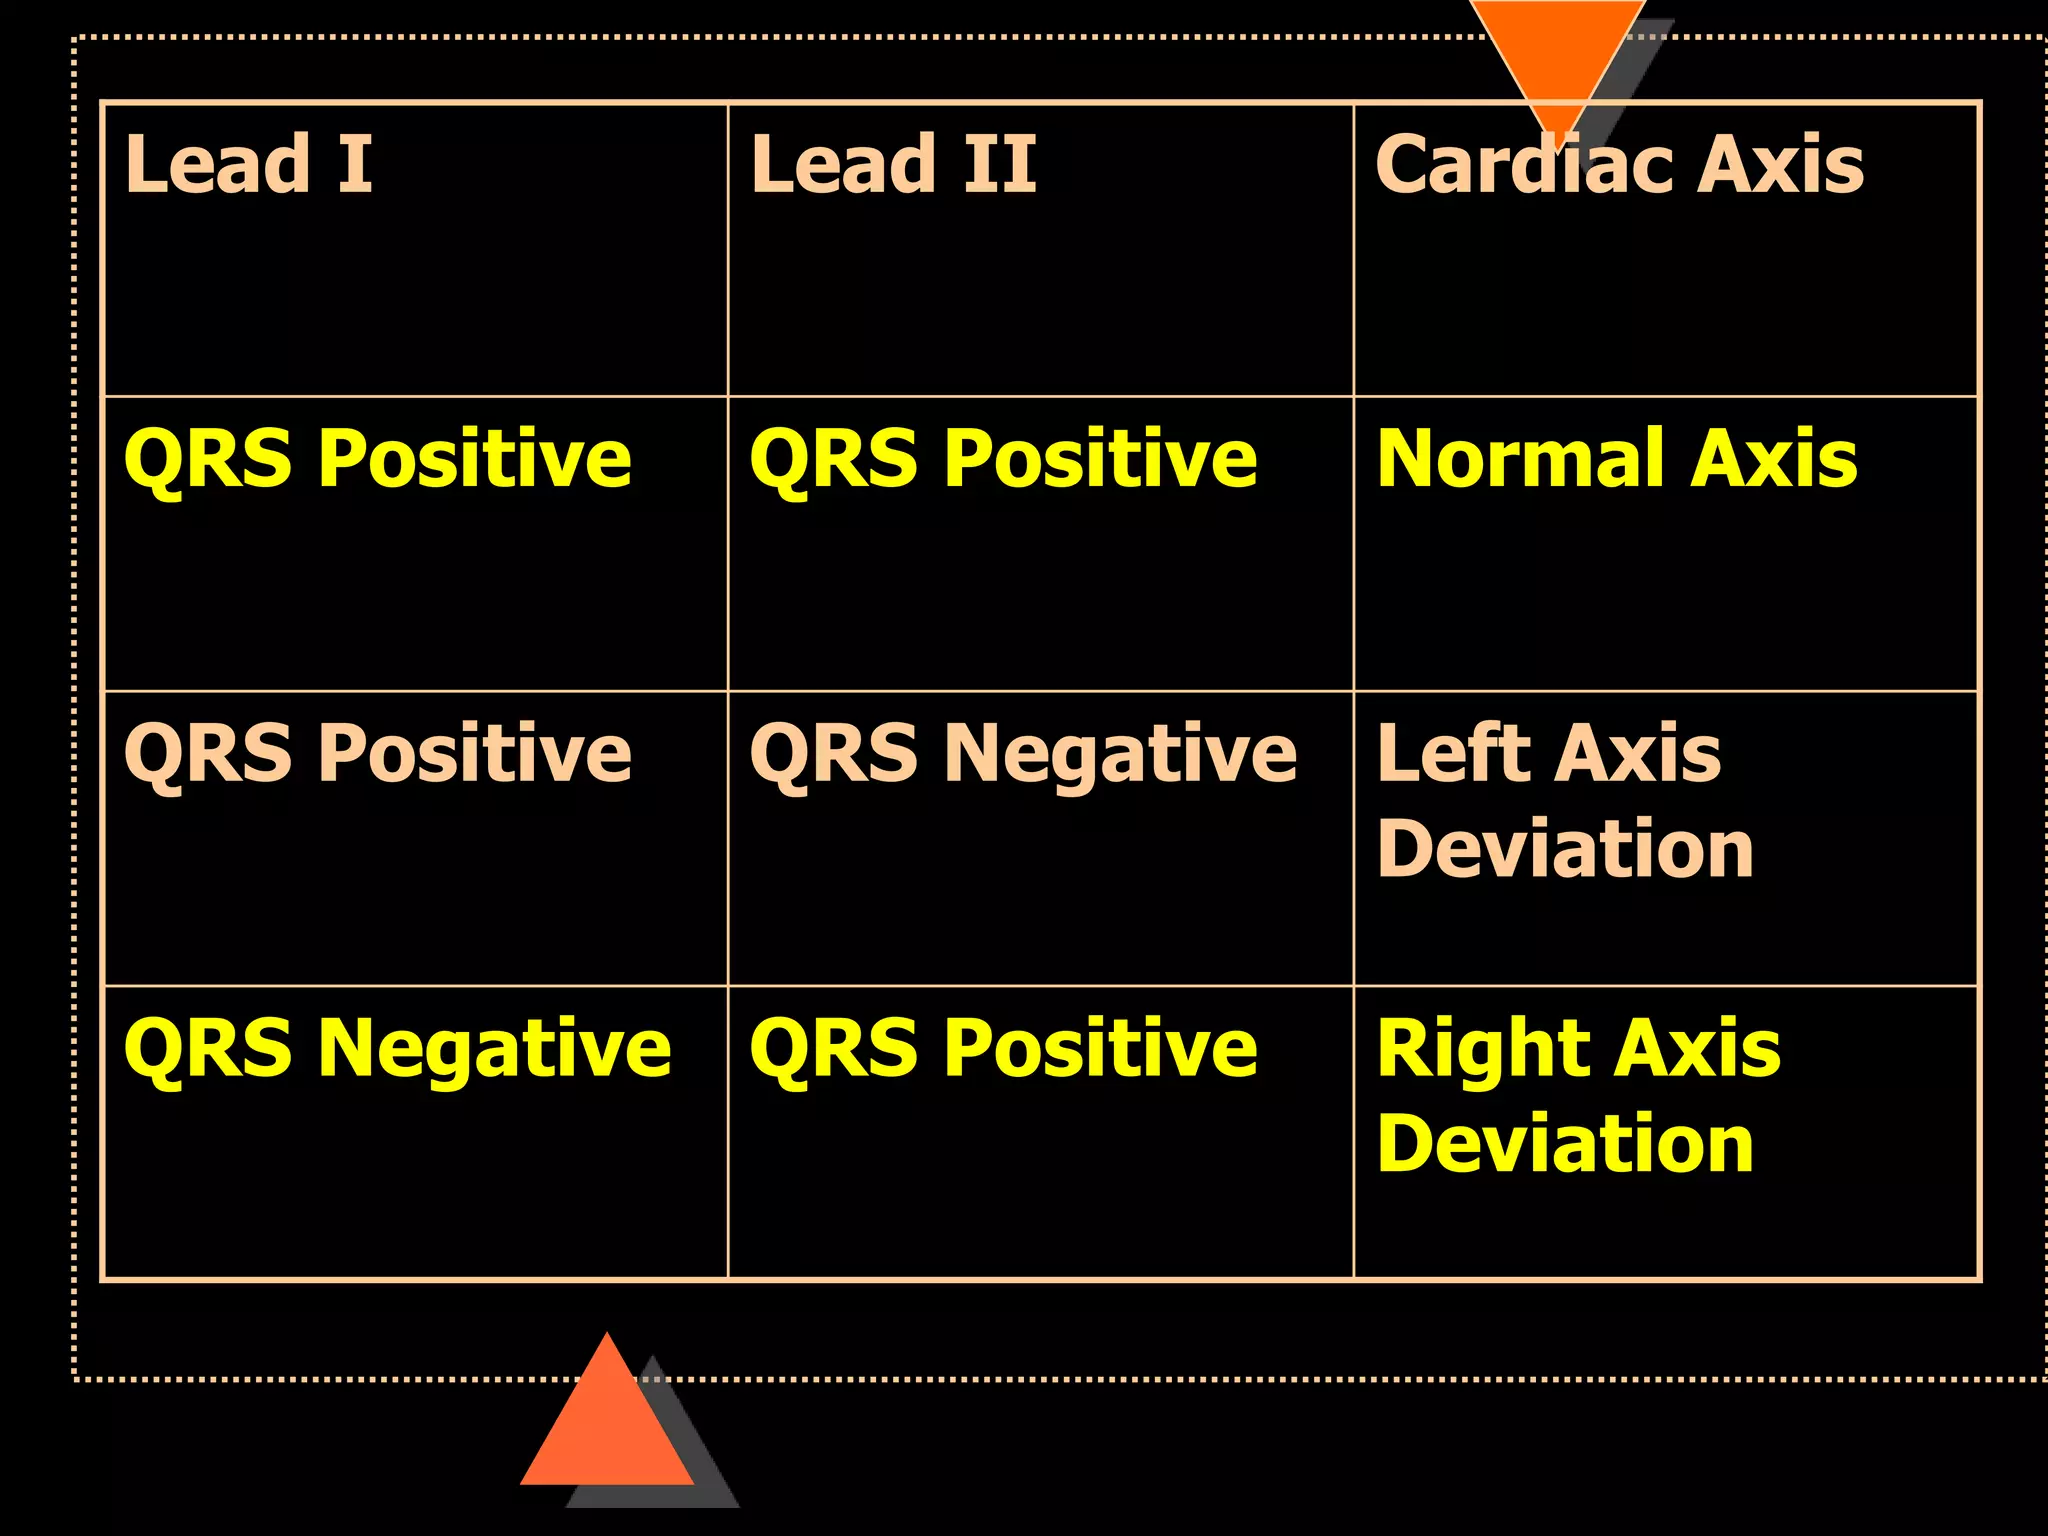
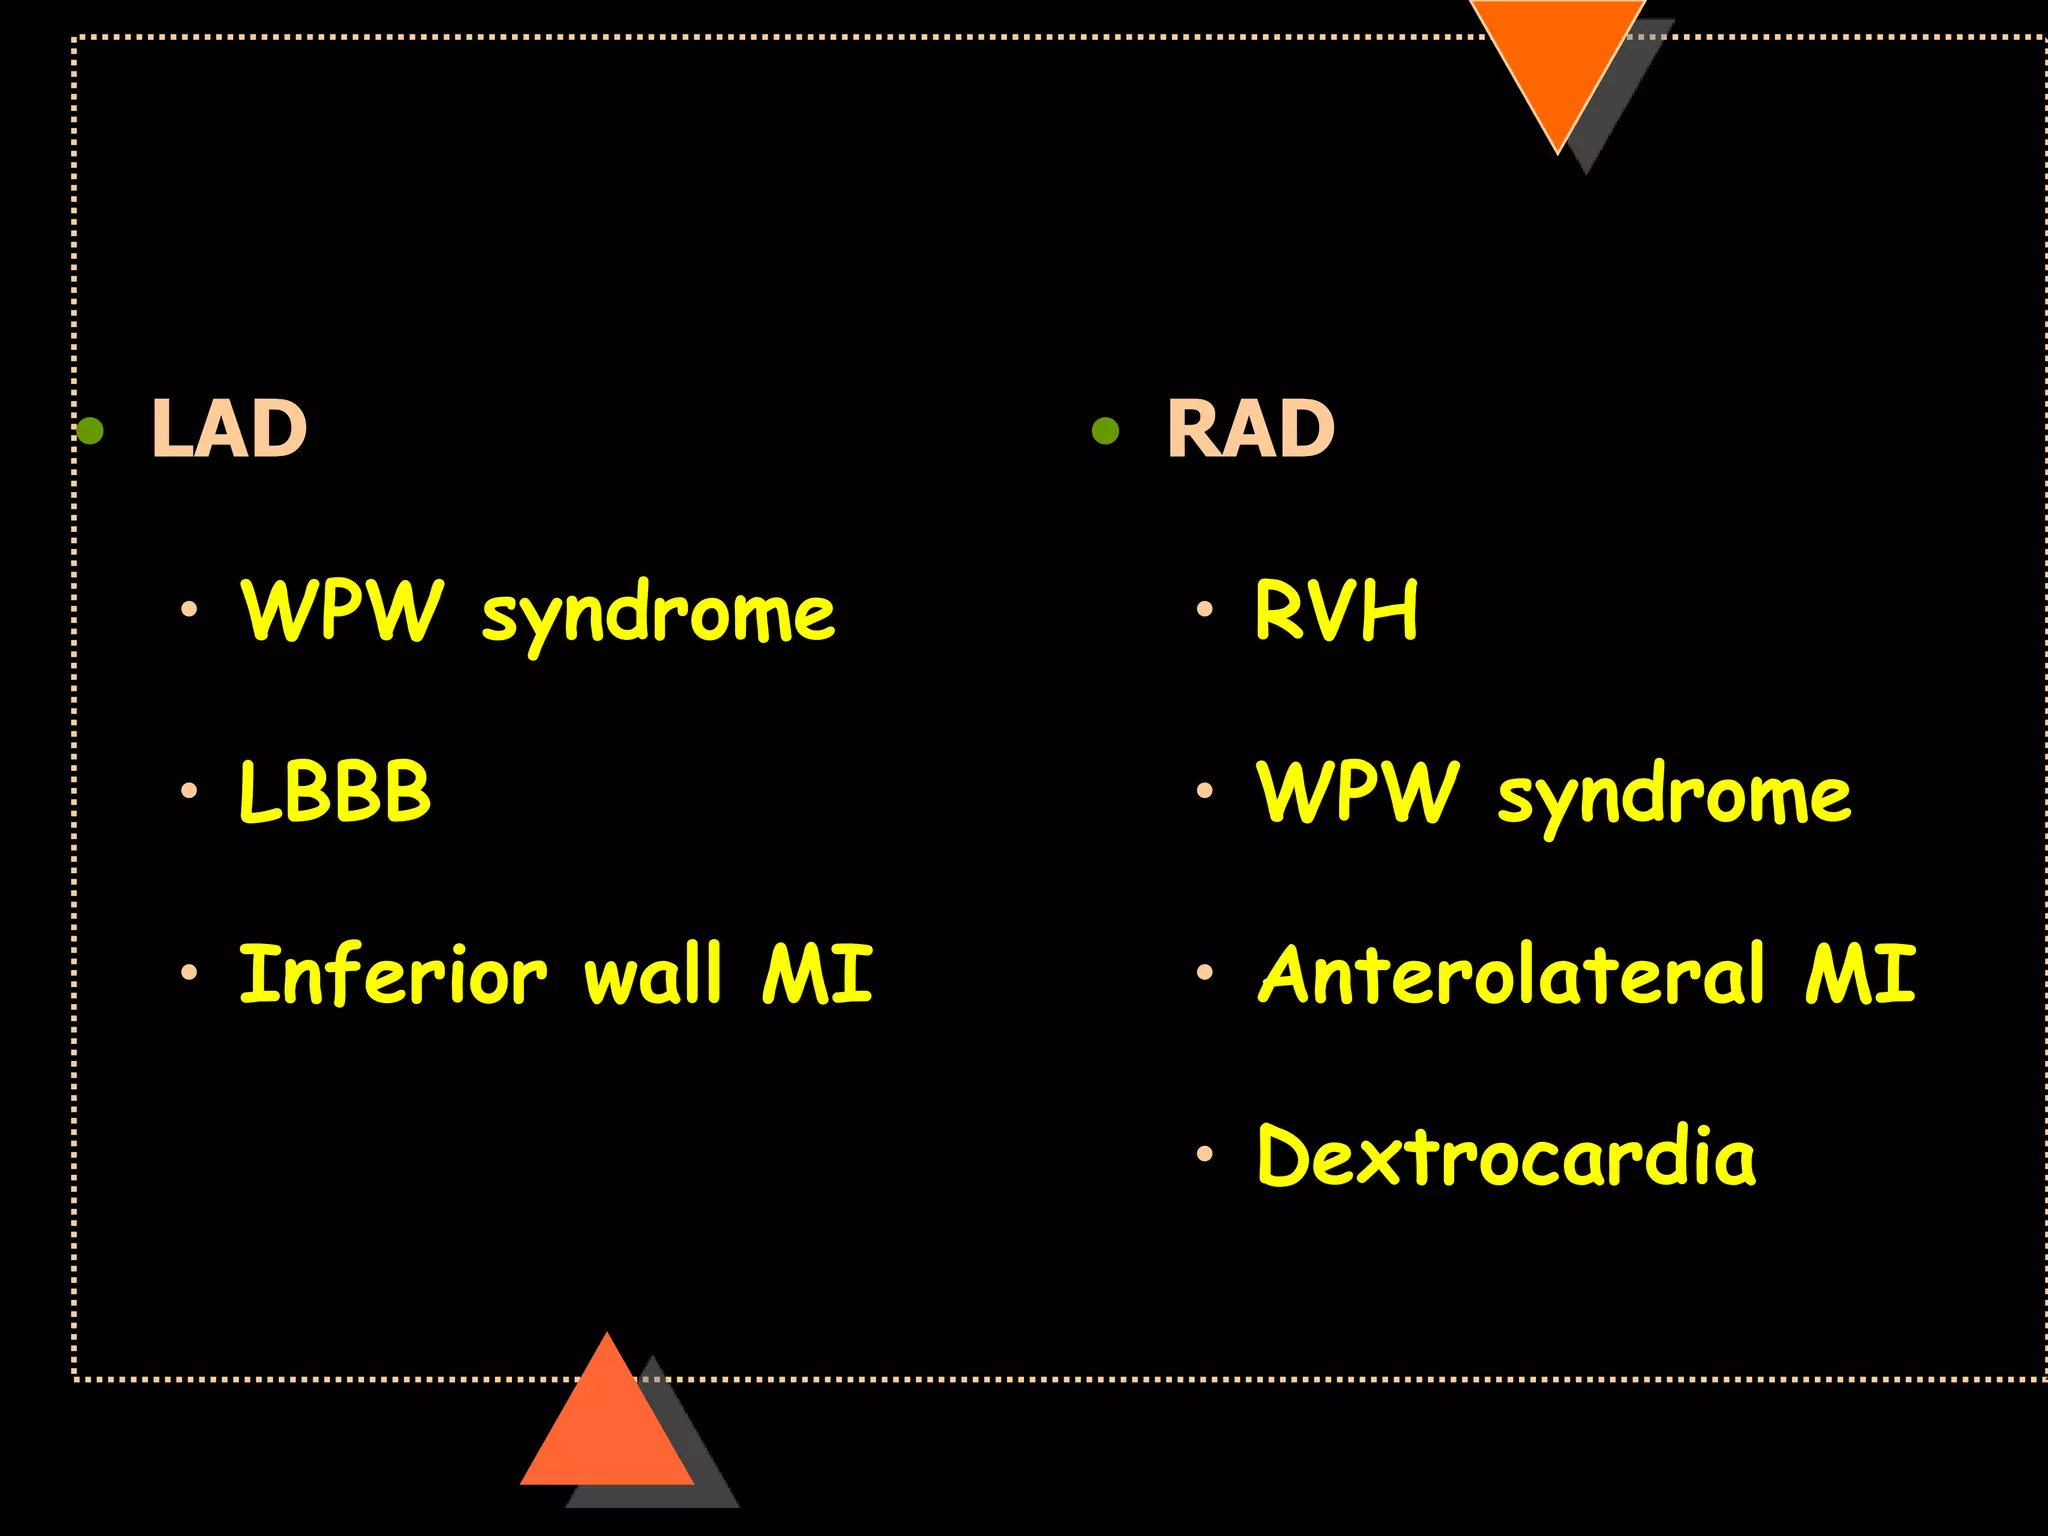
![• Right axis deviation [RAD]
• Beyond +90°
• Left Axis Deviation [LAD]
• Beyond -30°](https://image.slidesharecdn.com/howtoreadecg-130901100253-phpapp02/75/How-to-read-ECG-31-2048.jpg)
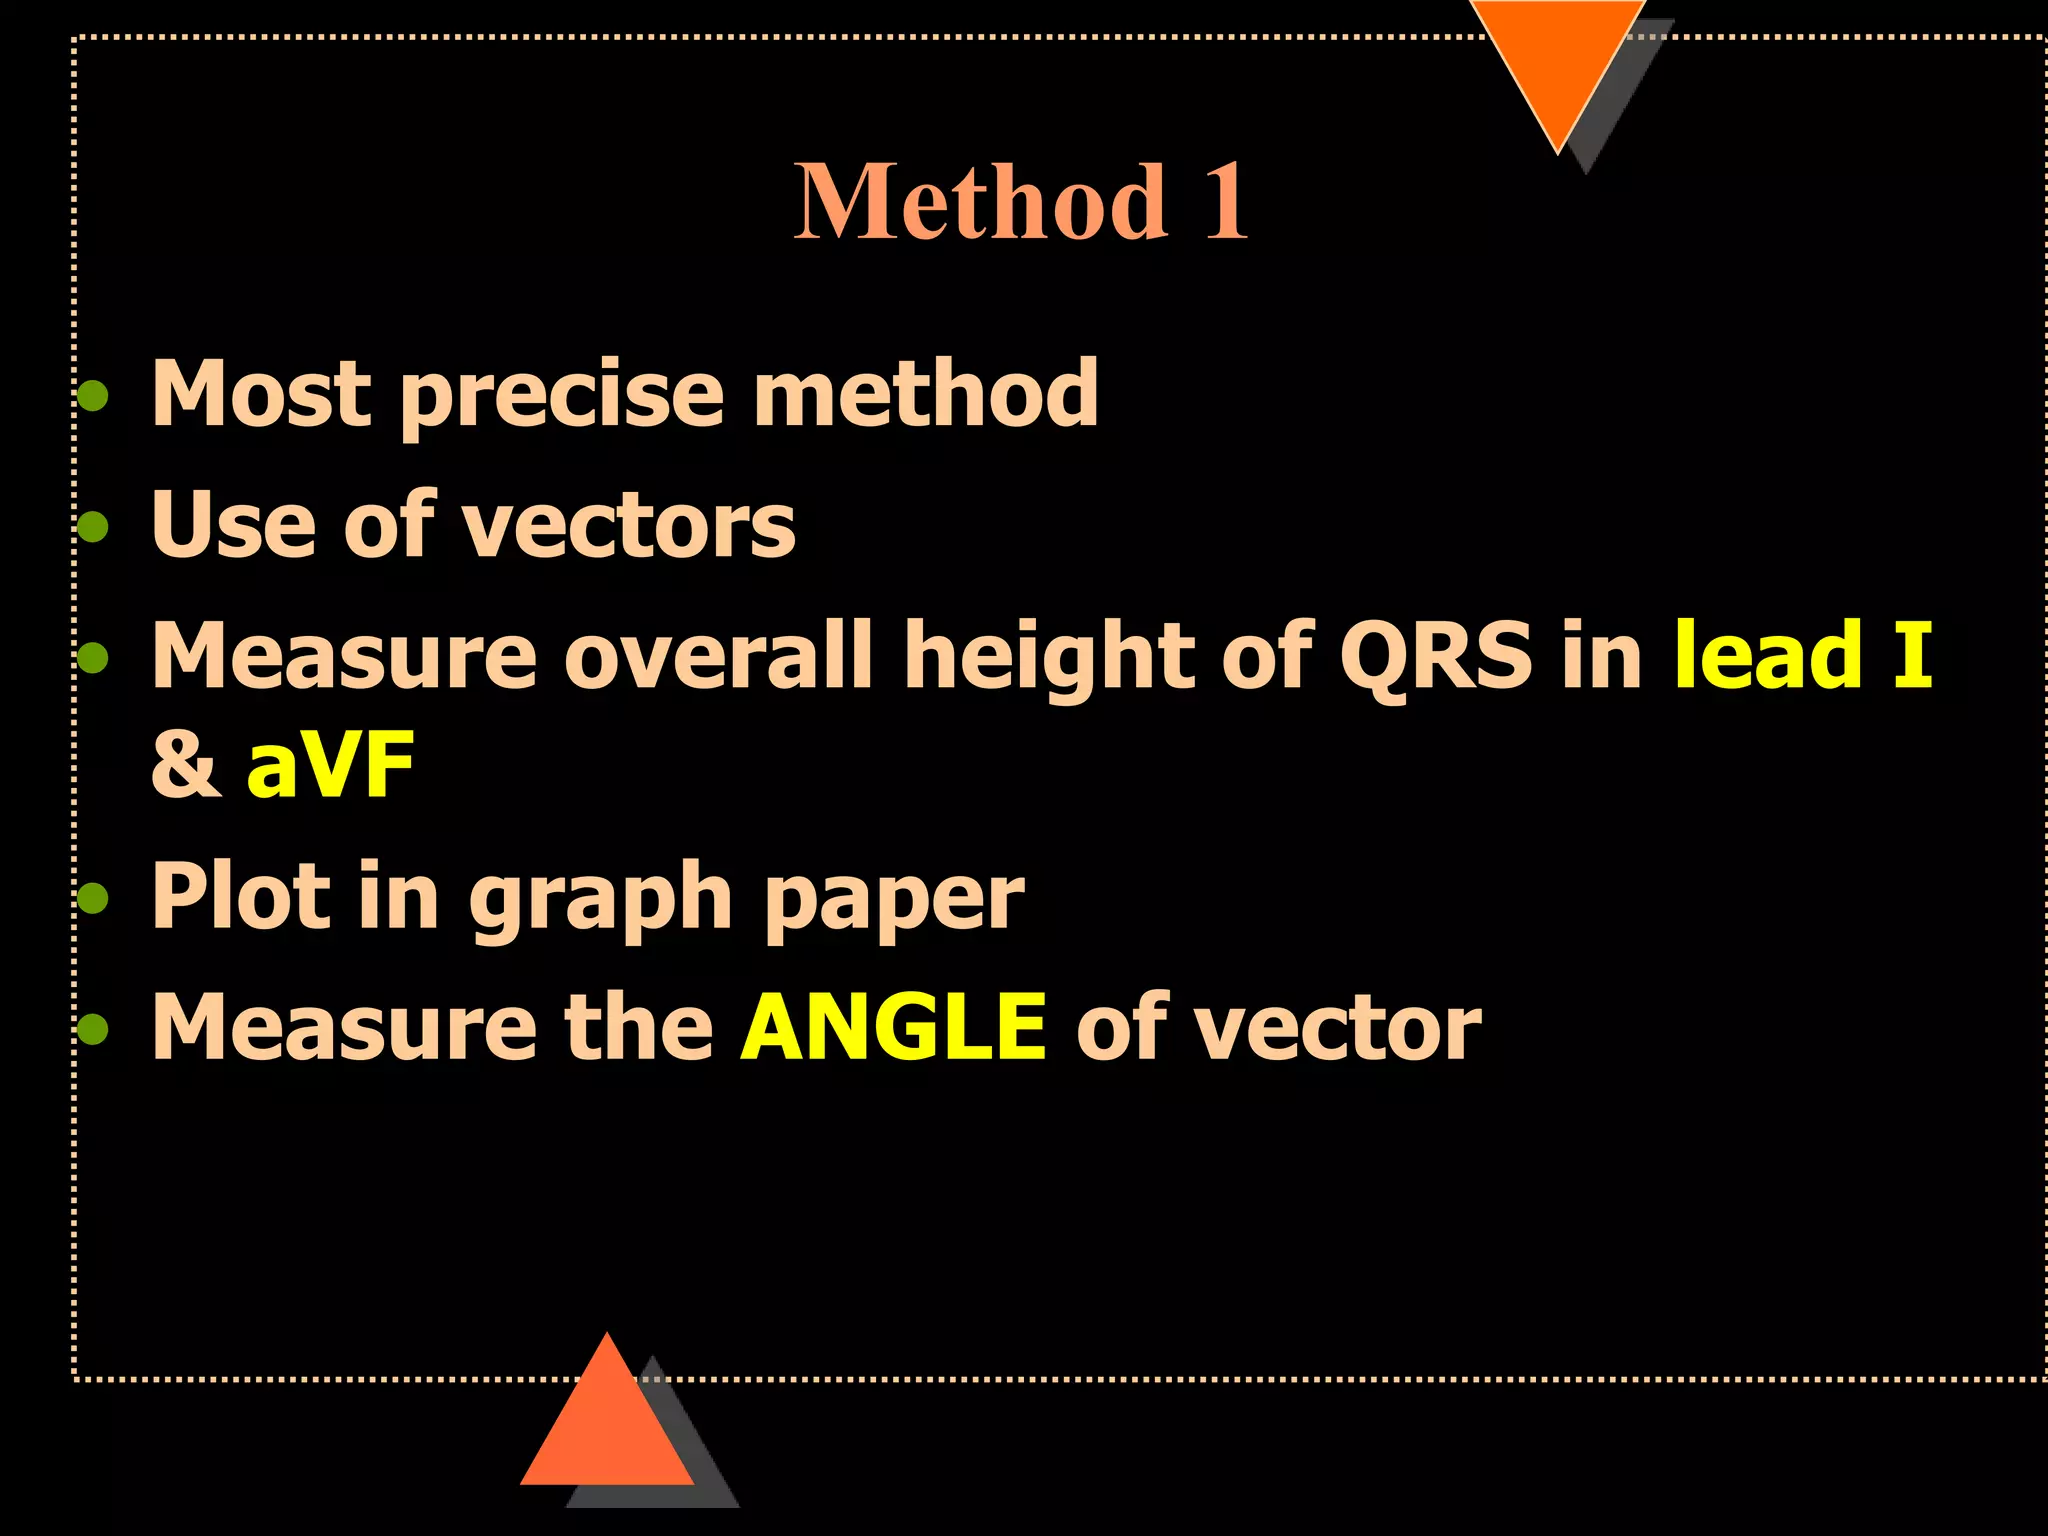
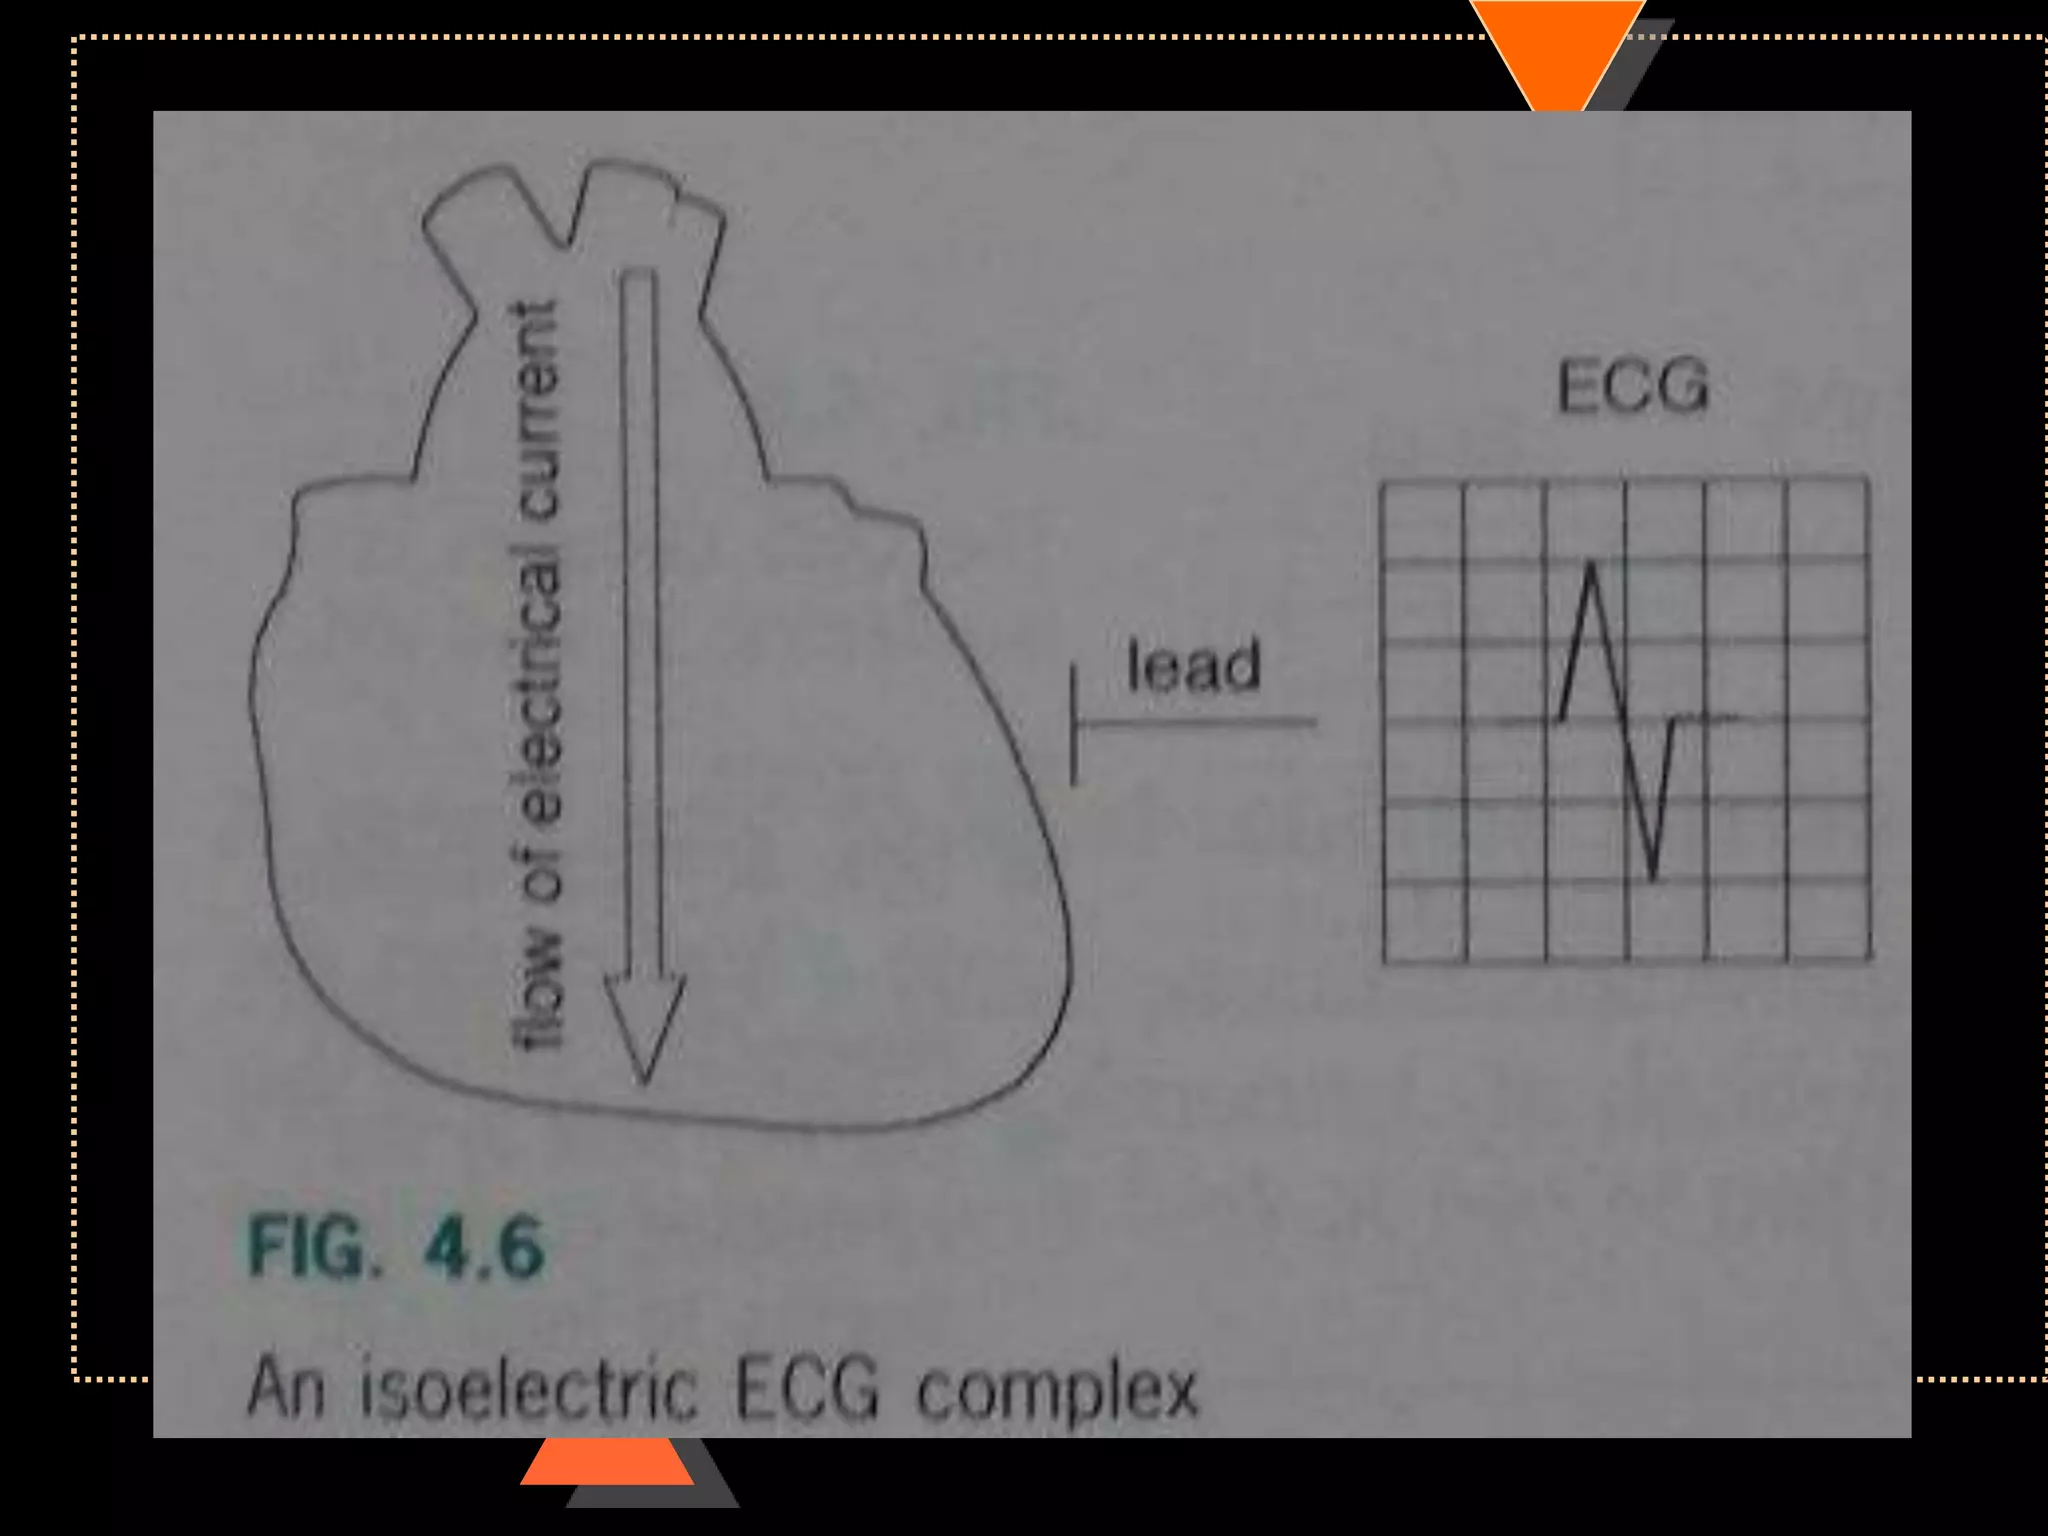
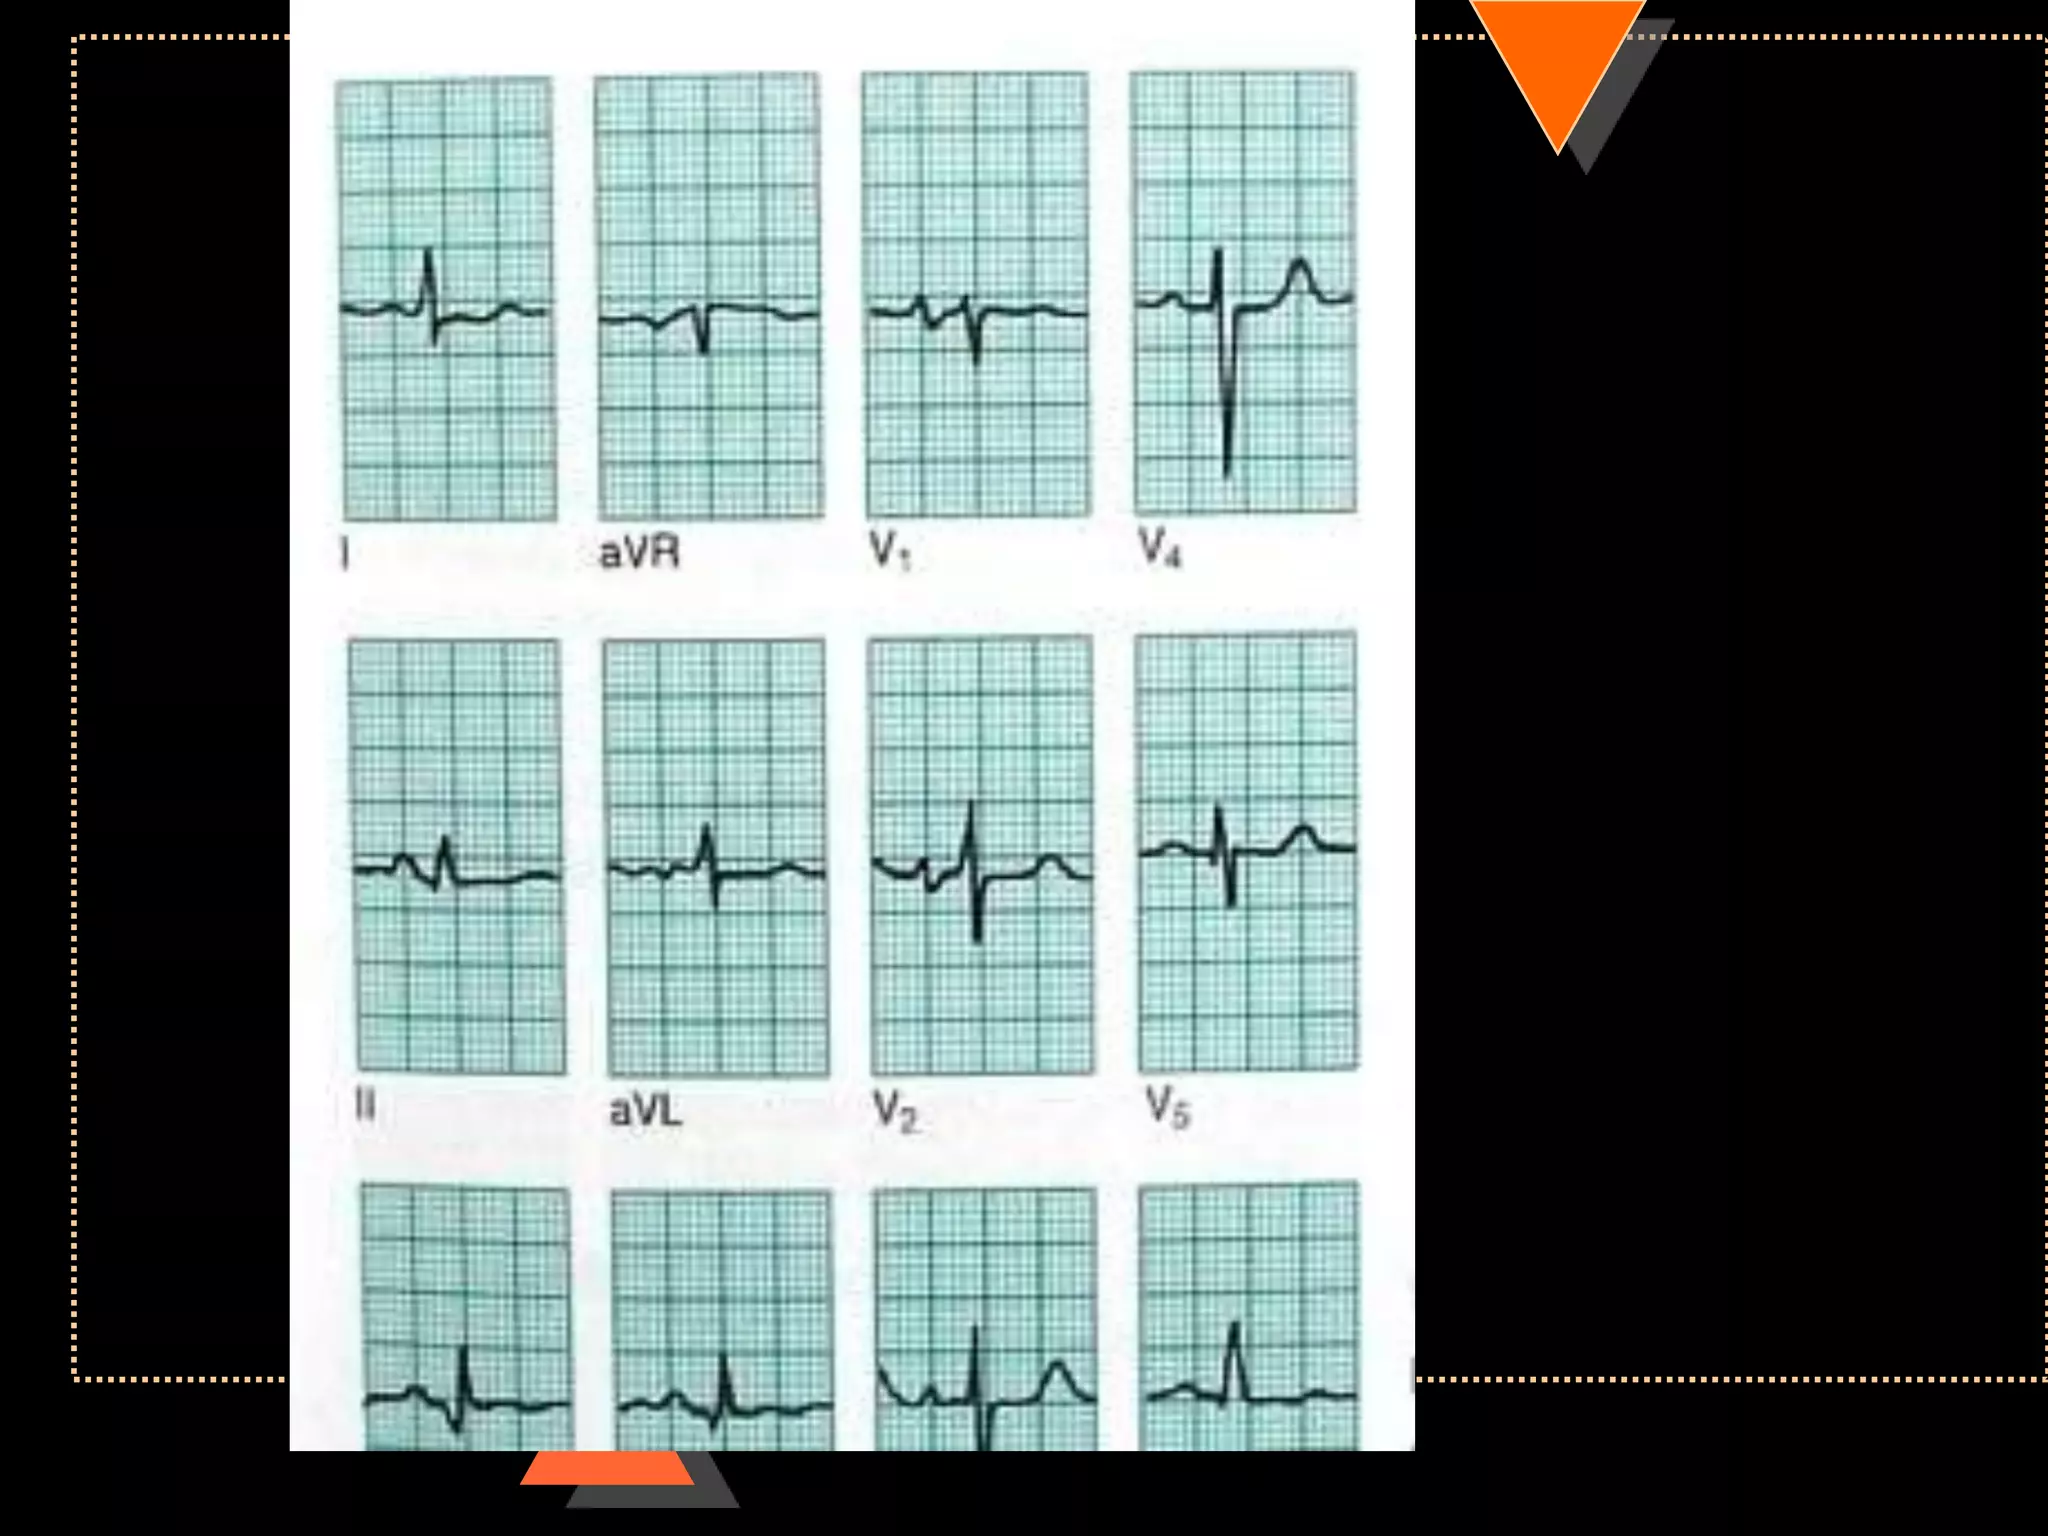
![Method 2
• Quick method
• Identify limb lead in which QRS complex
is isoelectric
• [with equal positive & negative
deflection]
• Implies: electric flow is at Right angle to
this lead](https://image.slidesharecdn.com/howtoreadecg-130901100253-phpapp02/75/How-to-read-ECG-38-2048.jpg)
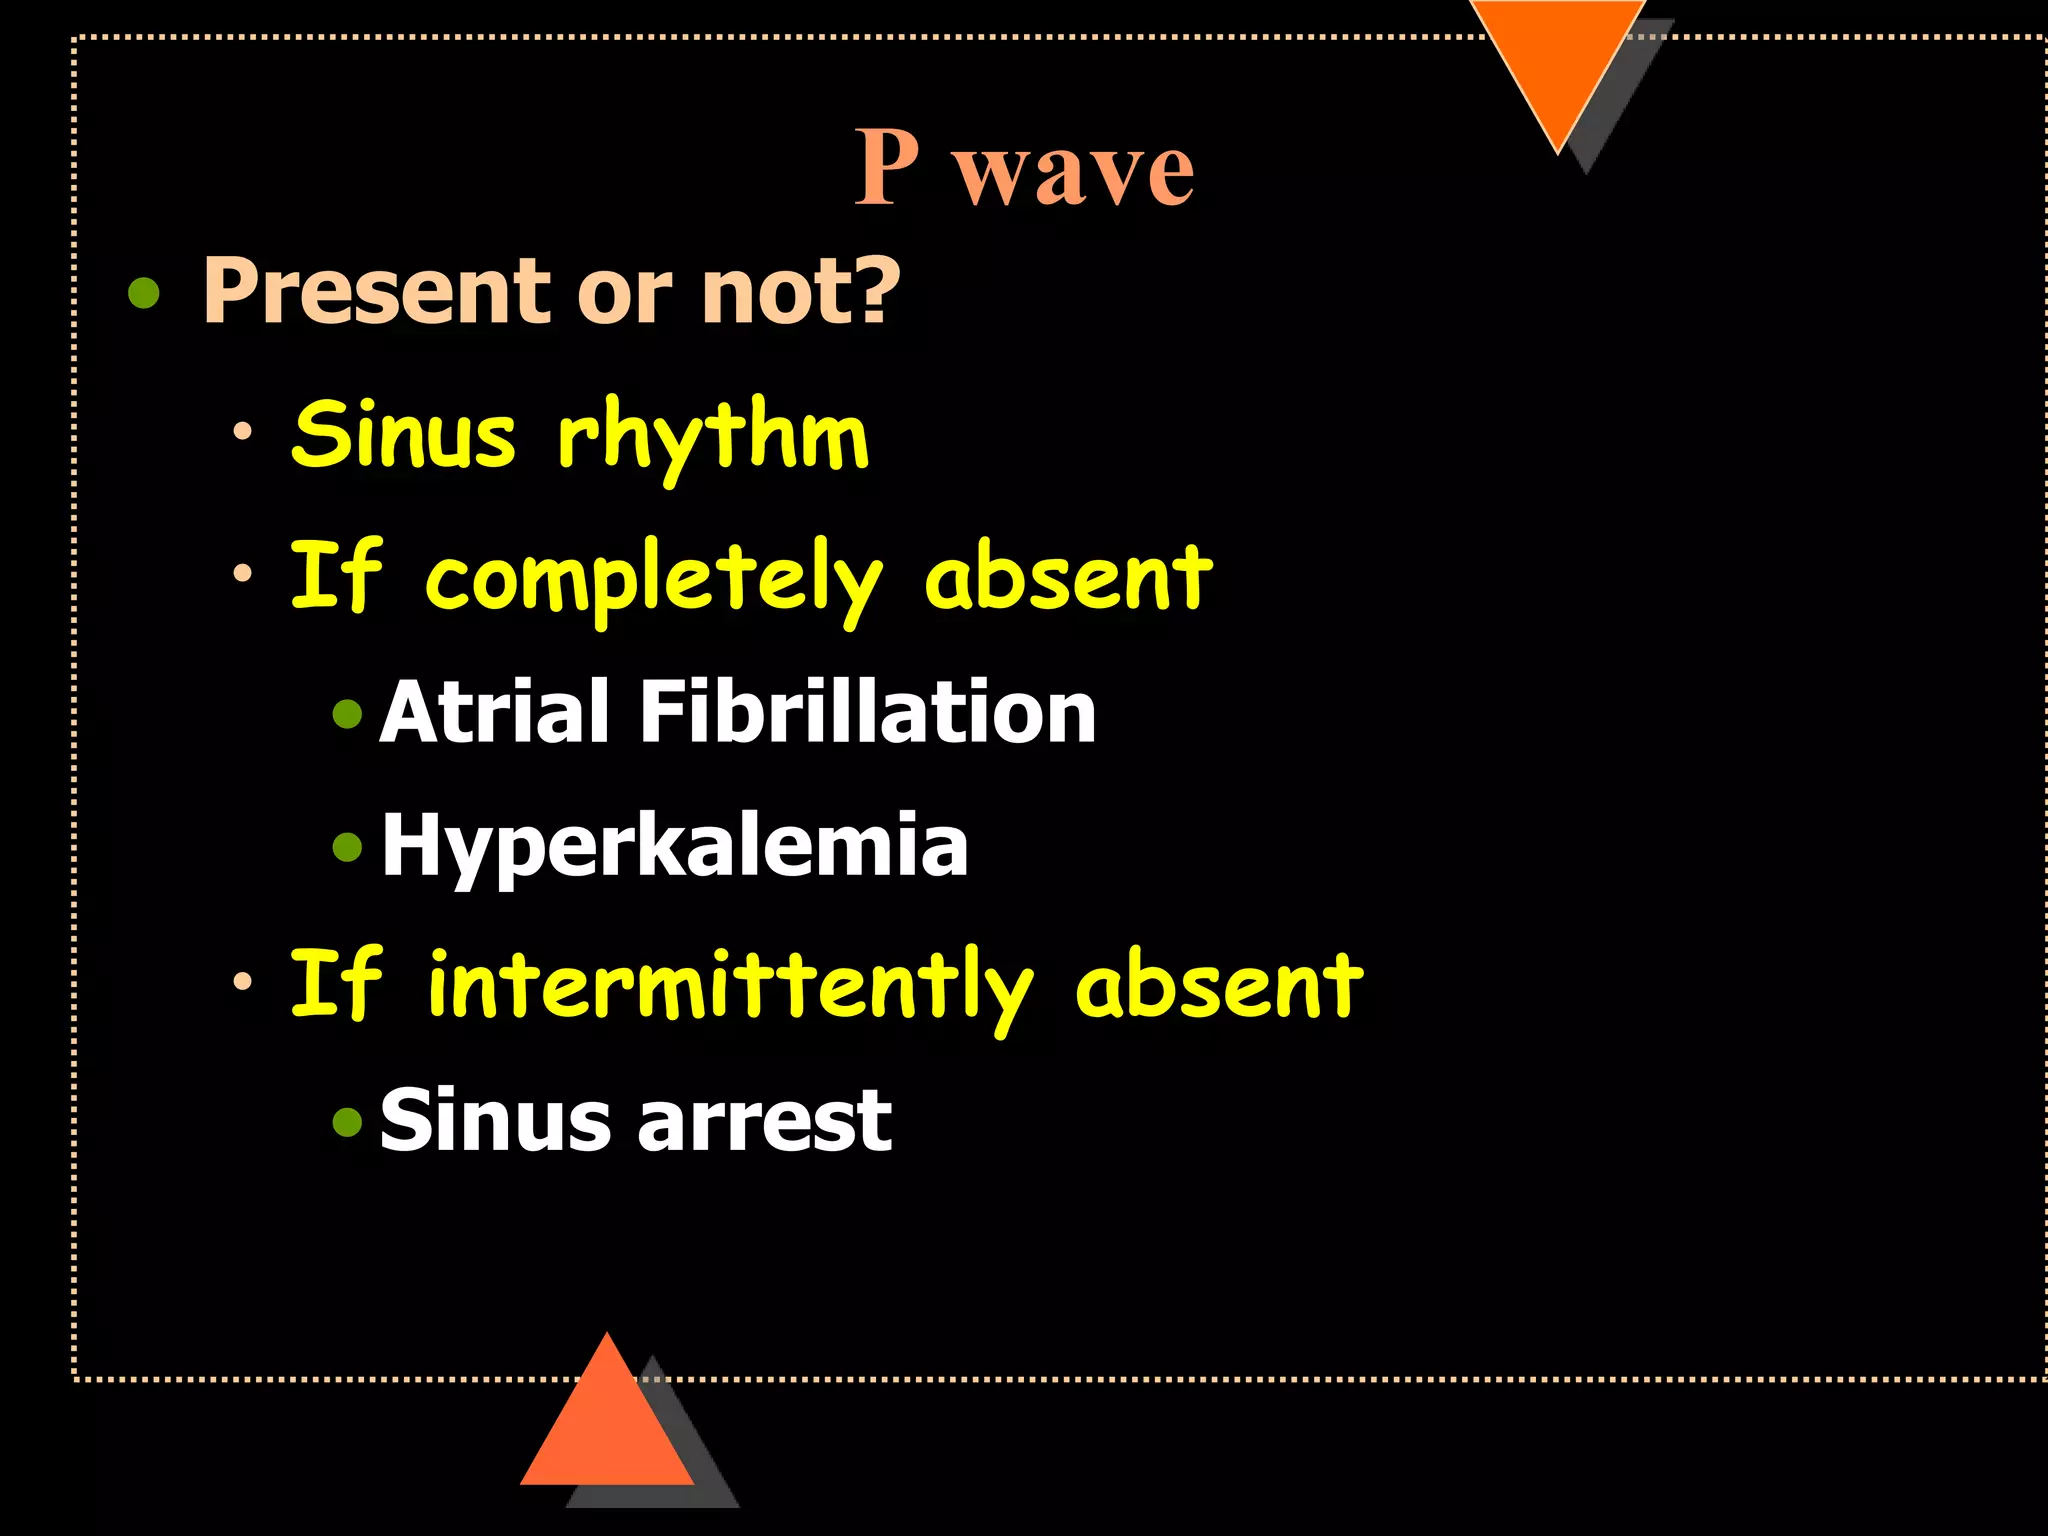
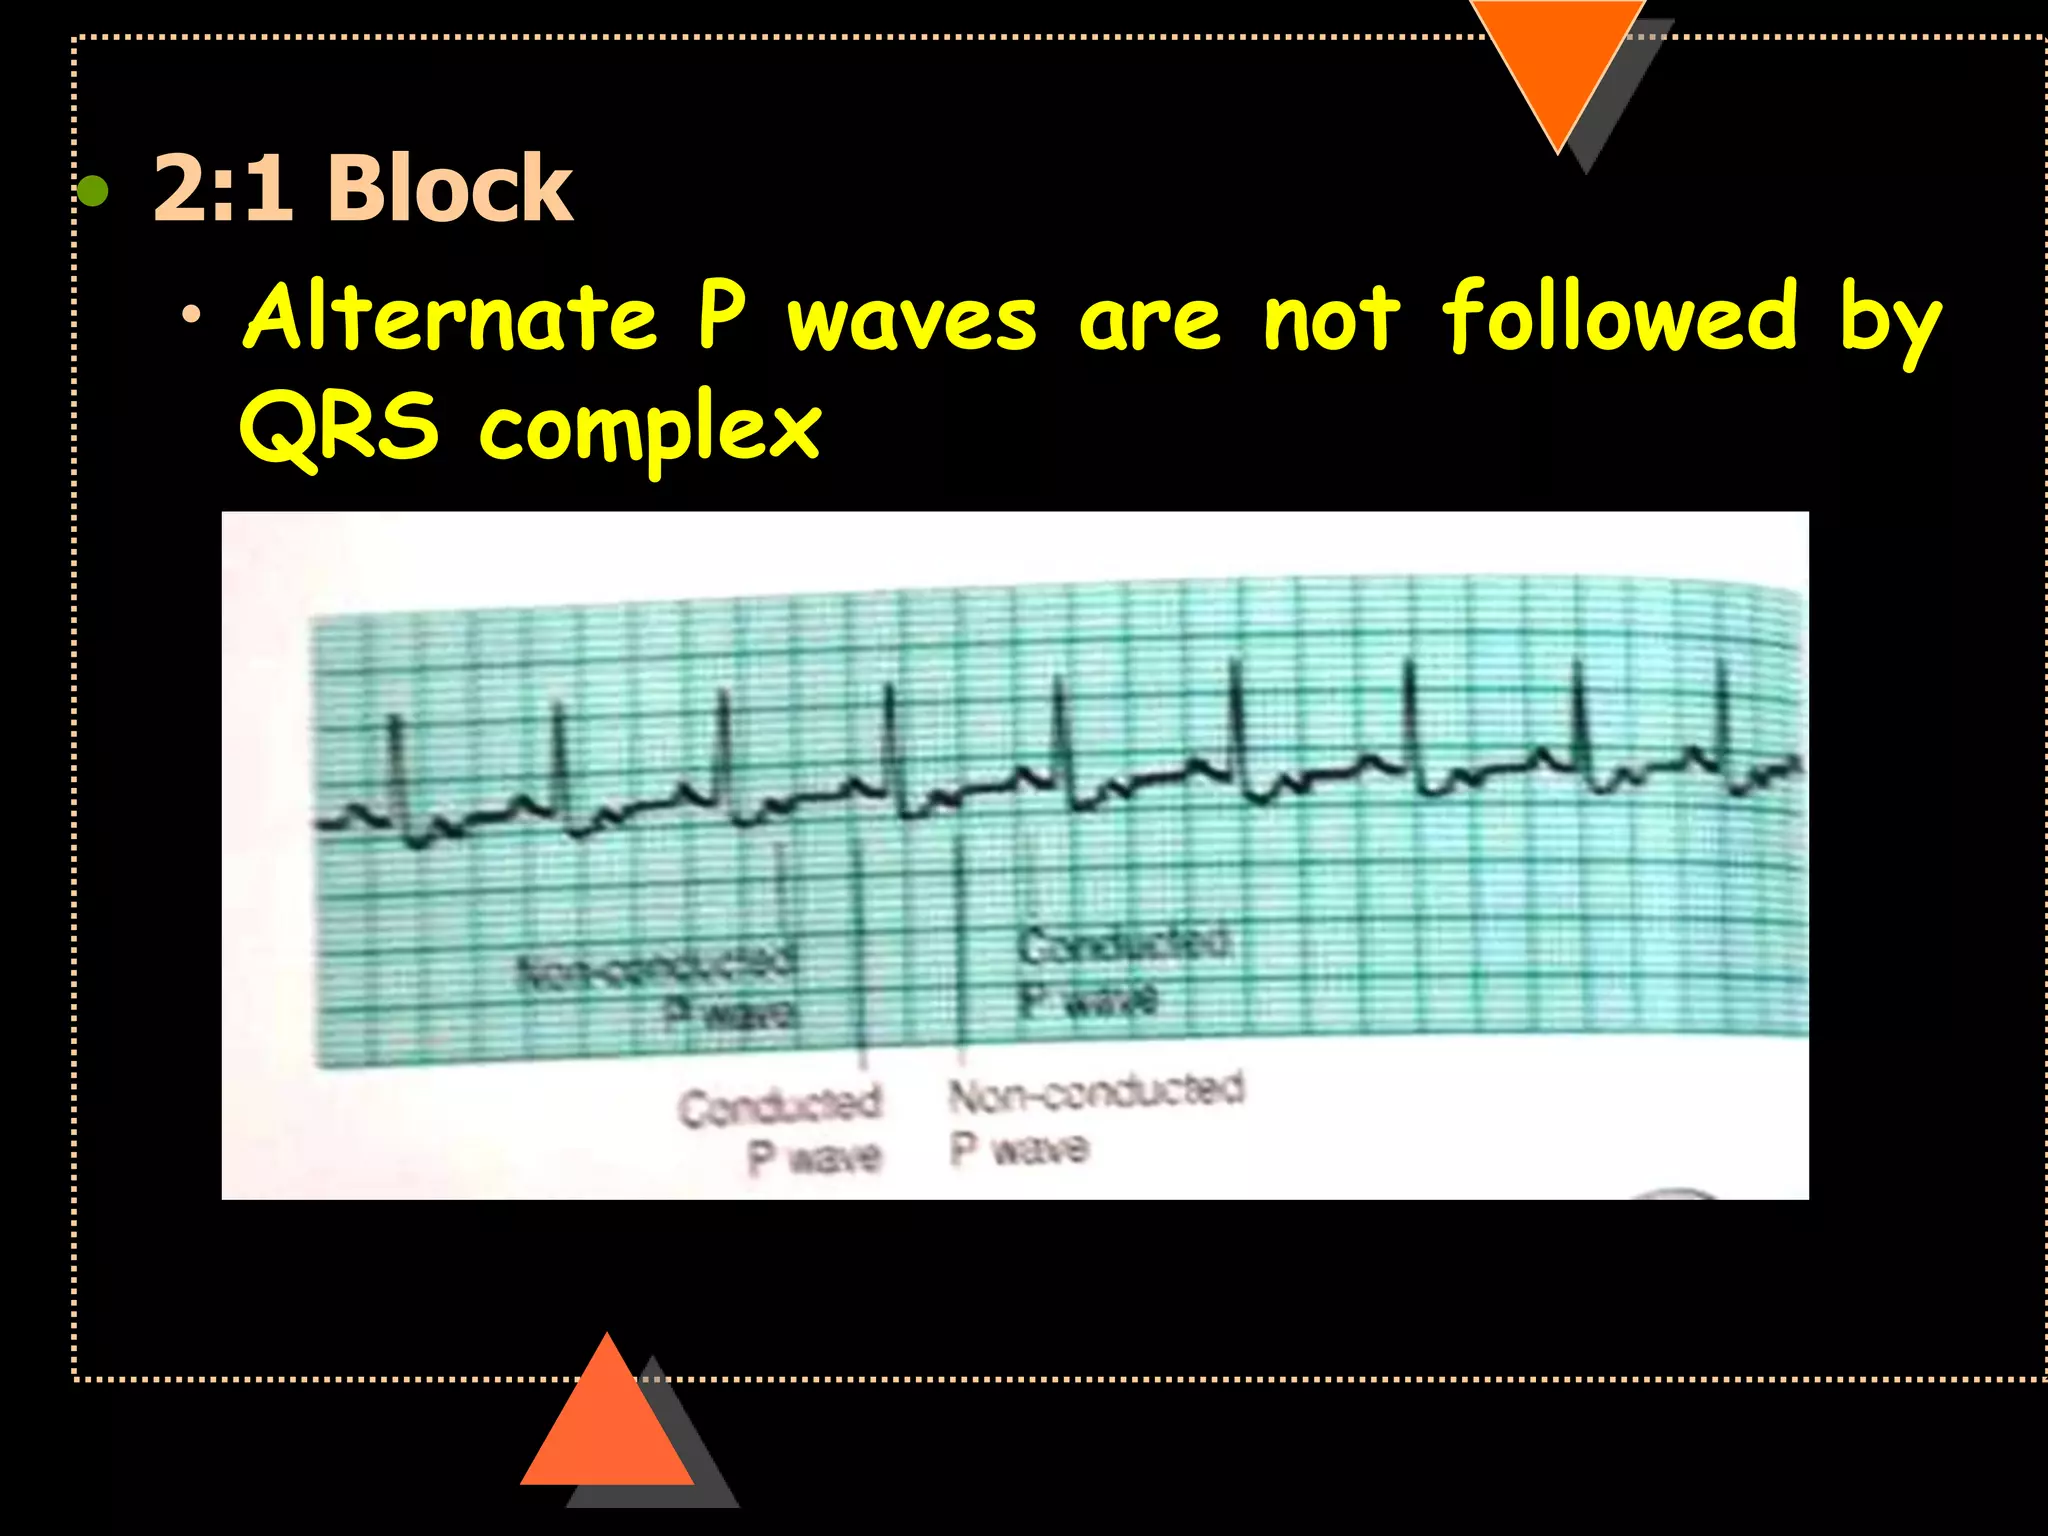
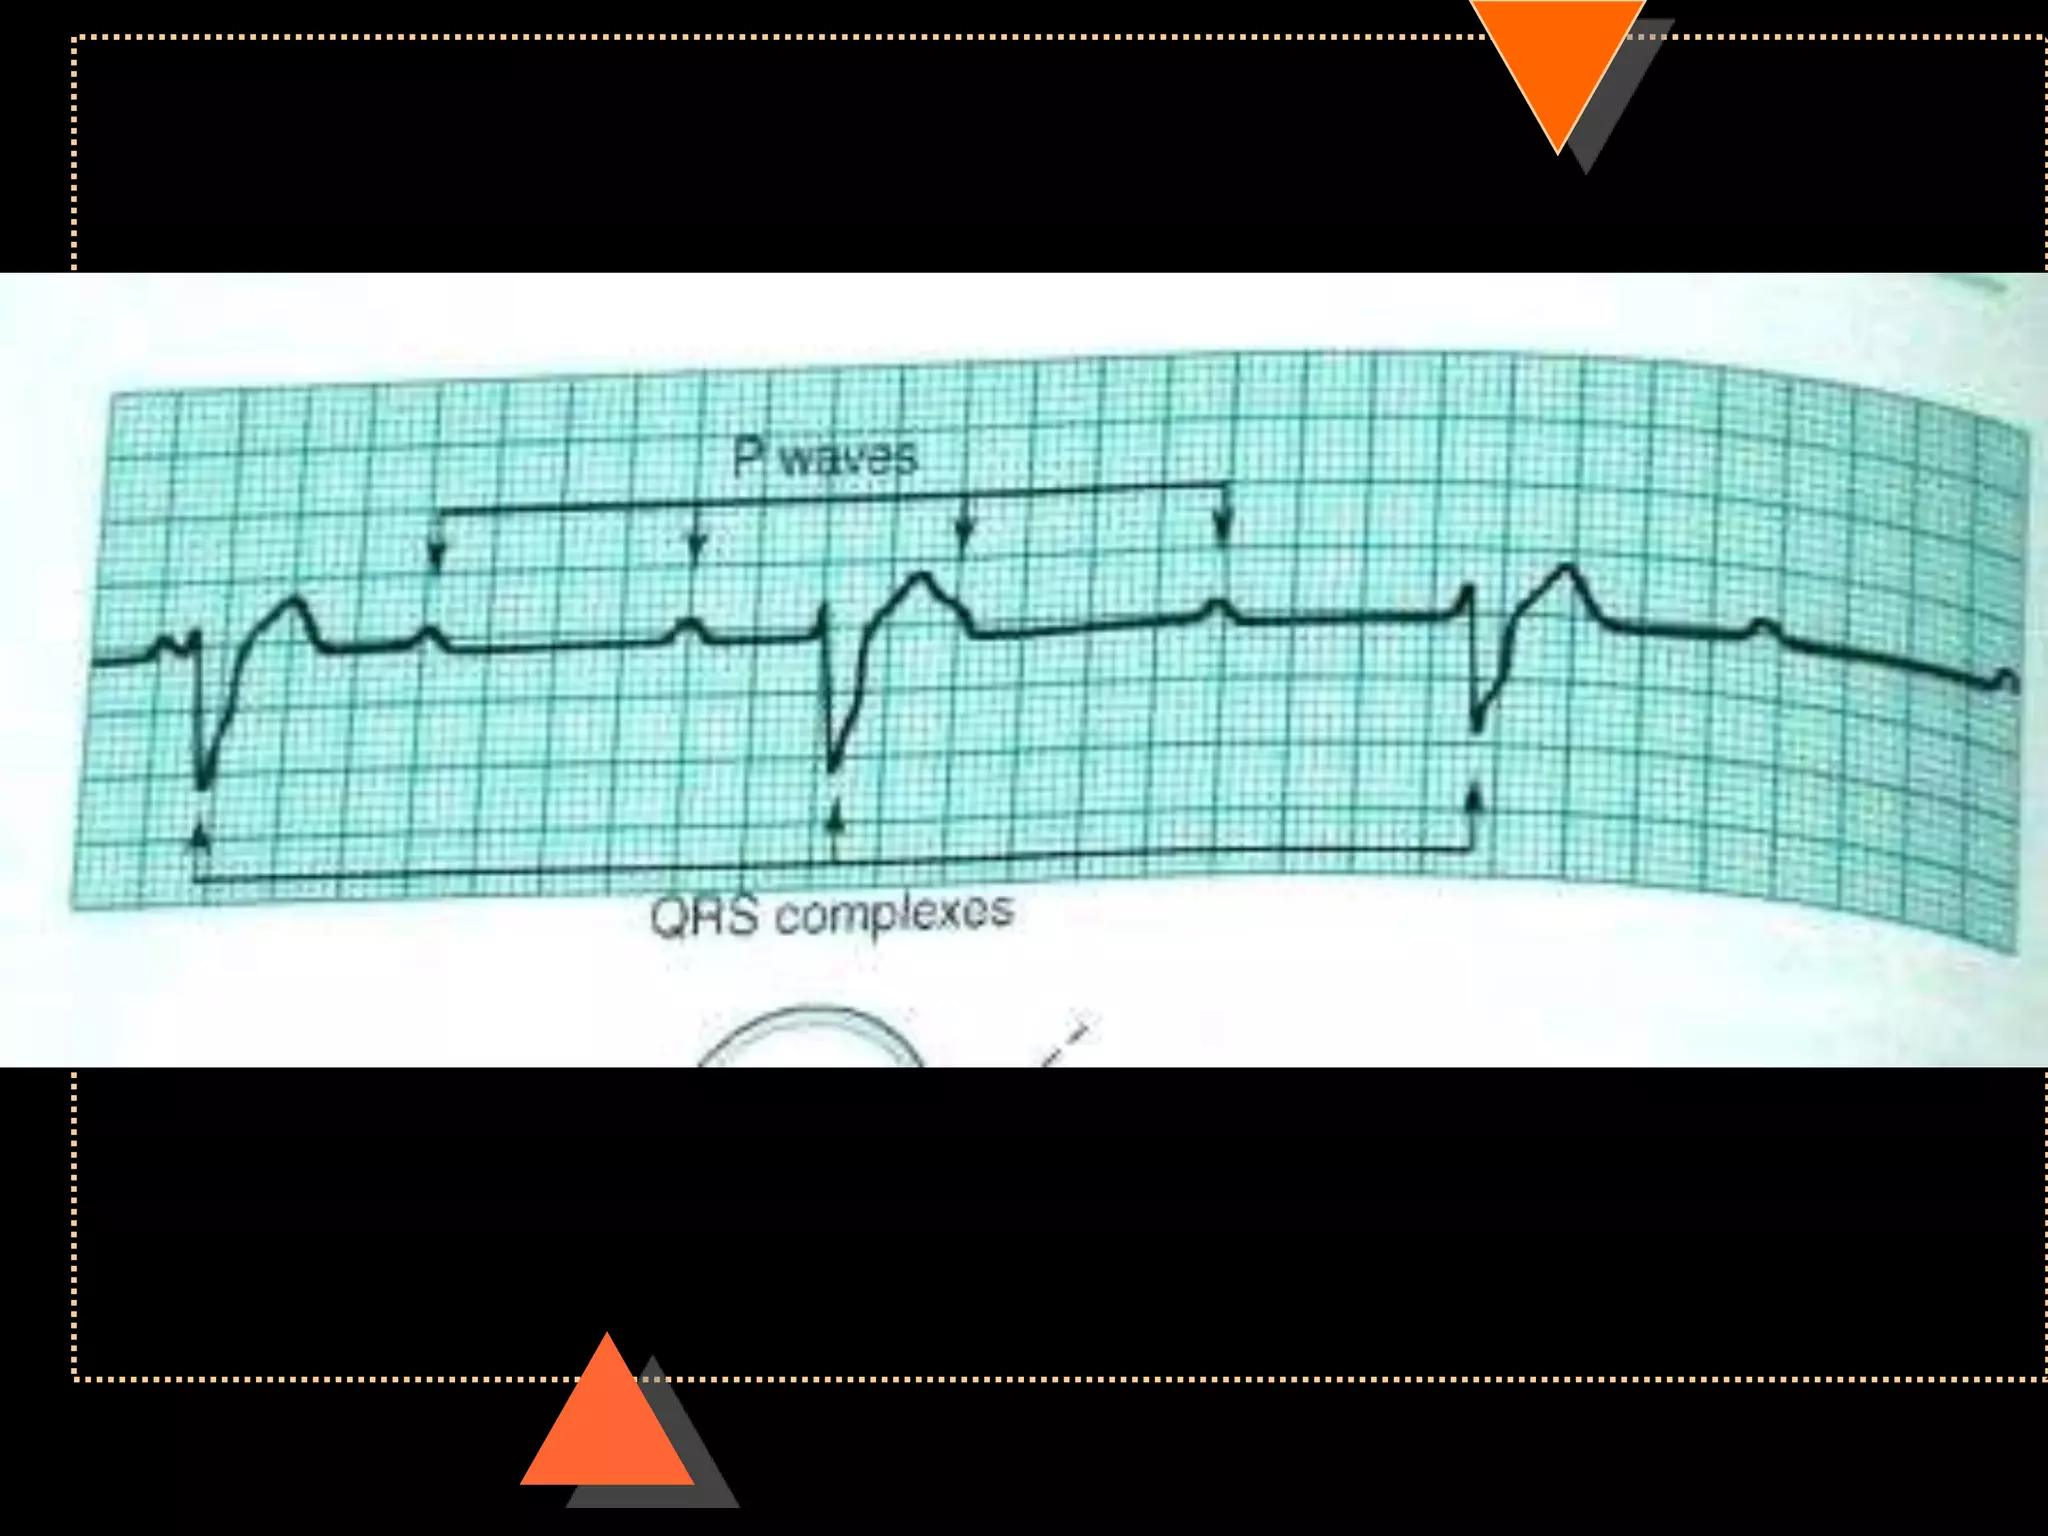
![• Third Degree Block [Complete AV Block]
• No relationship between P waves & QRS
complex](https://image.slidesharecdn.com/howtoreadecg-130901100253-phpapp02/75/How-to-read-ECG-63-2048.jpg)

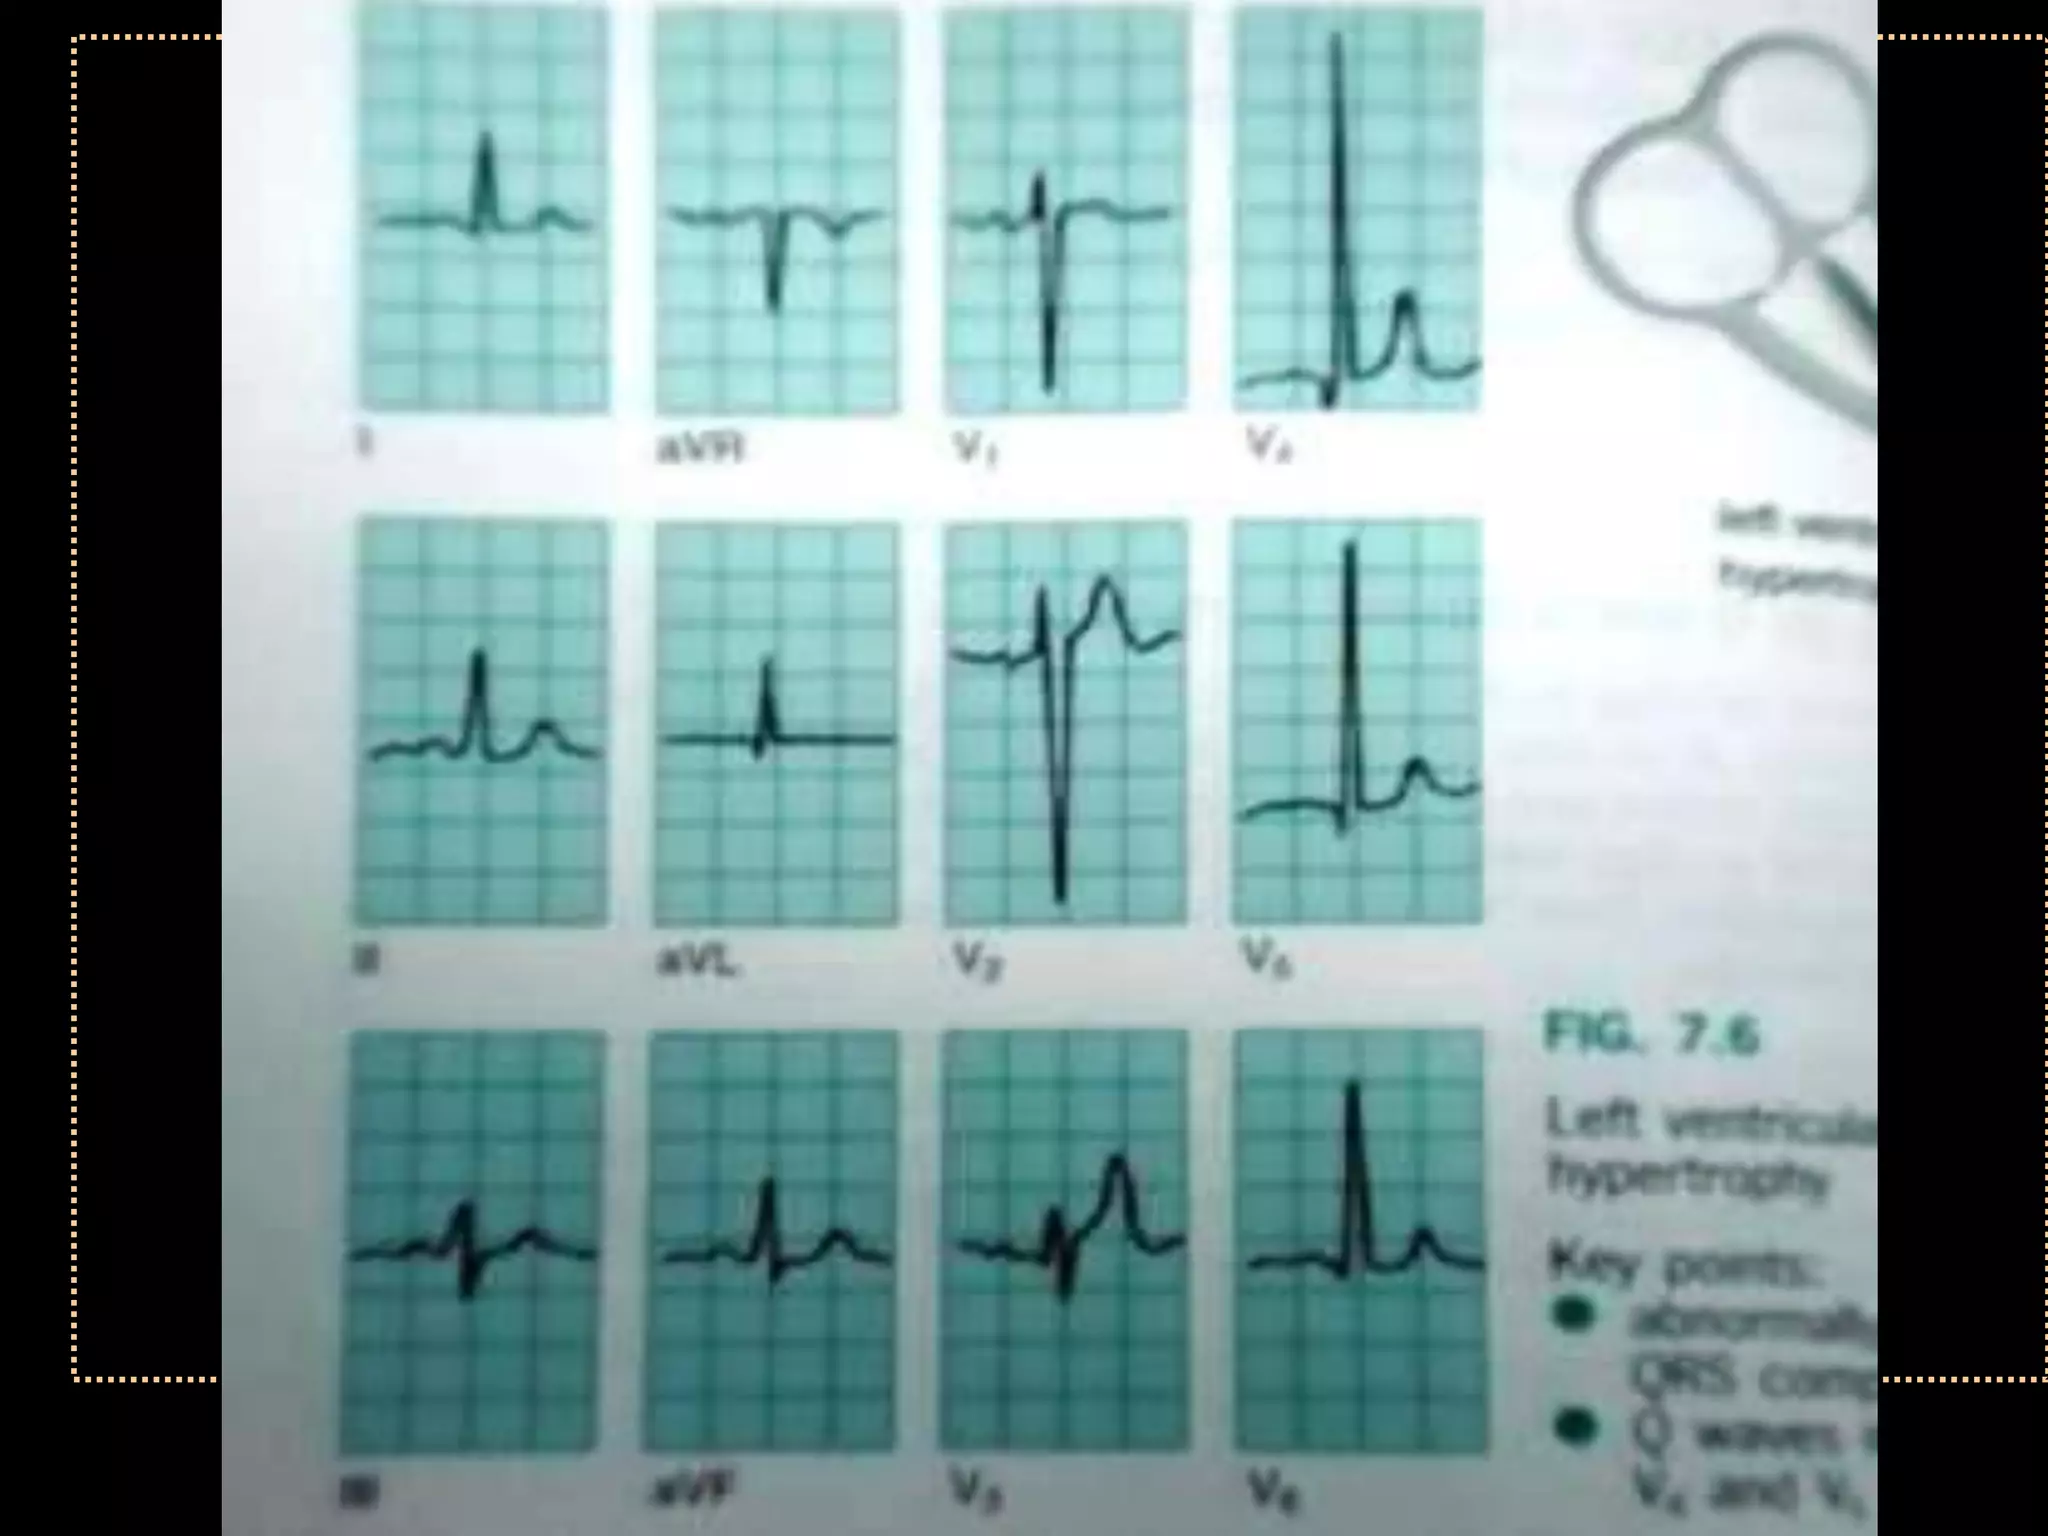
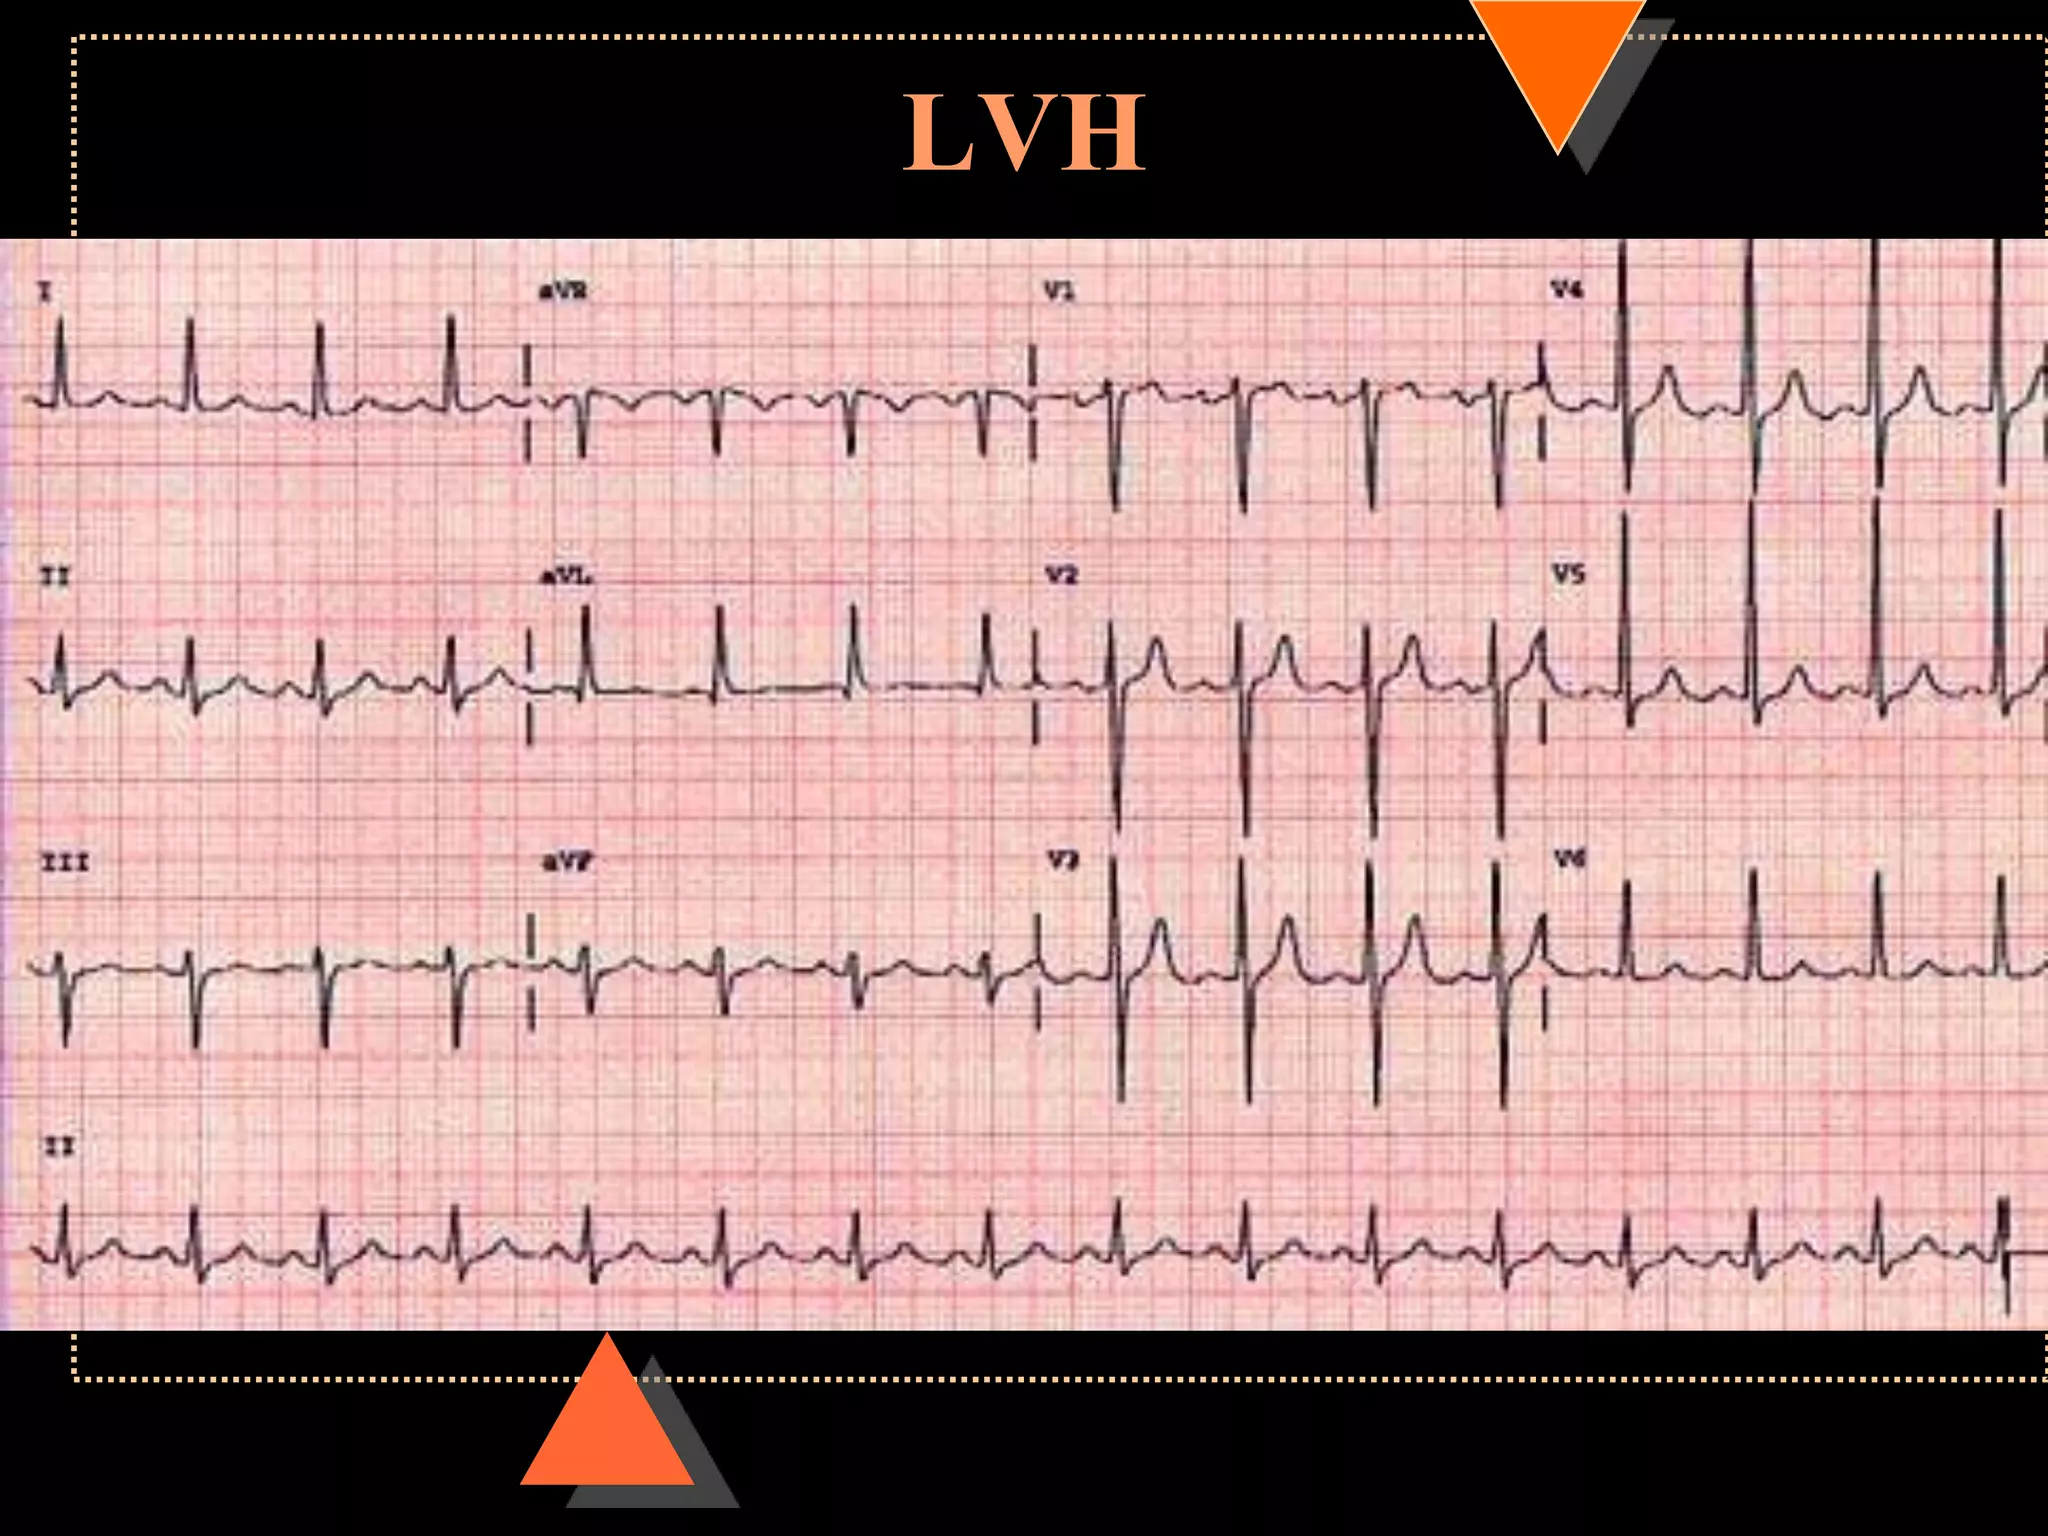
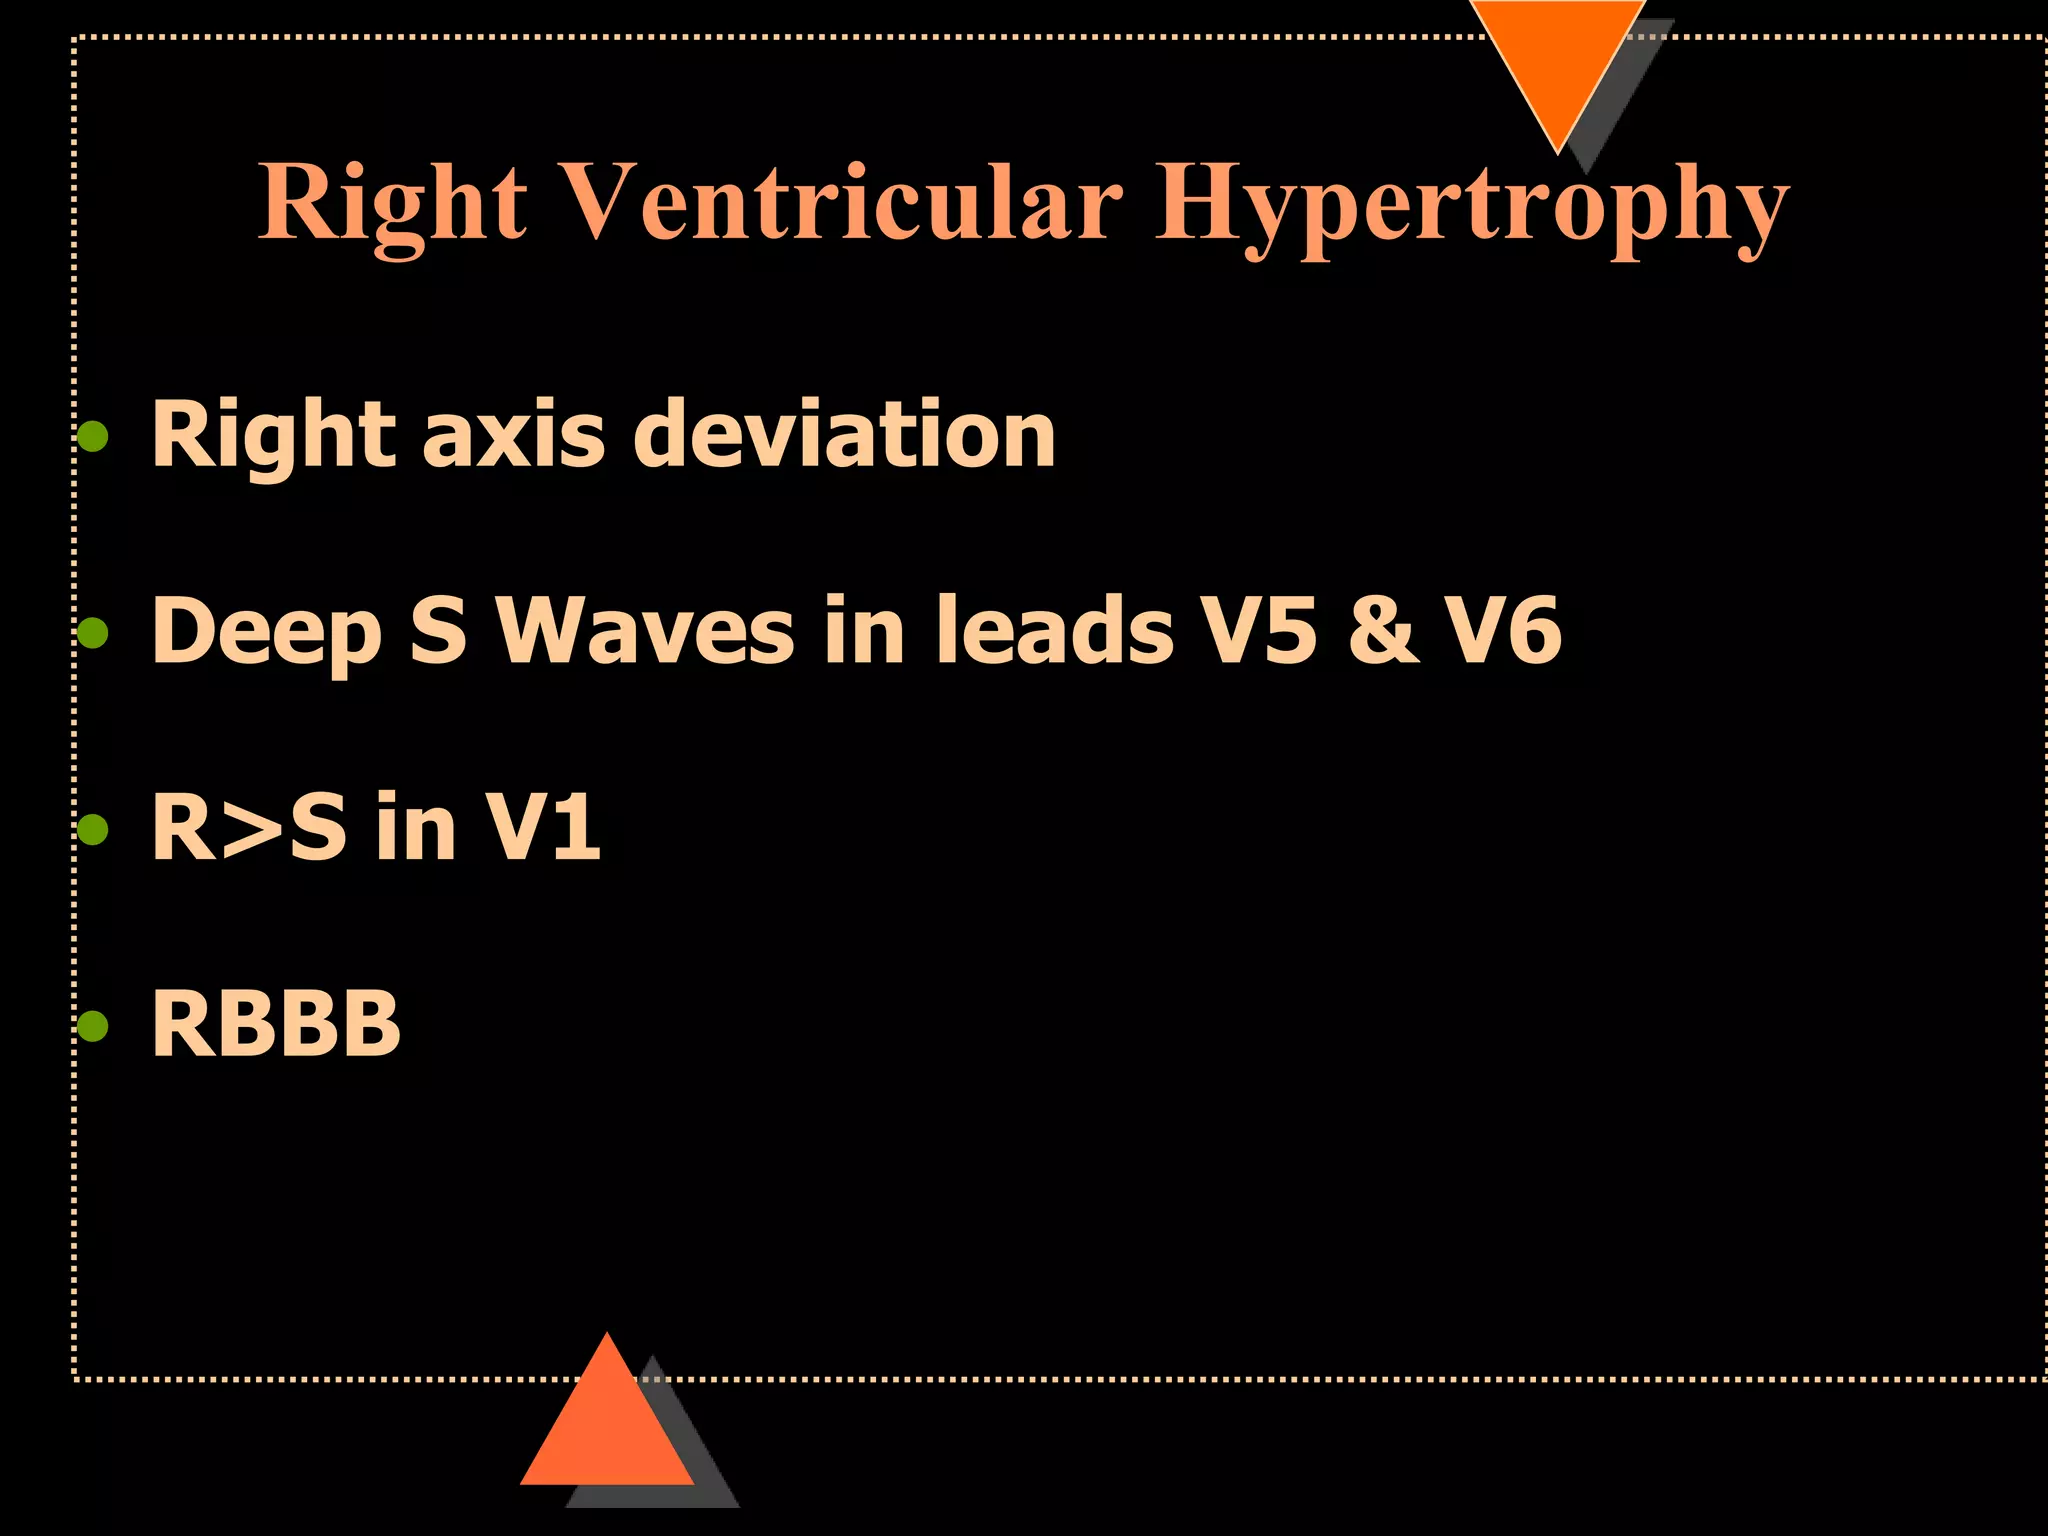
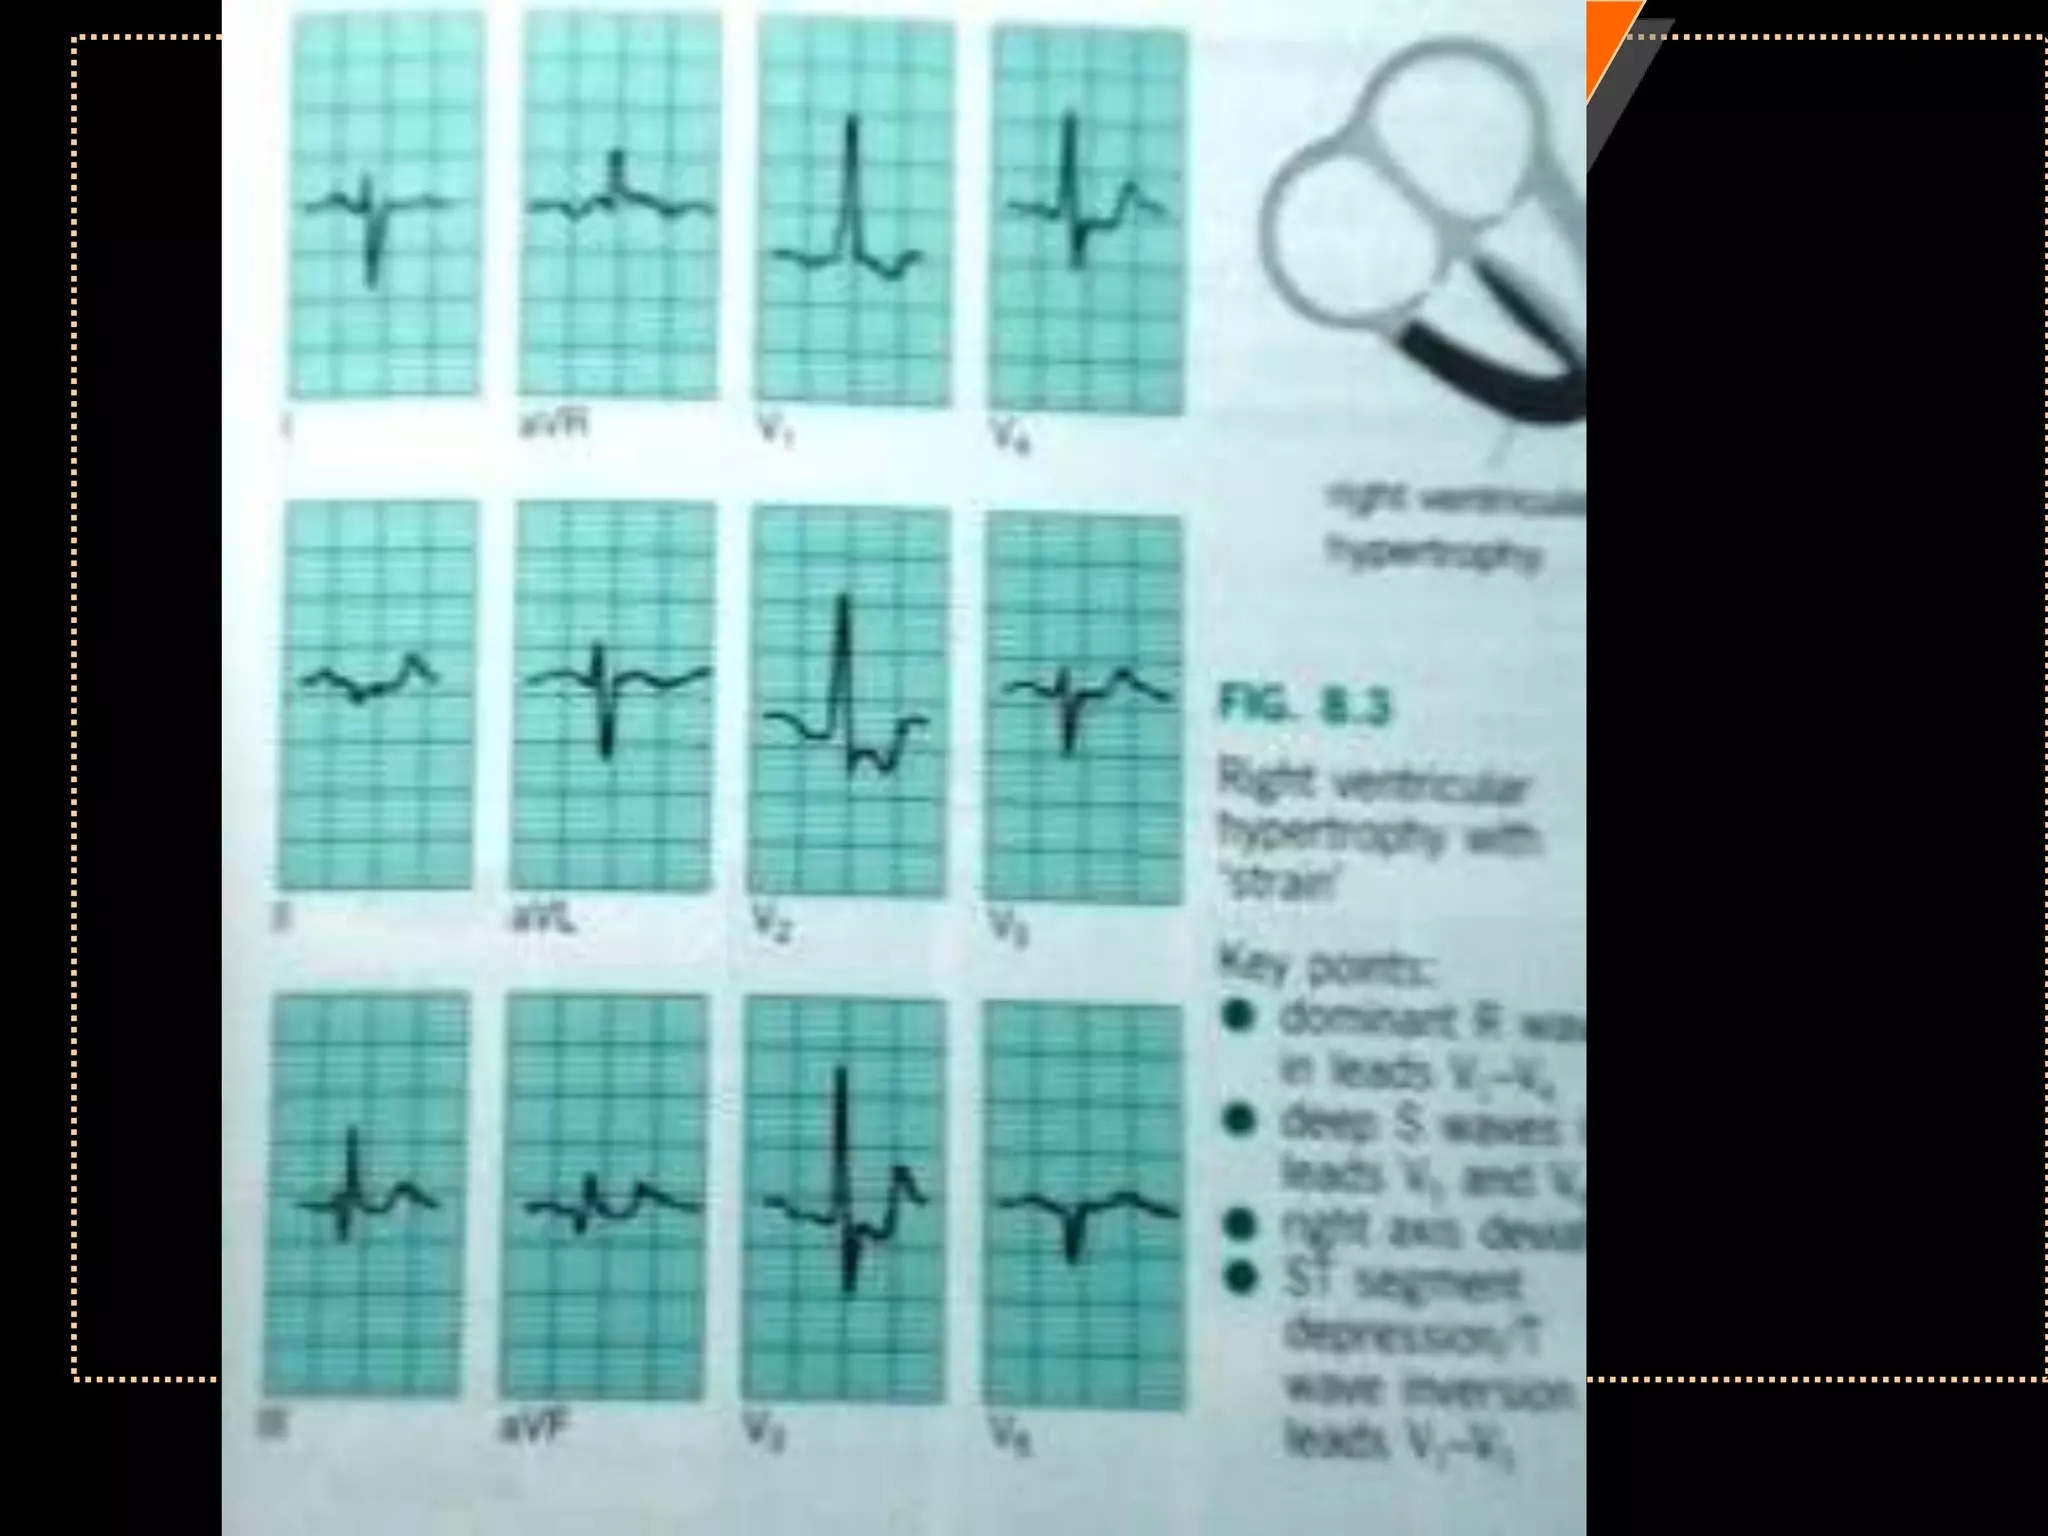
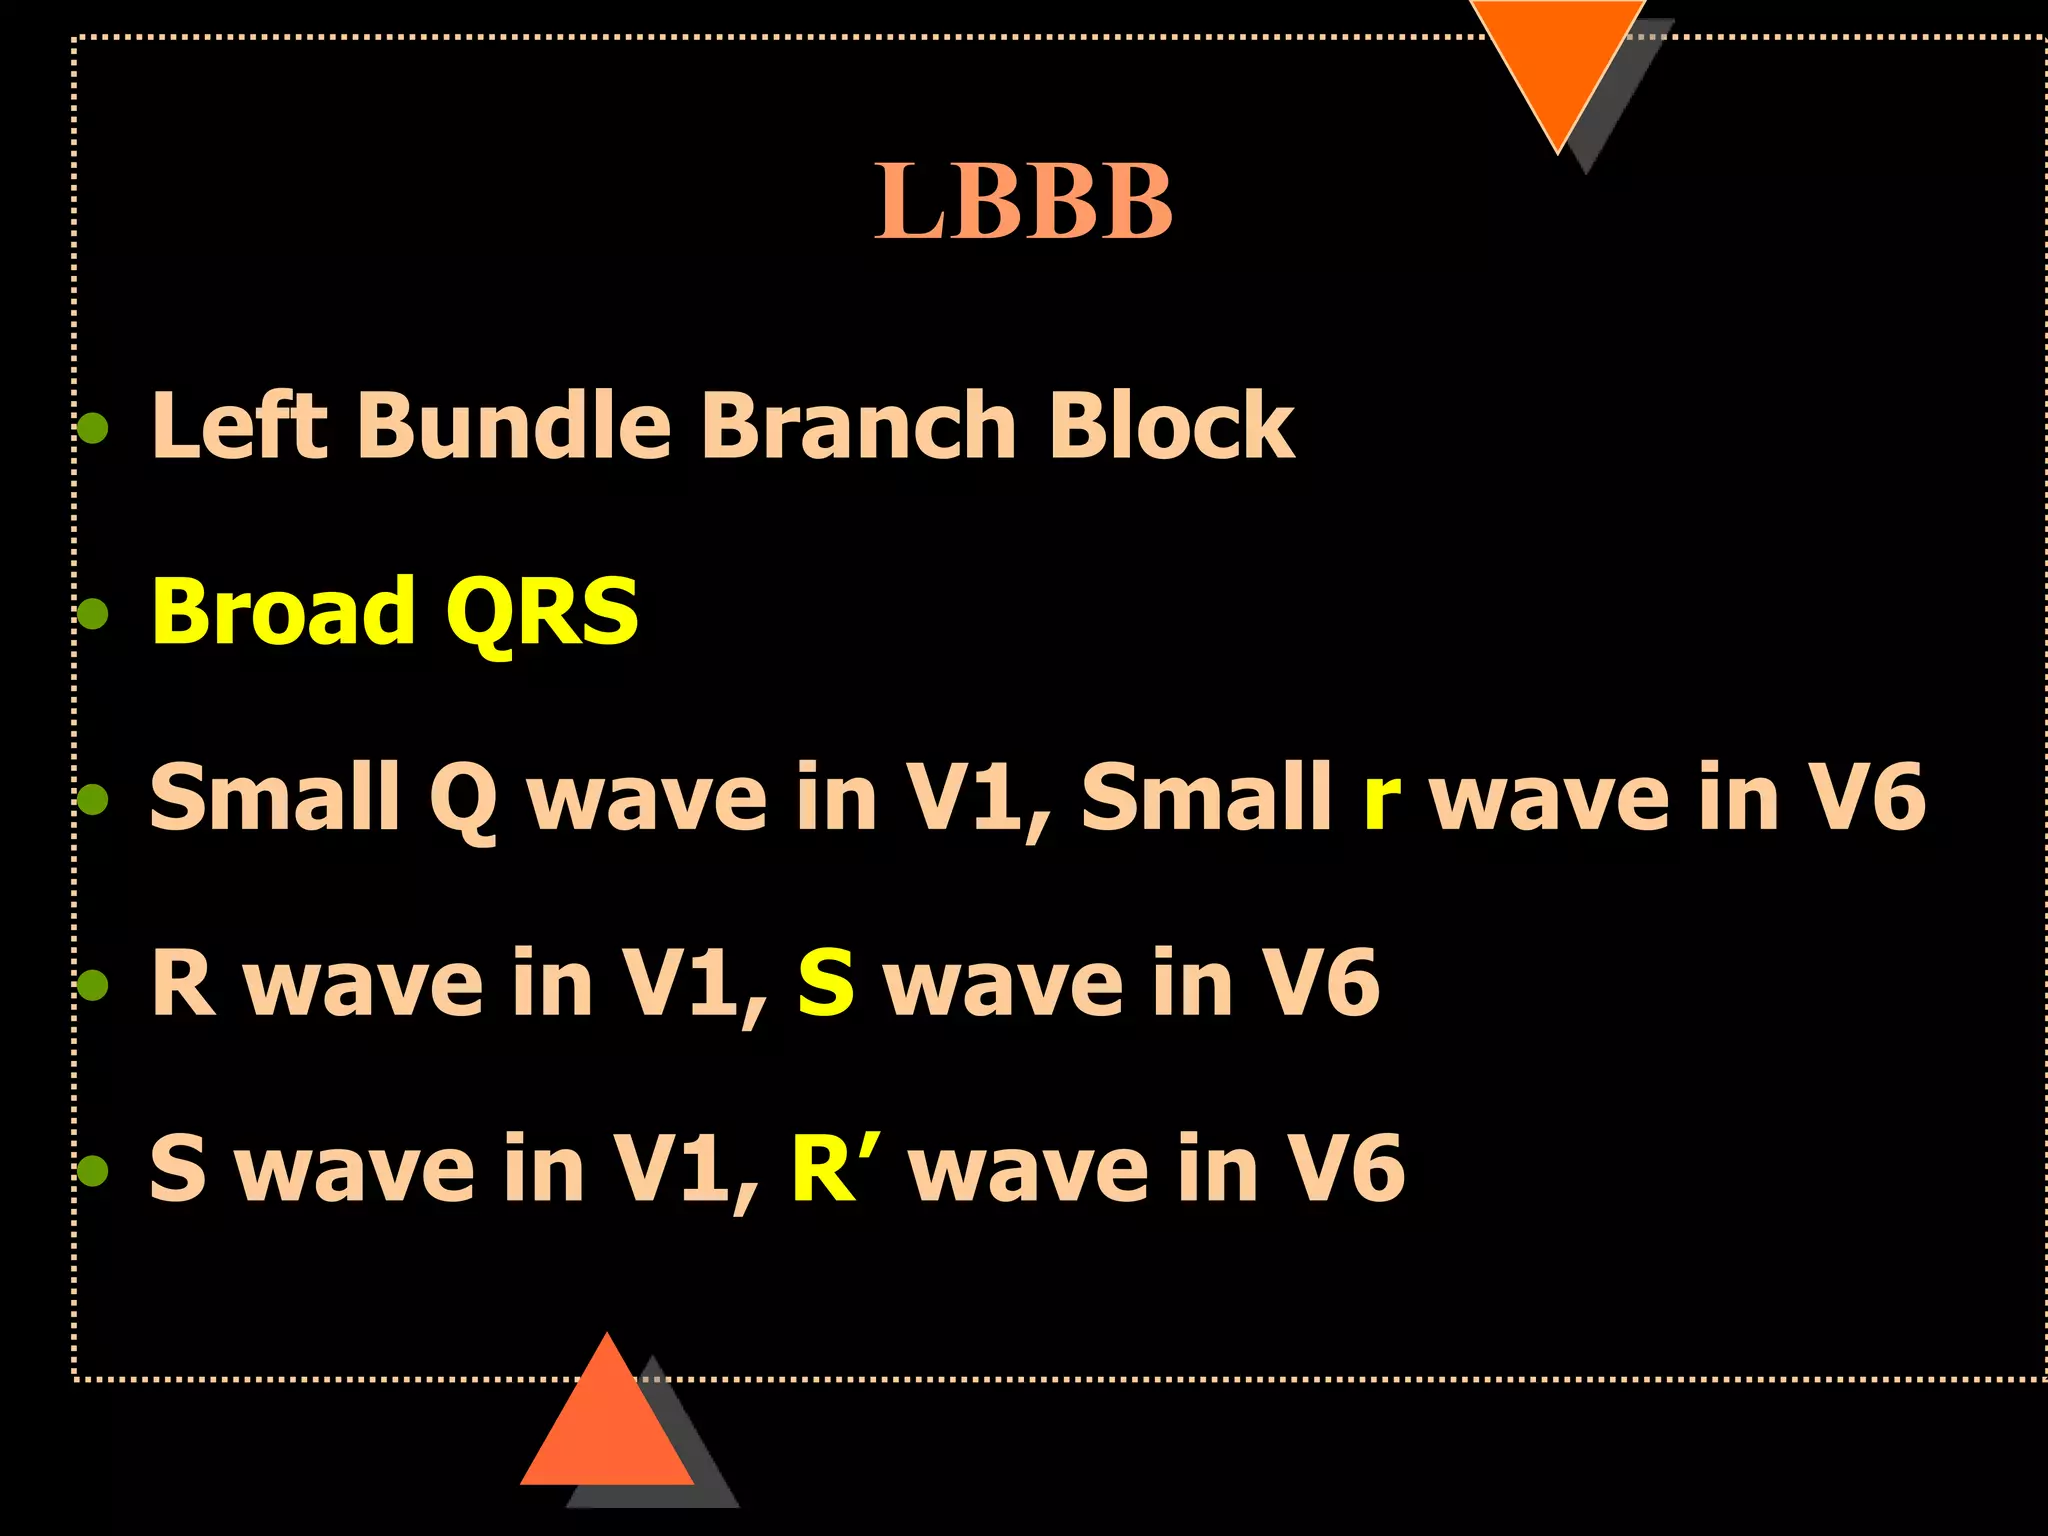
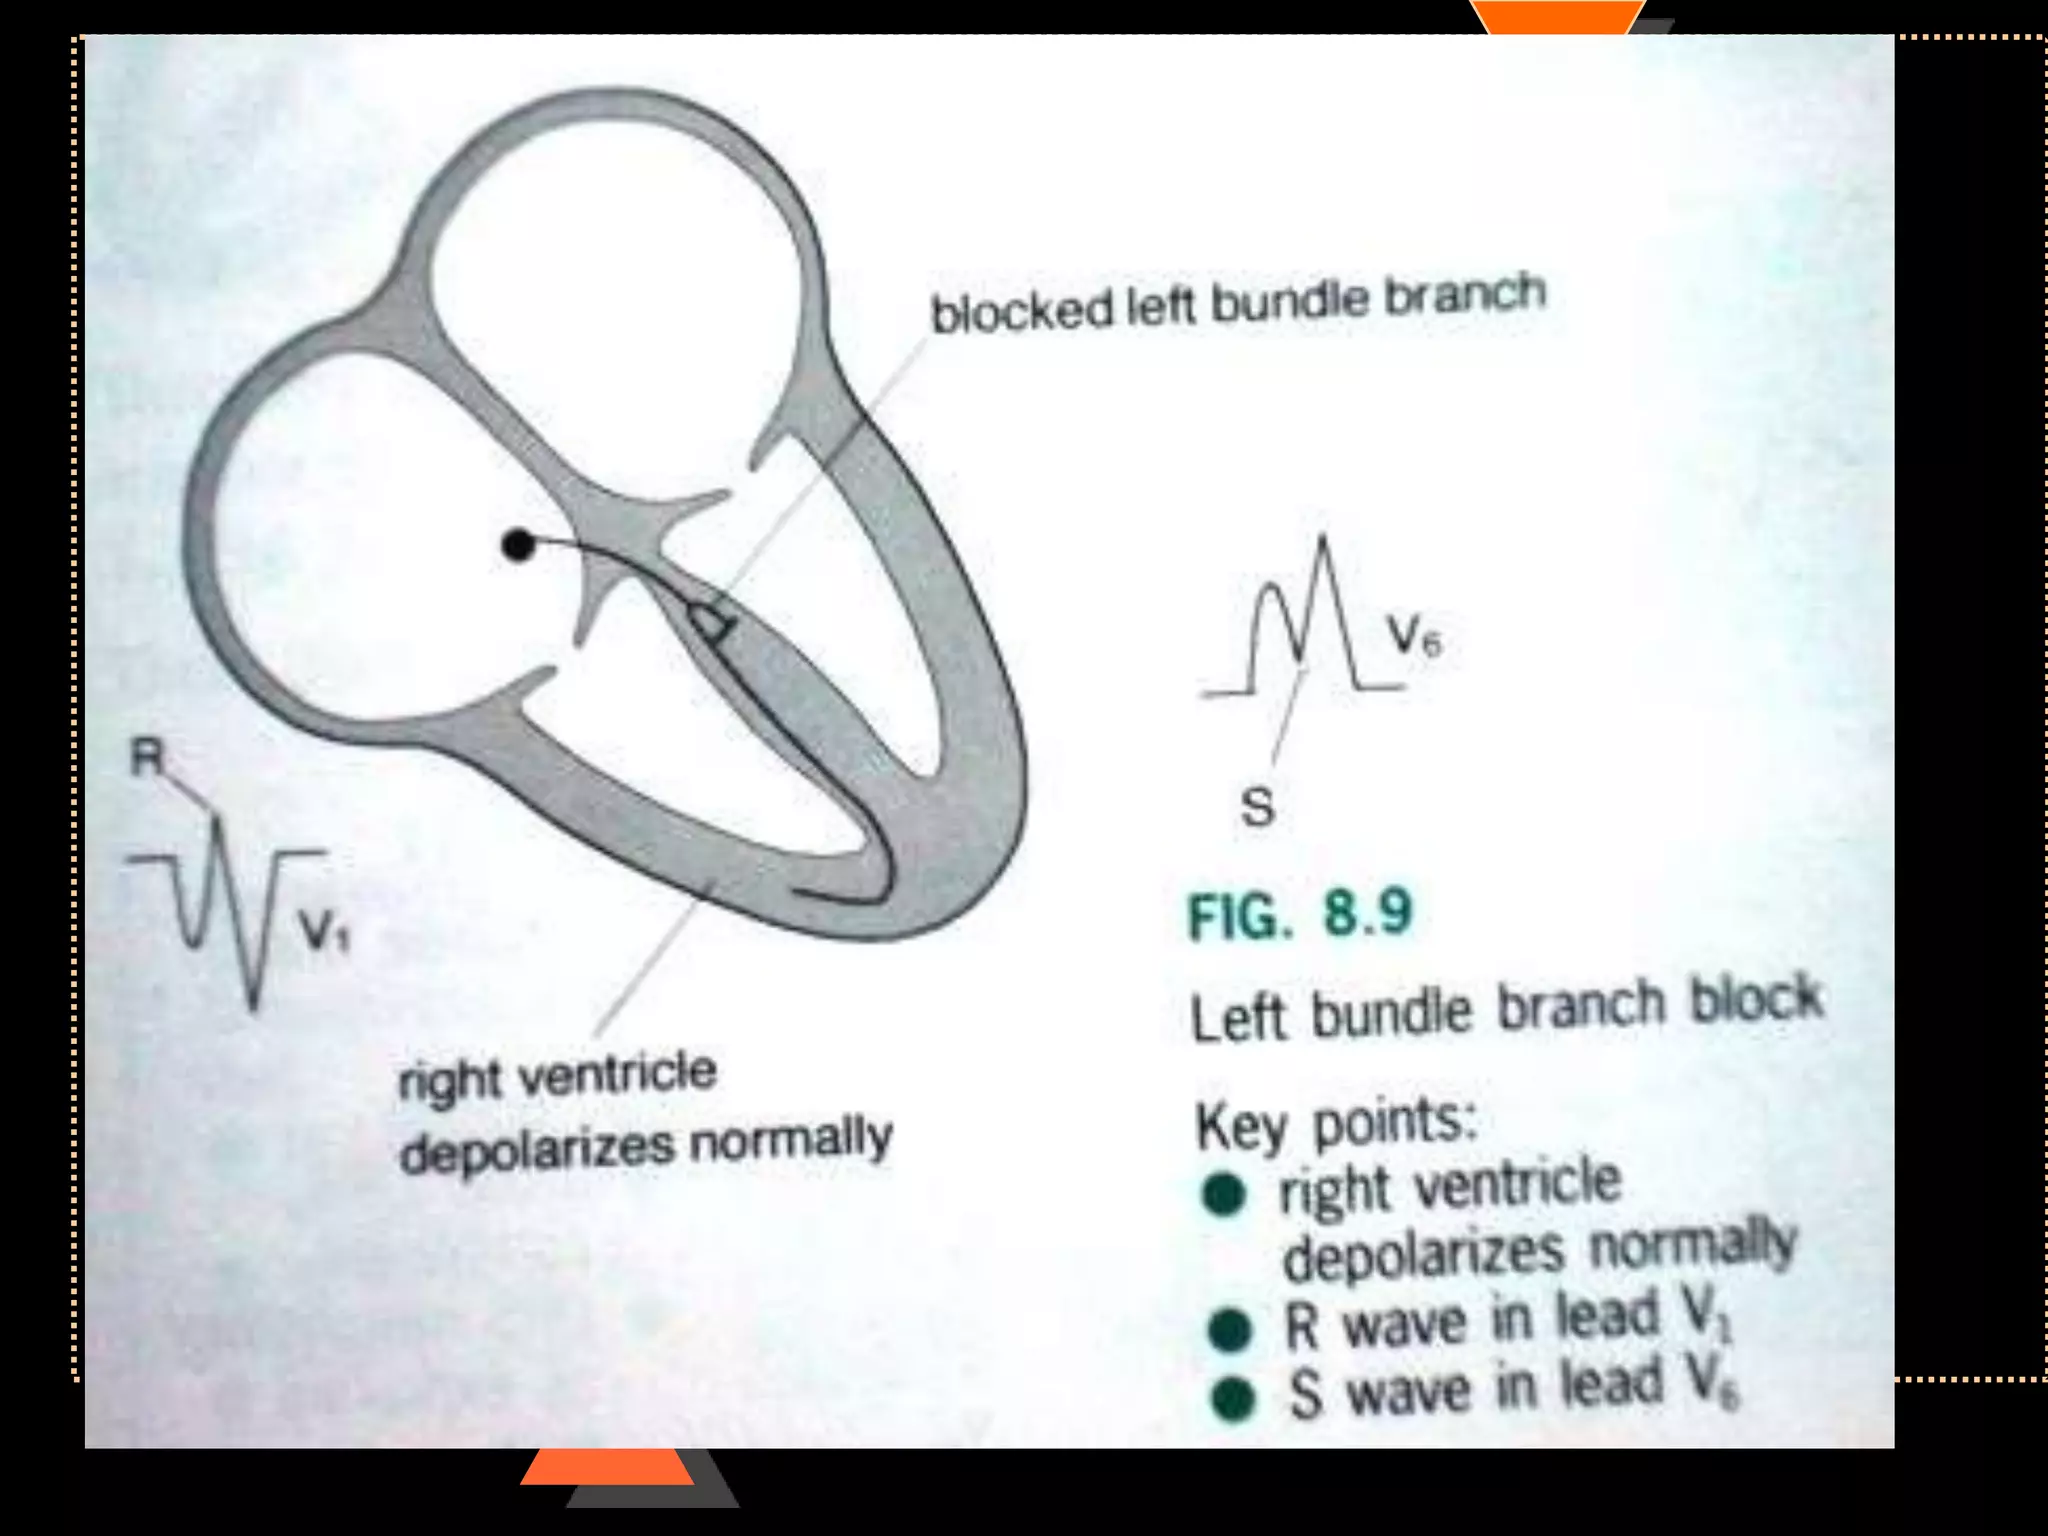
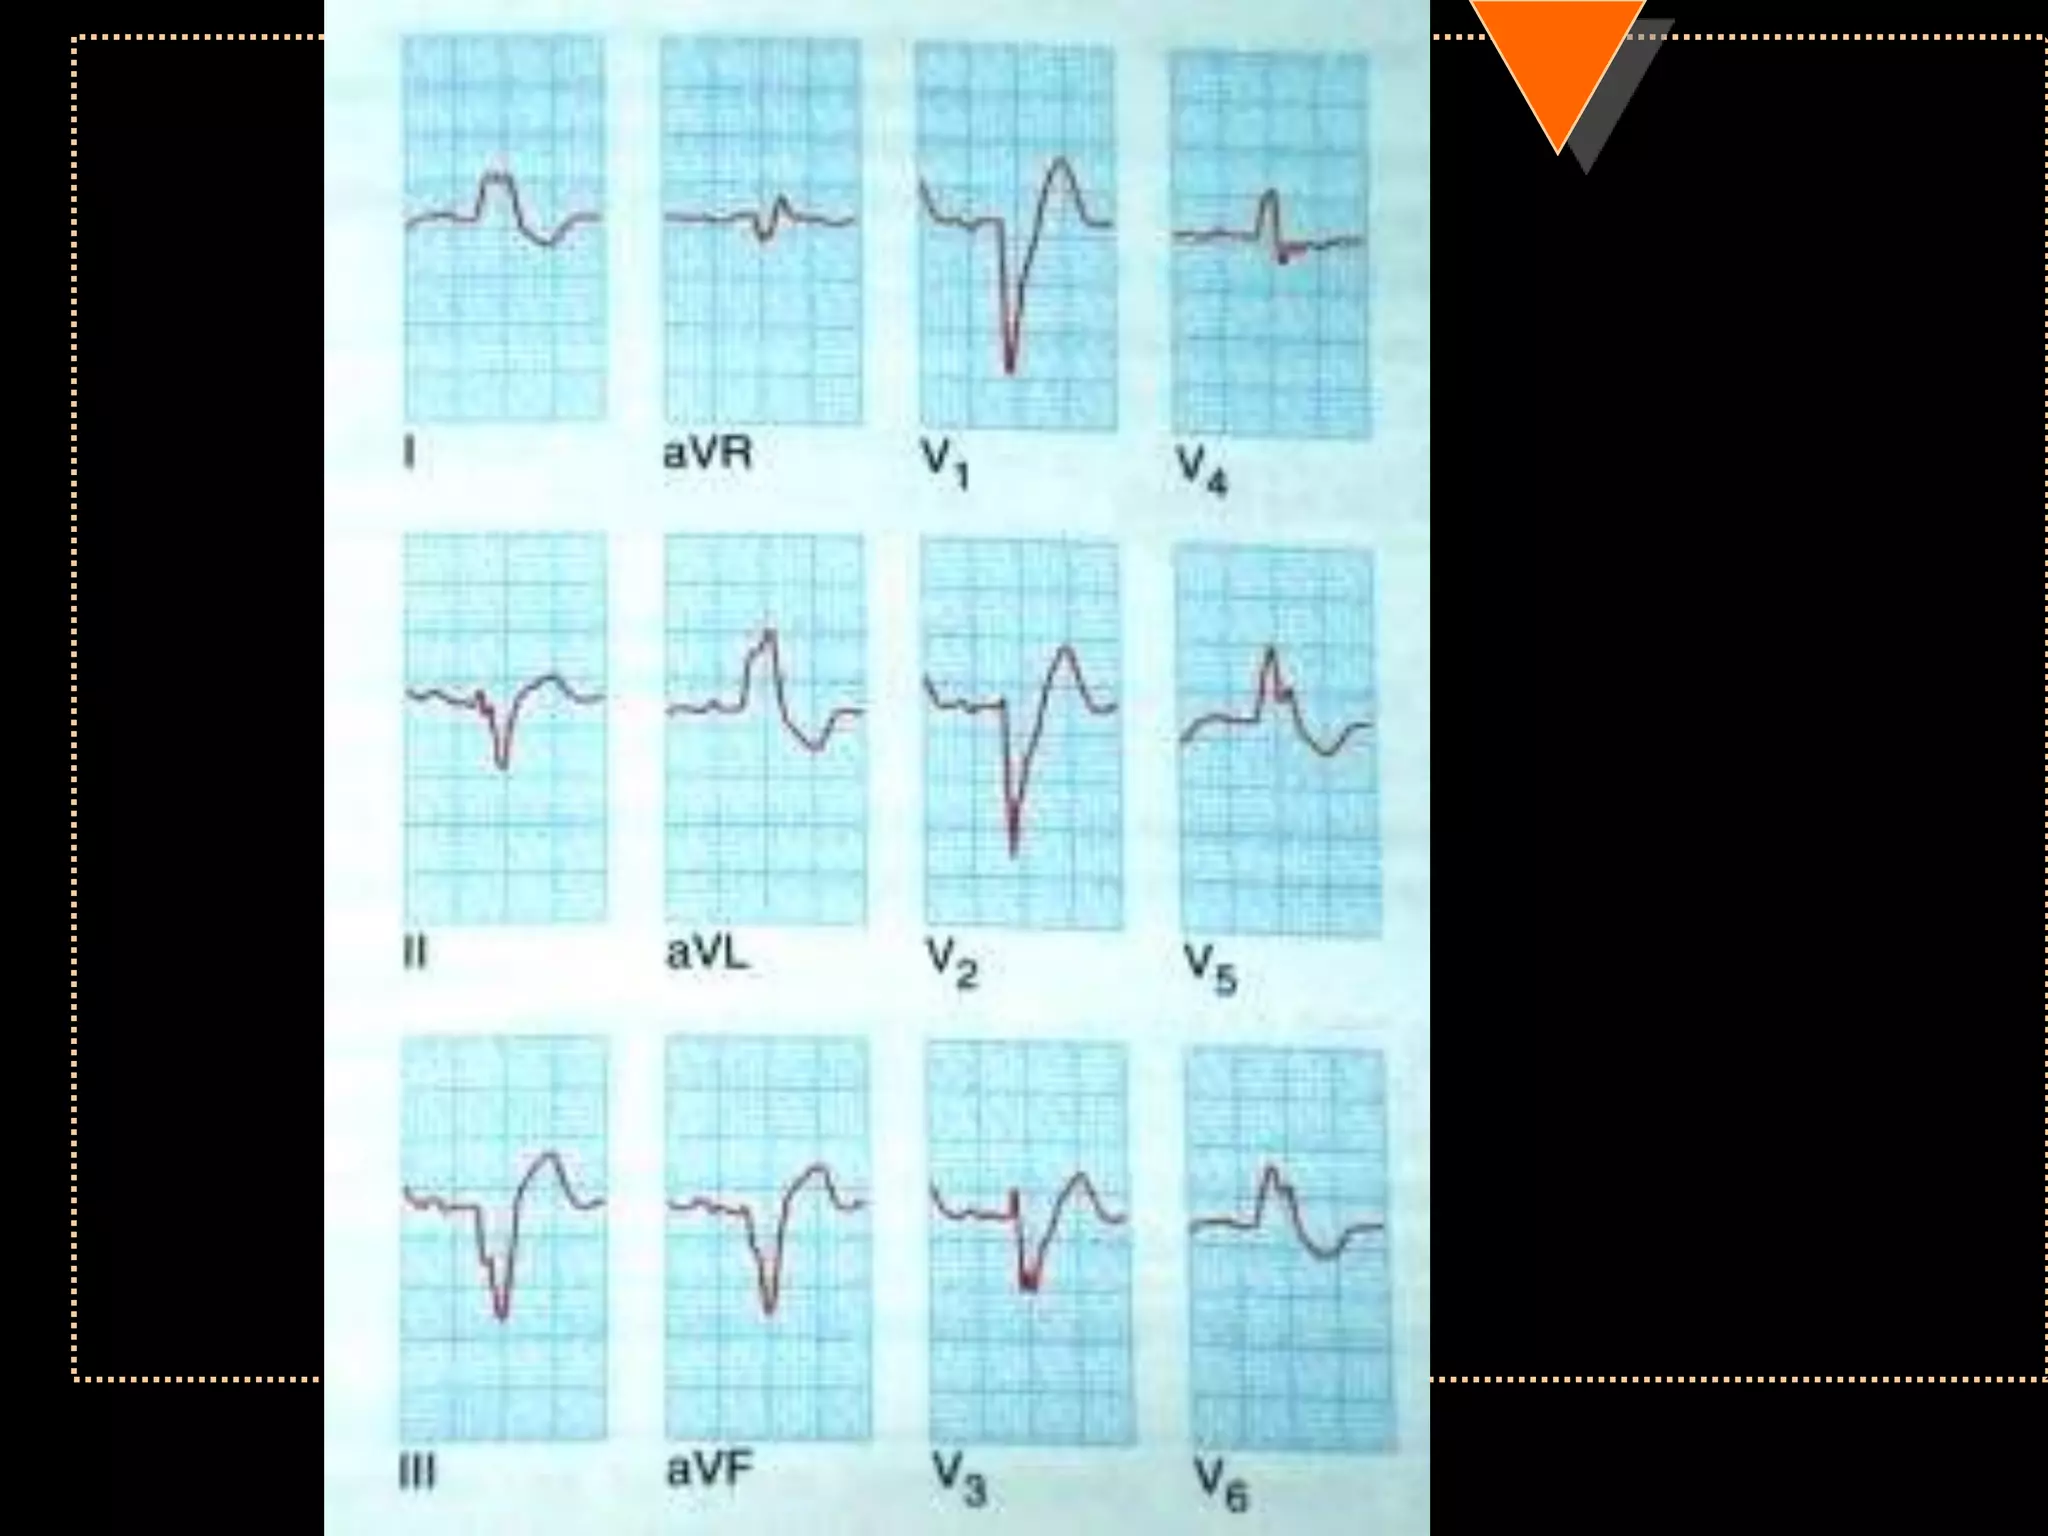
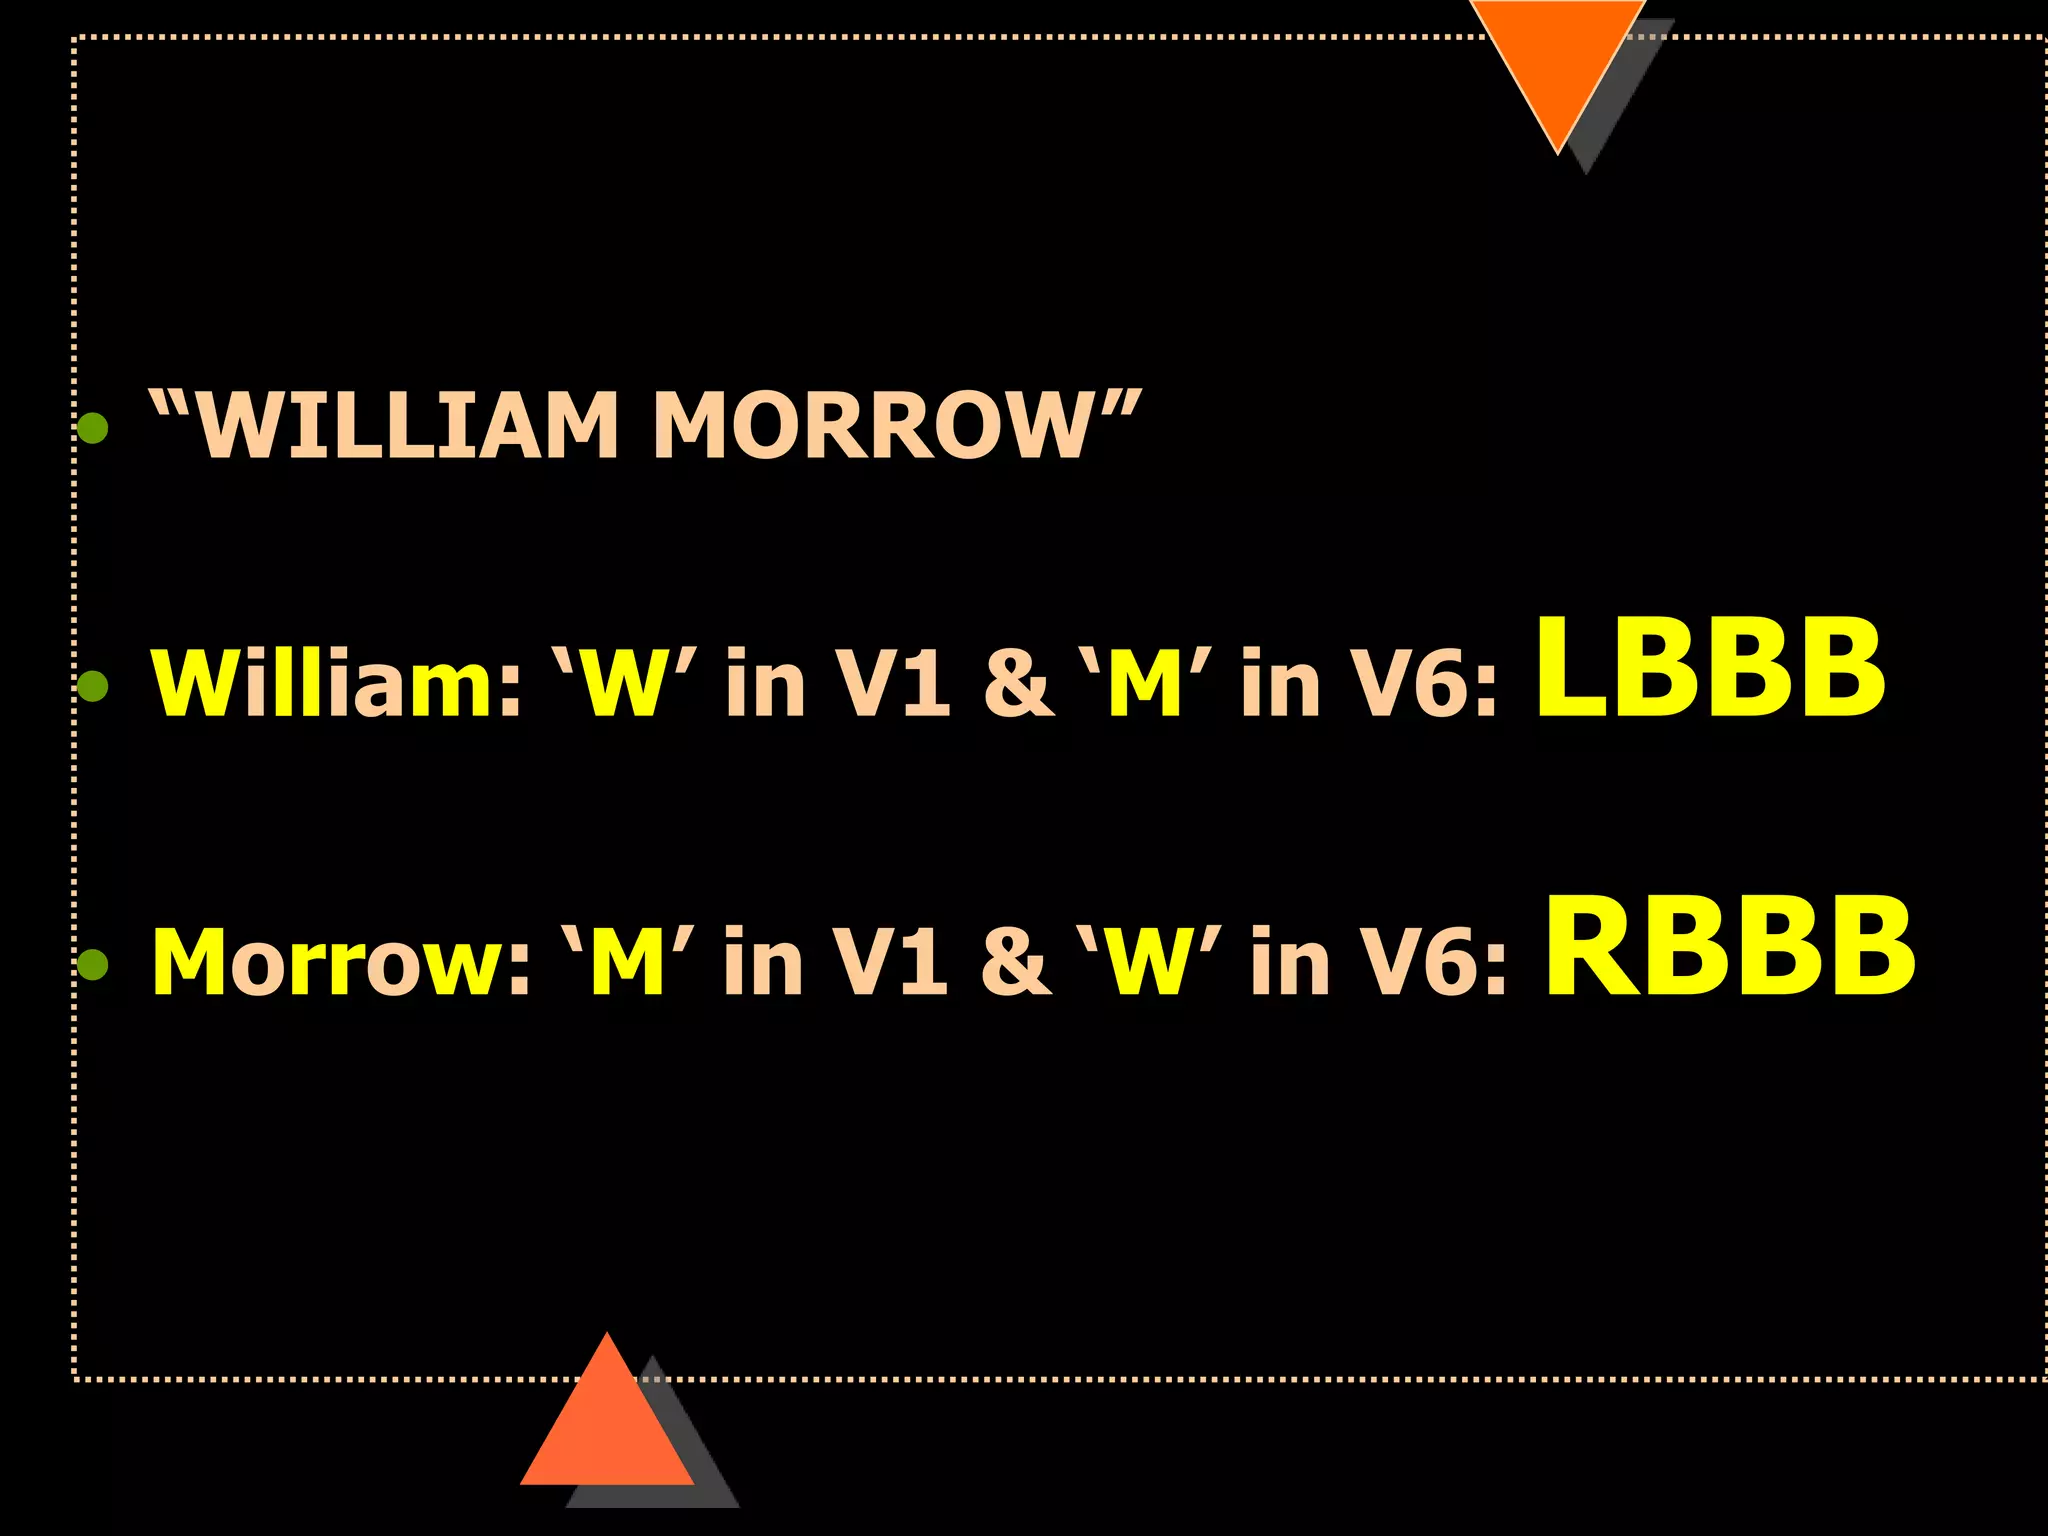


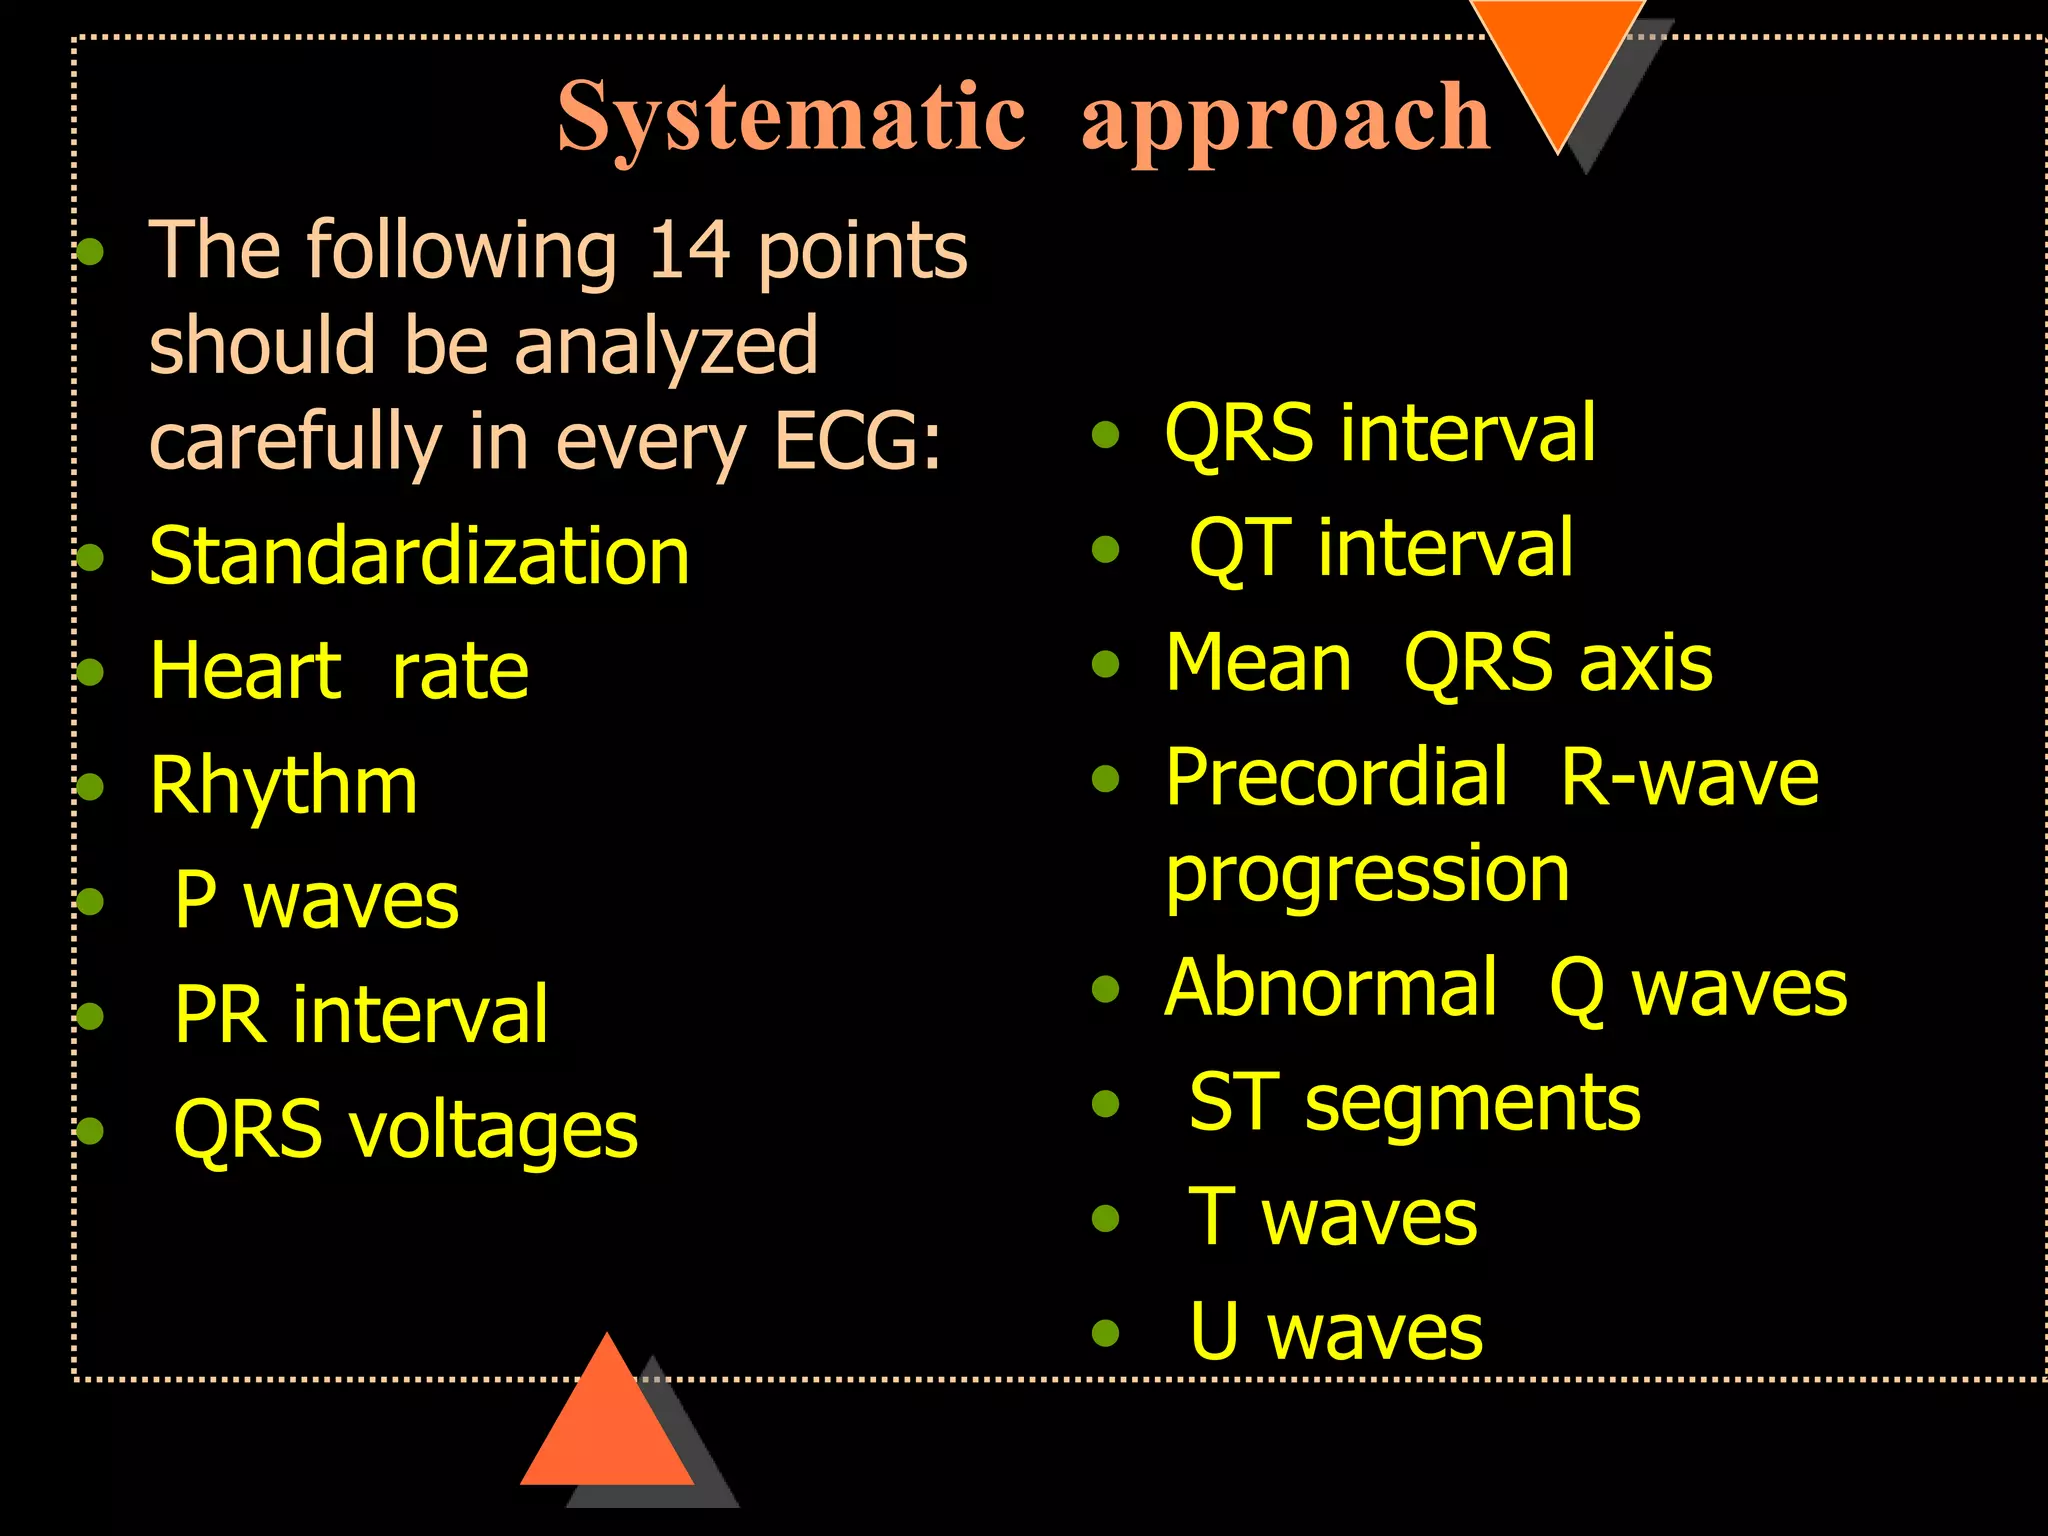
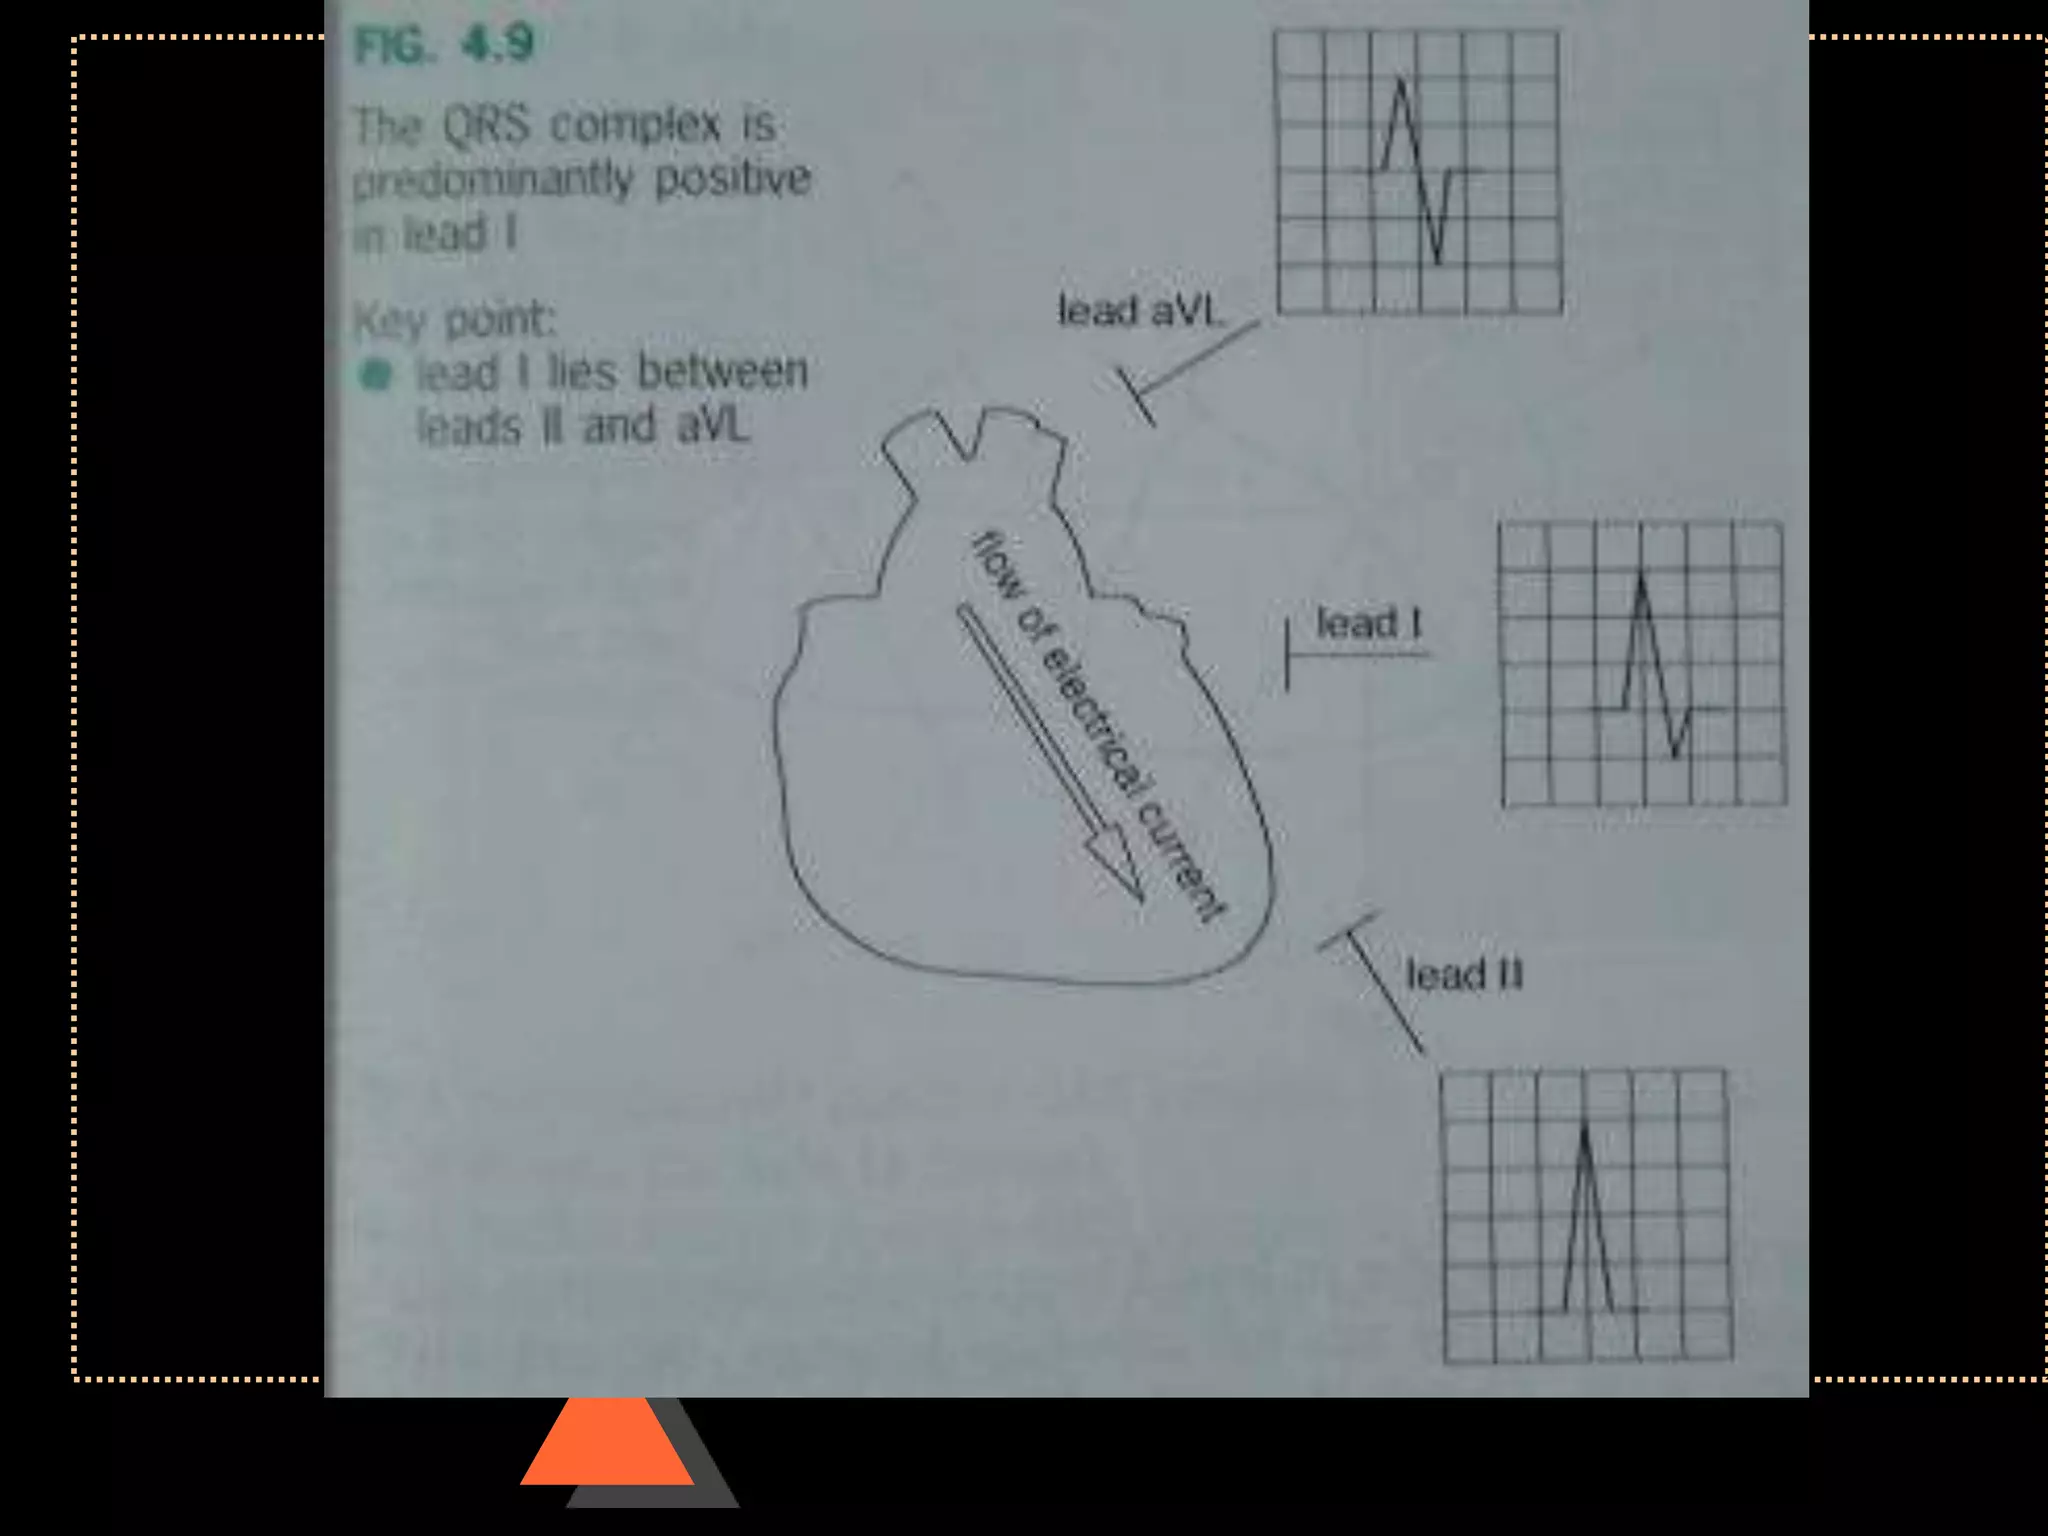
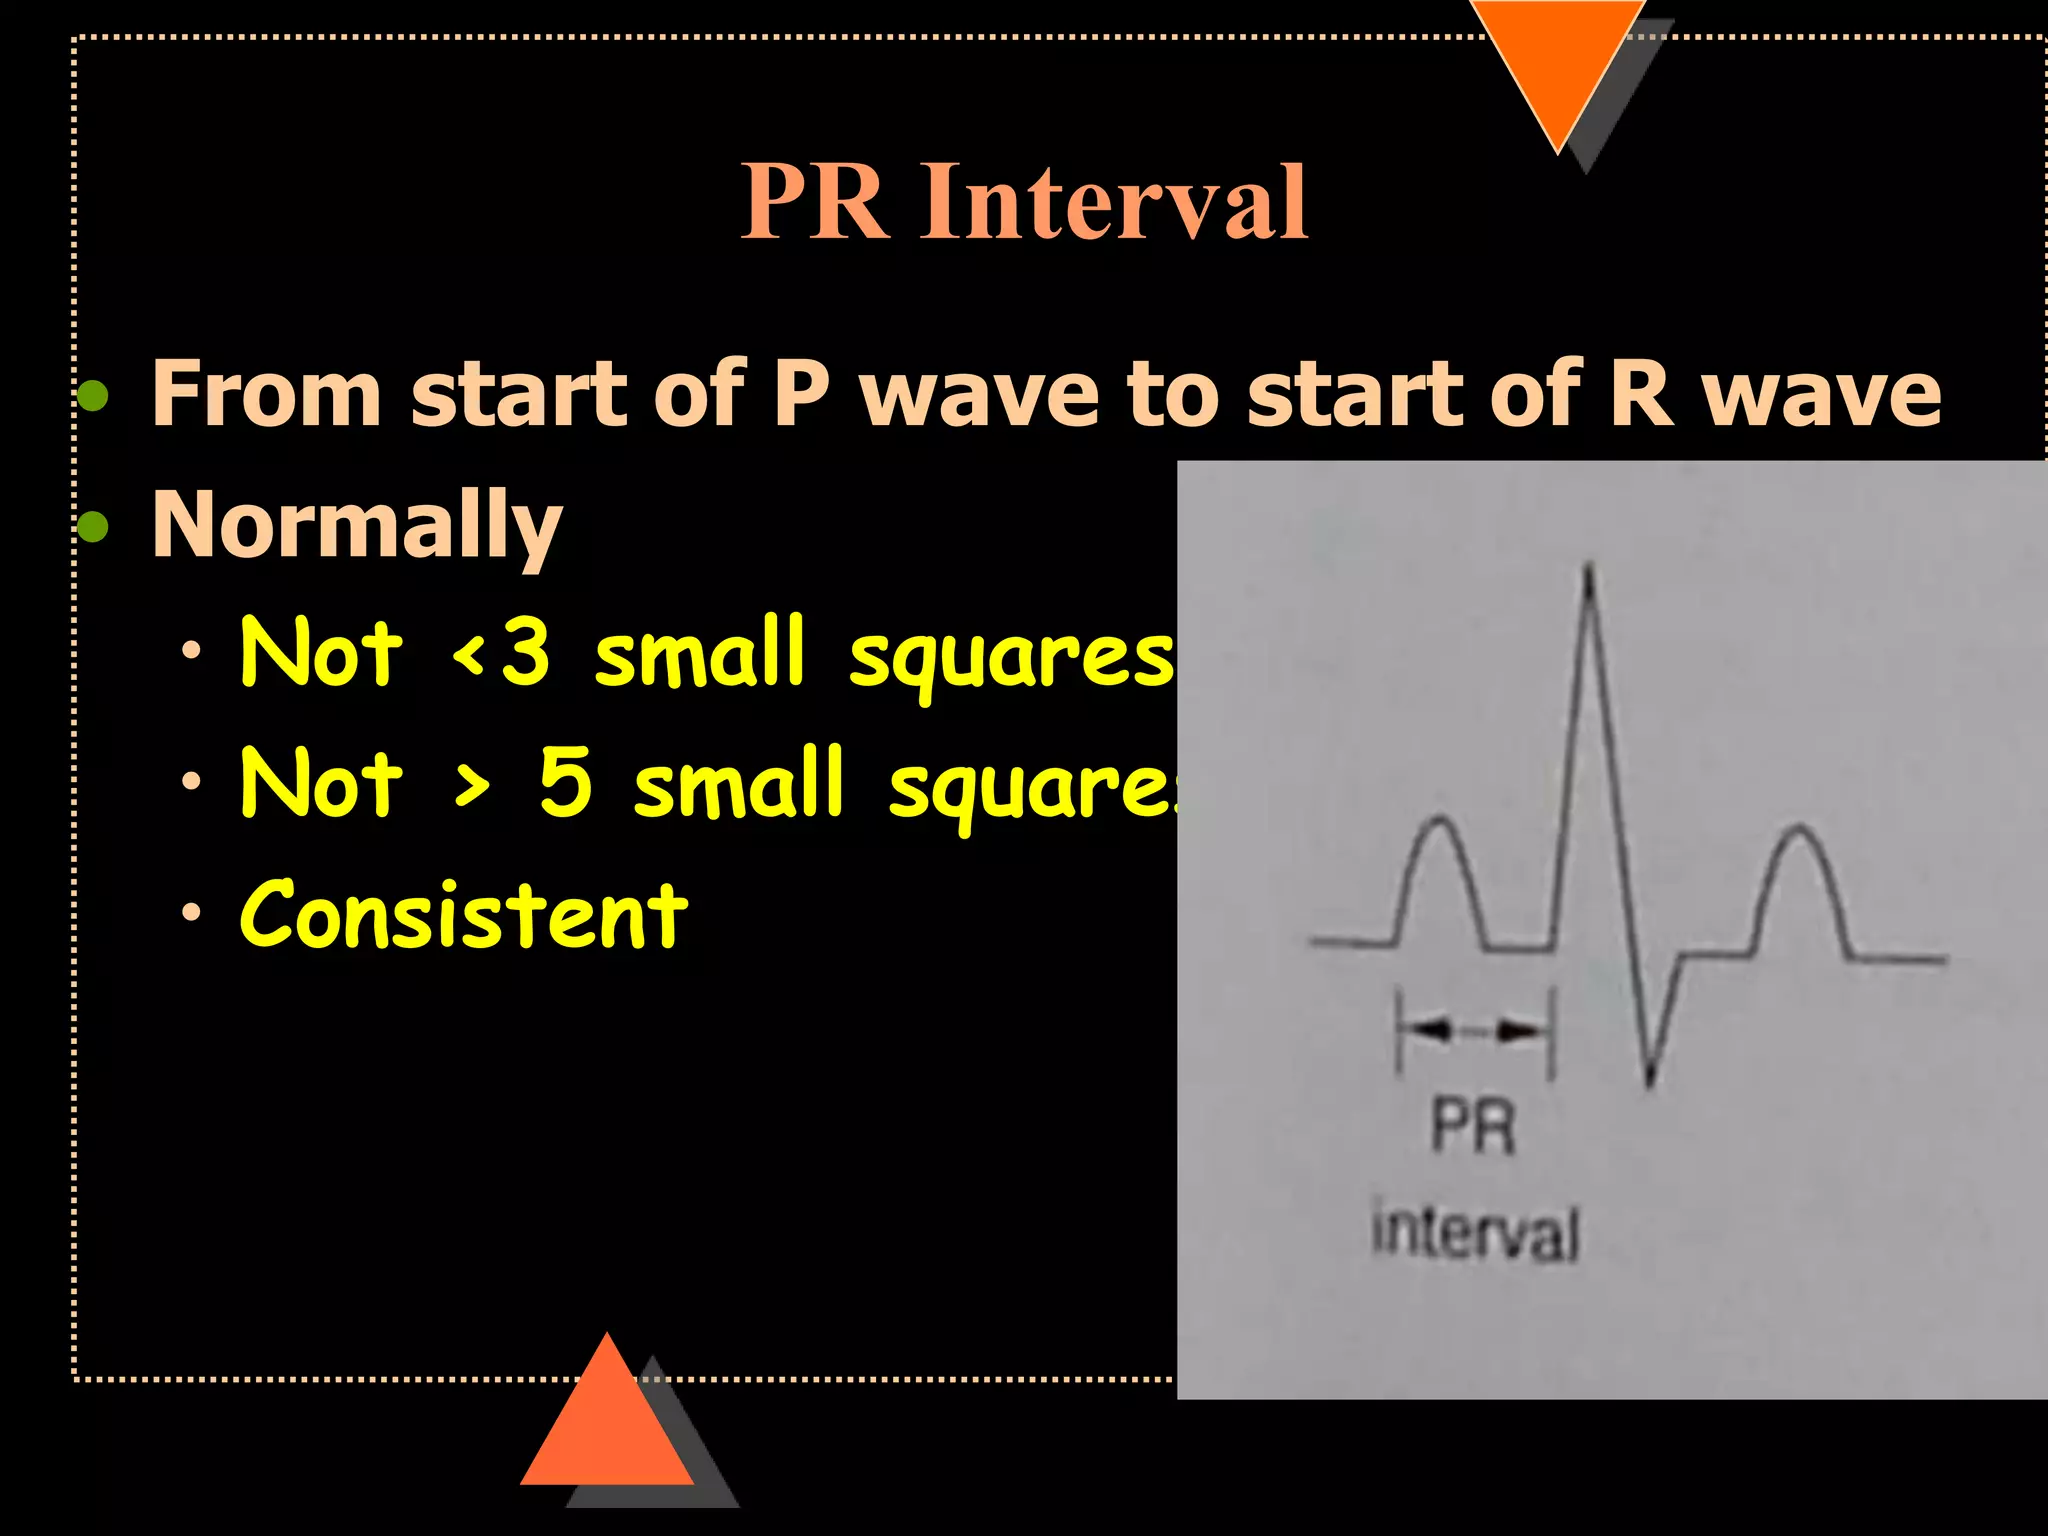
The document provides information on how to read and interpret an electrocardiogram (ECG). It discusses the components of an ECG including the leads, waves, intervals and segments. It describes how to analyze key aspects such as heart rate, rhythm, axes, hypertrophy, blocks, and abnormalities. The systematic 14-point approach involves analyzing standardization, rate, rhythm, P waves, intervals, voltages, axes, and segments to interpret the ECG and identify any pathological conditions.


