Download as PDF, PPTX
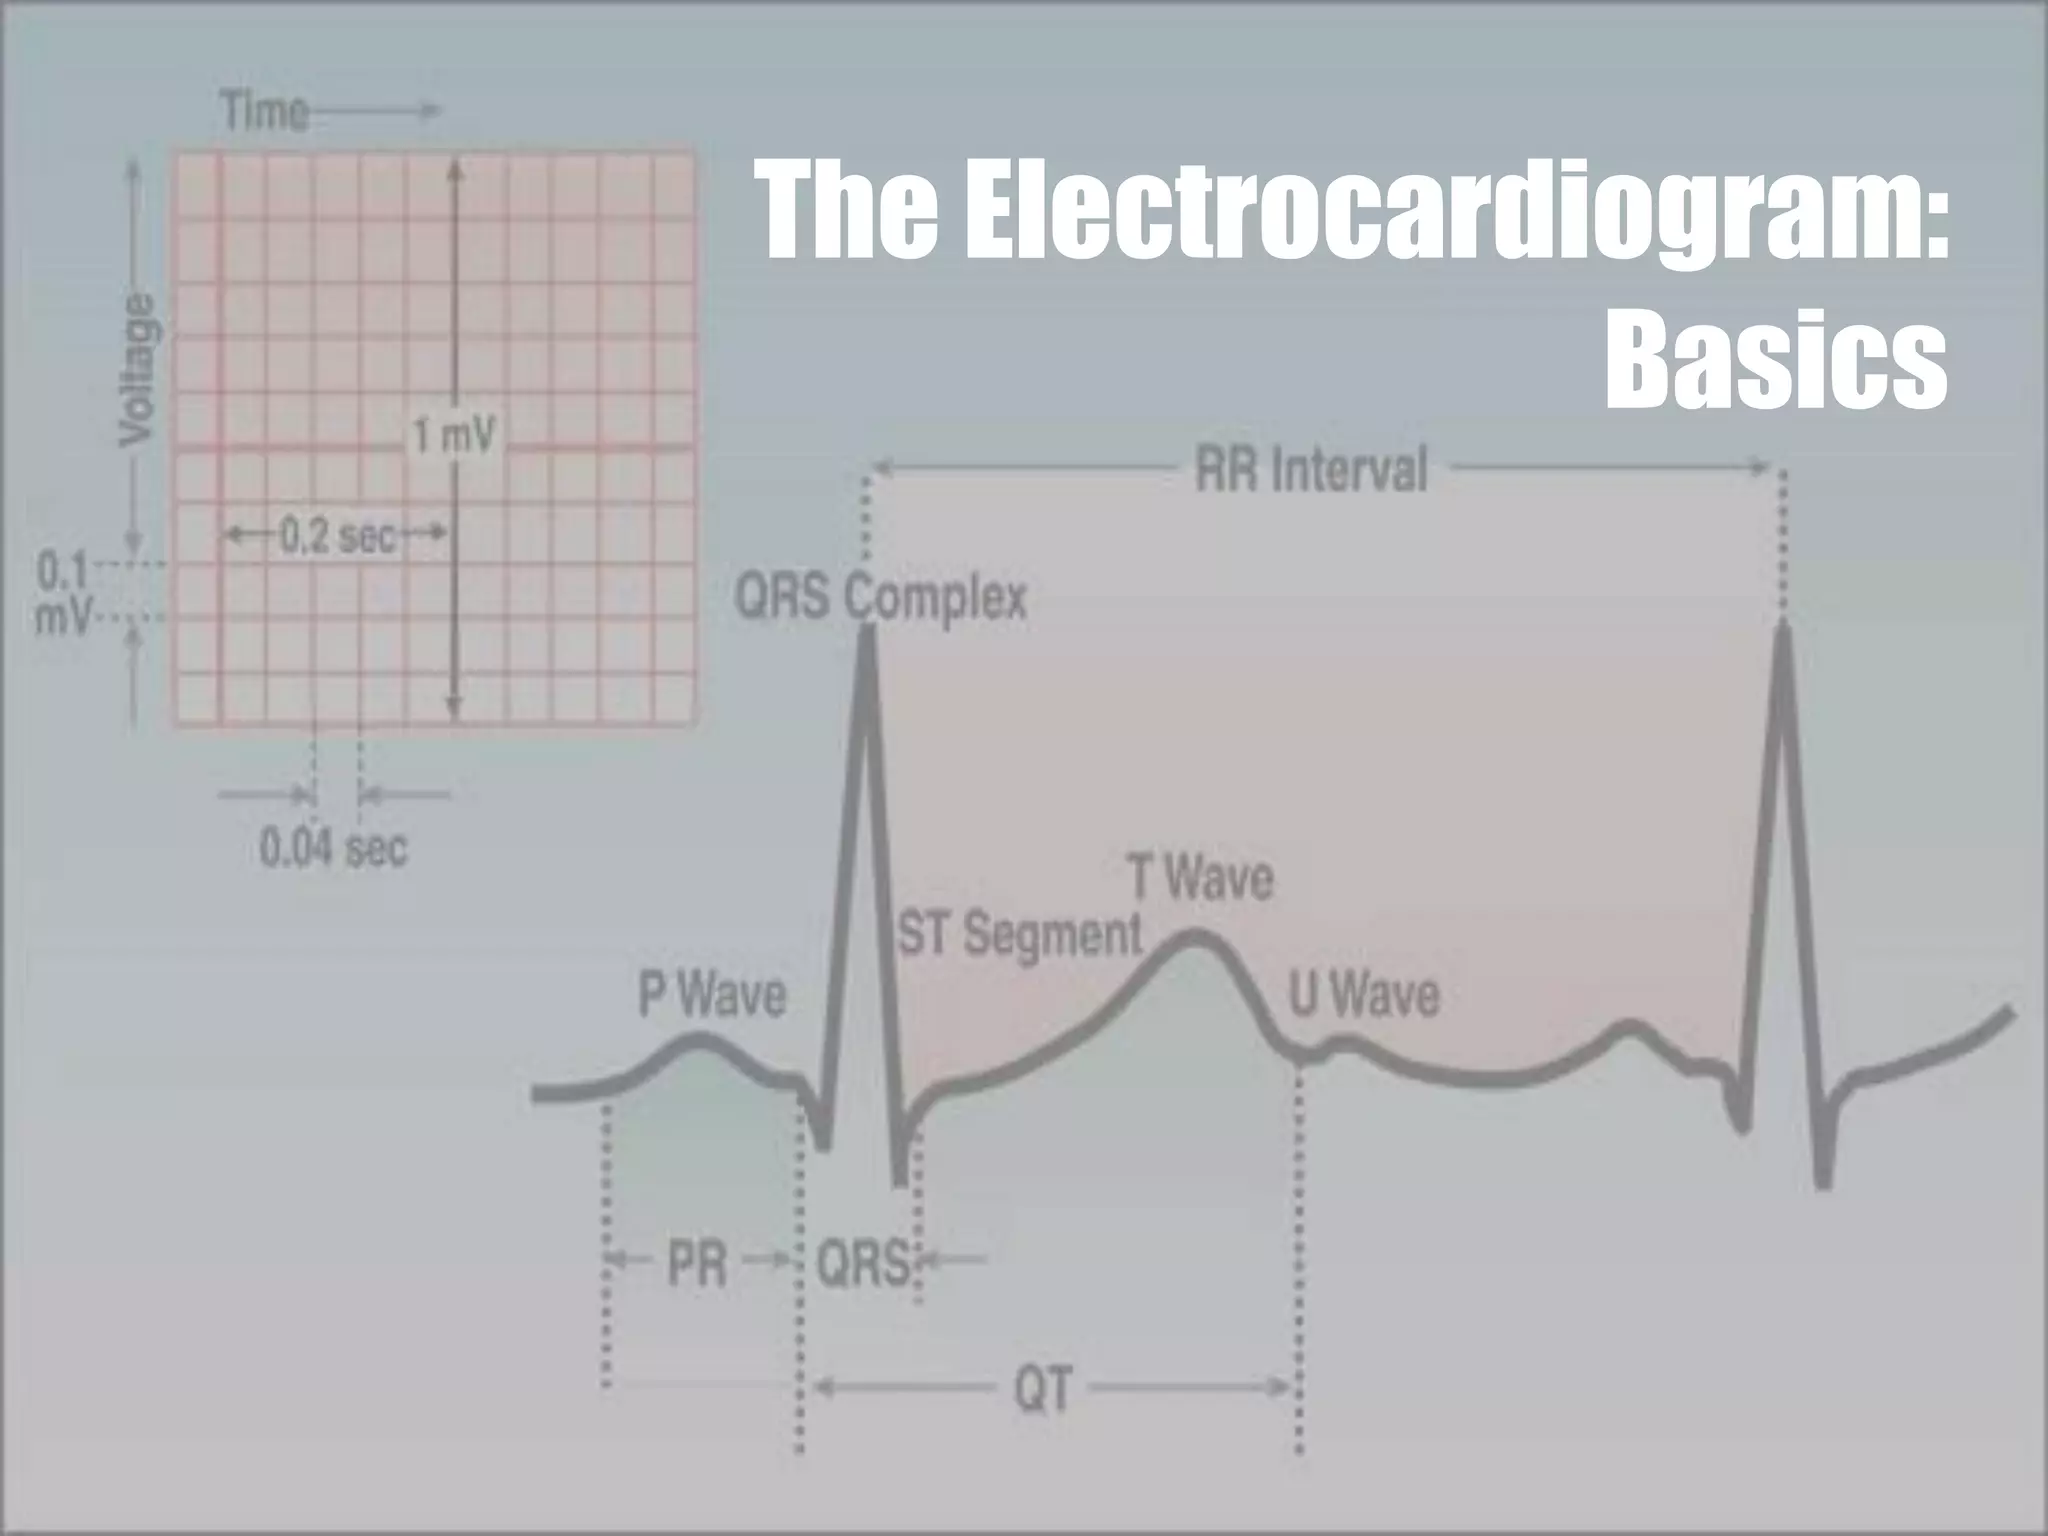
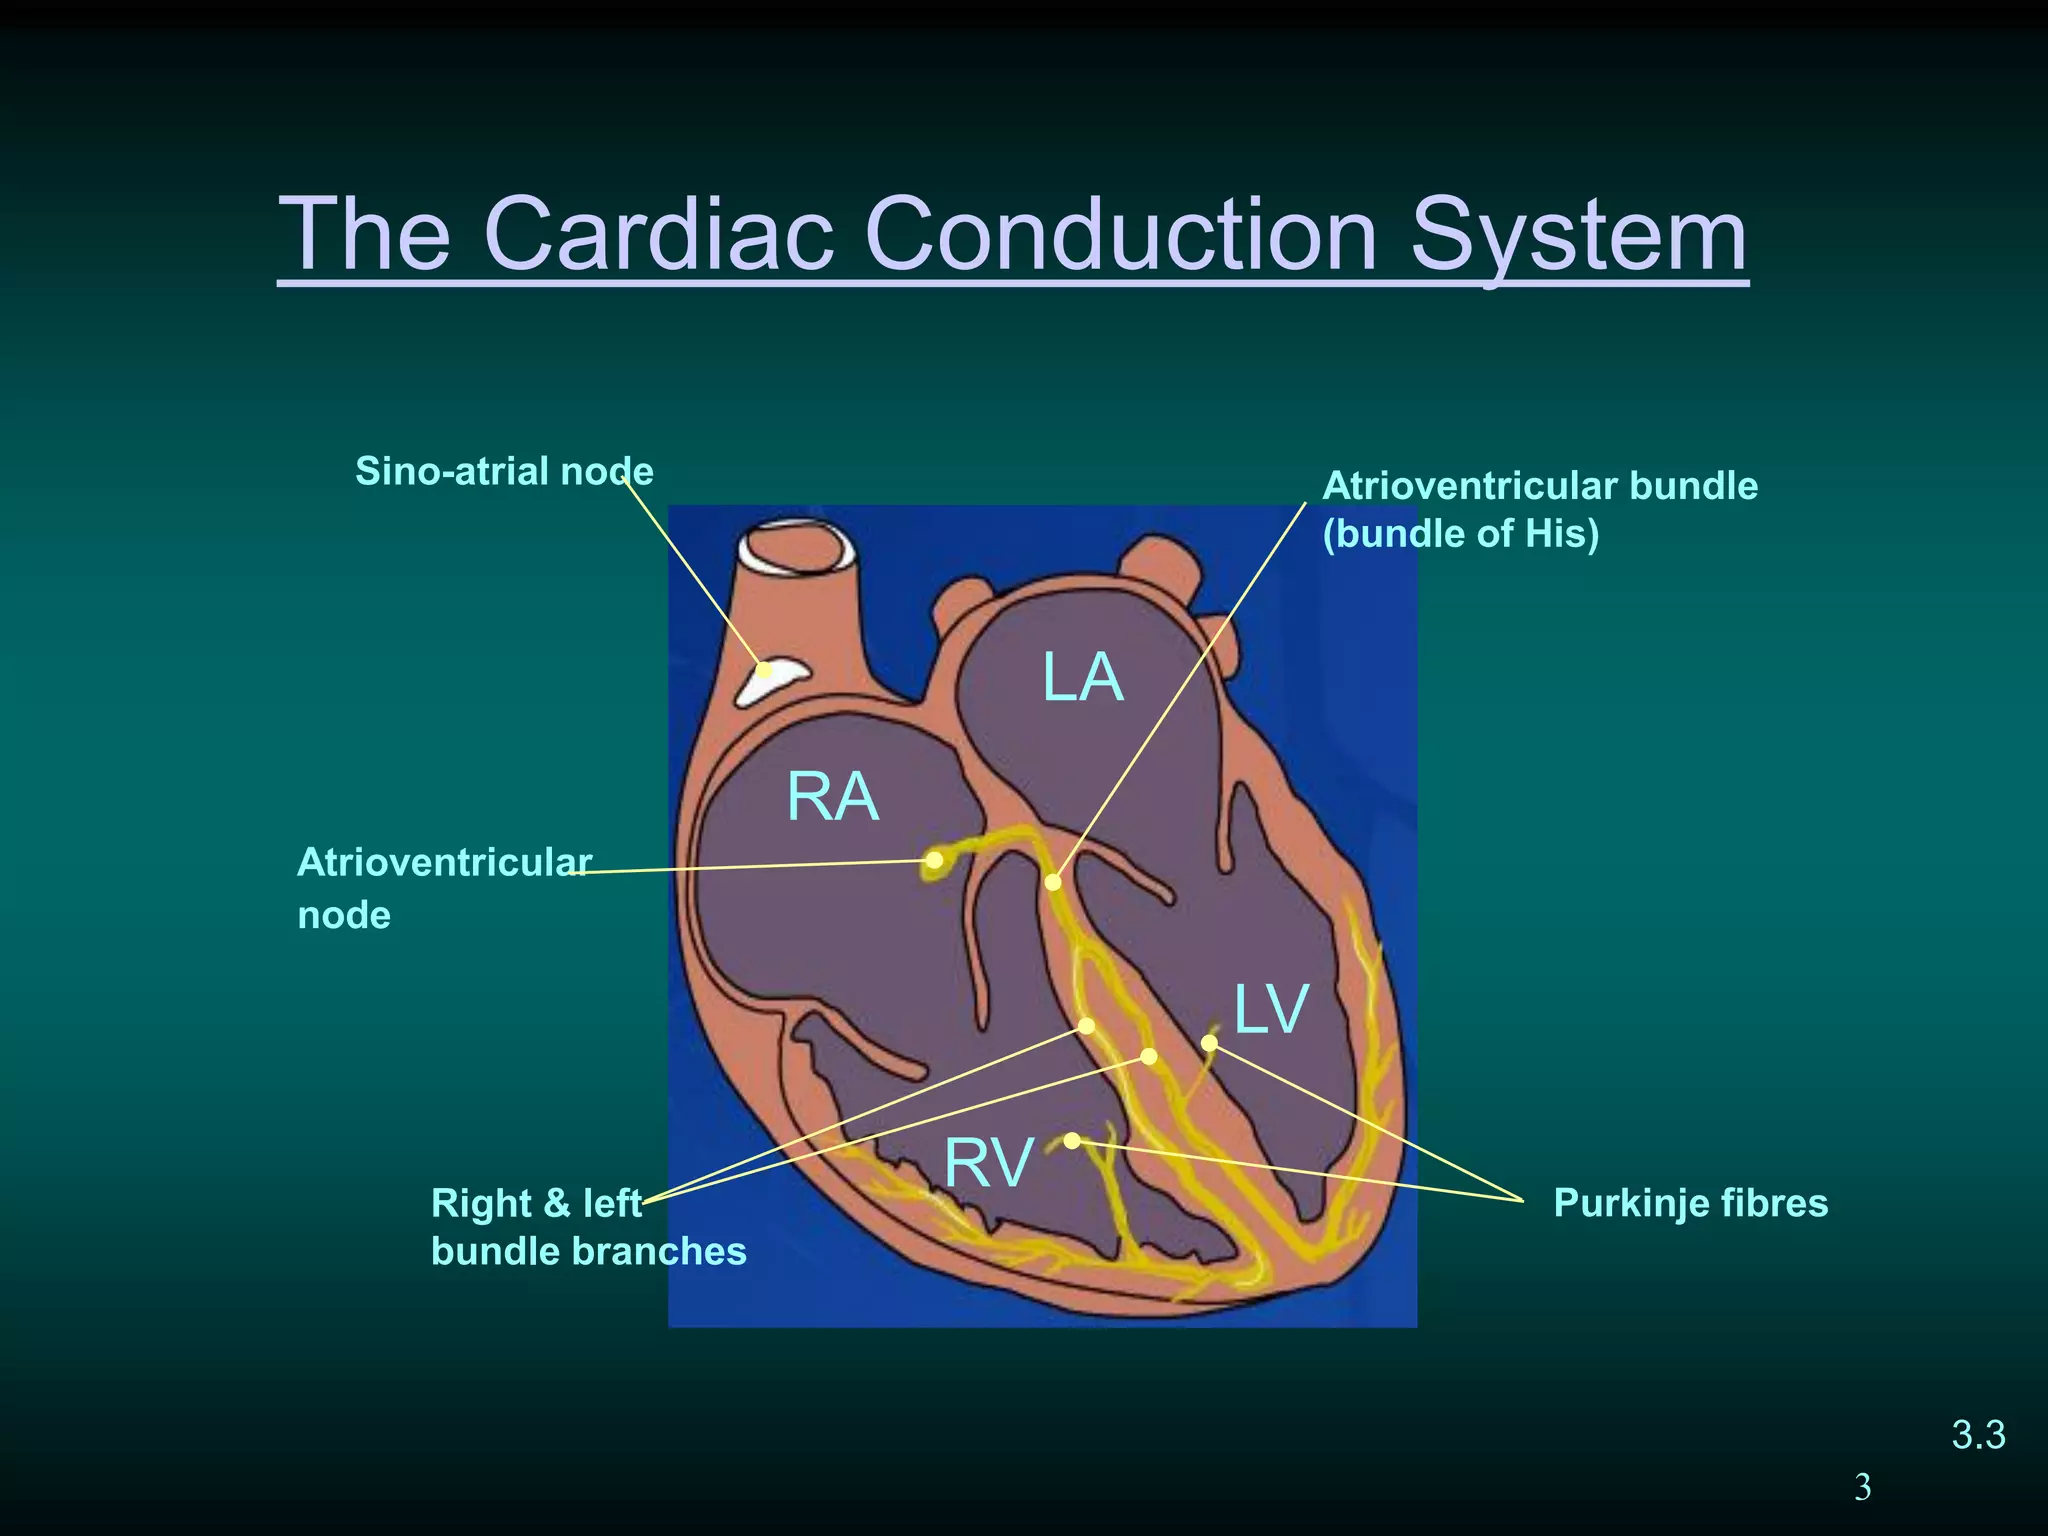
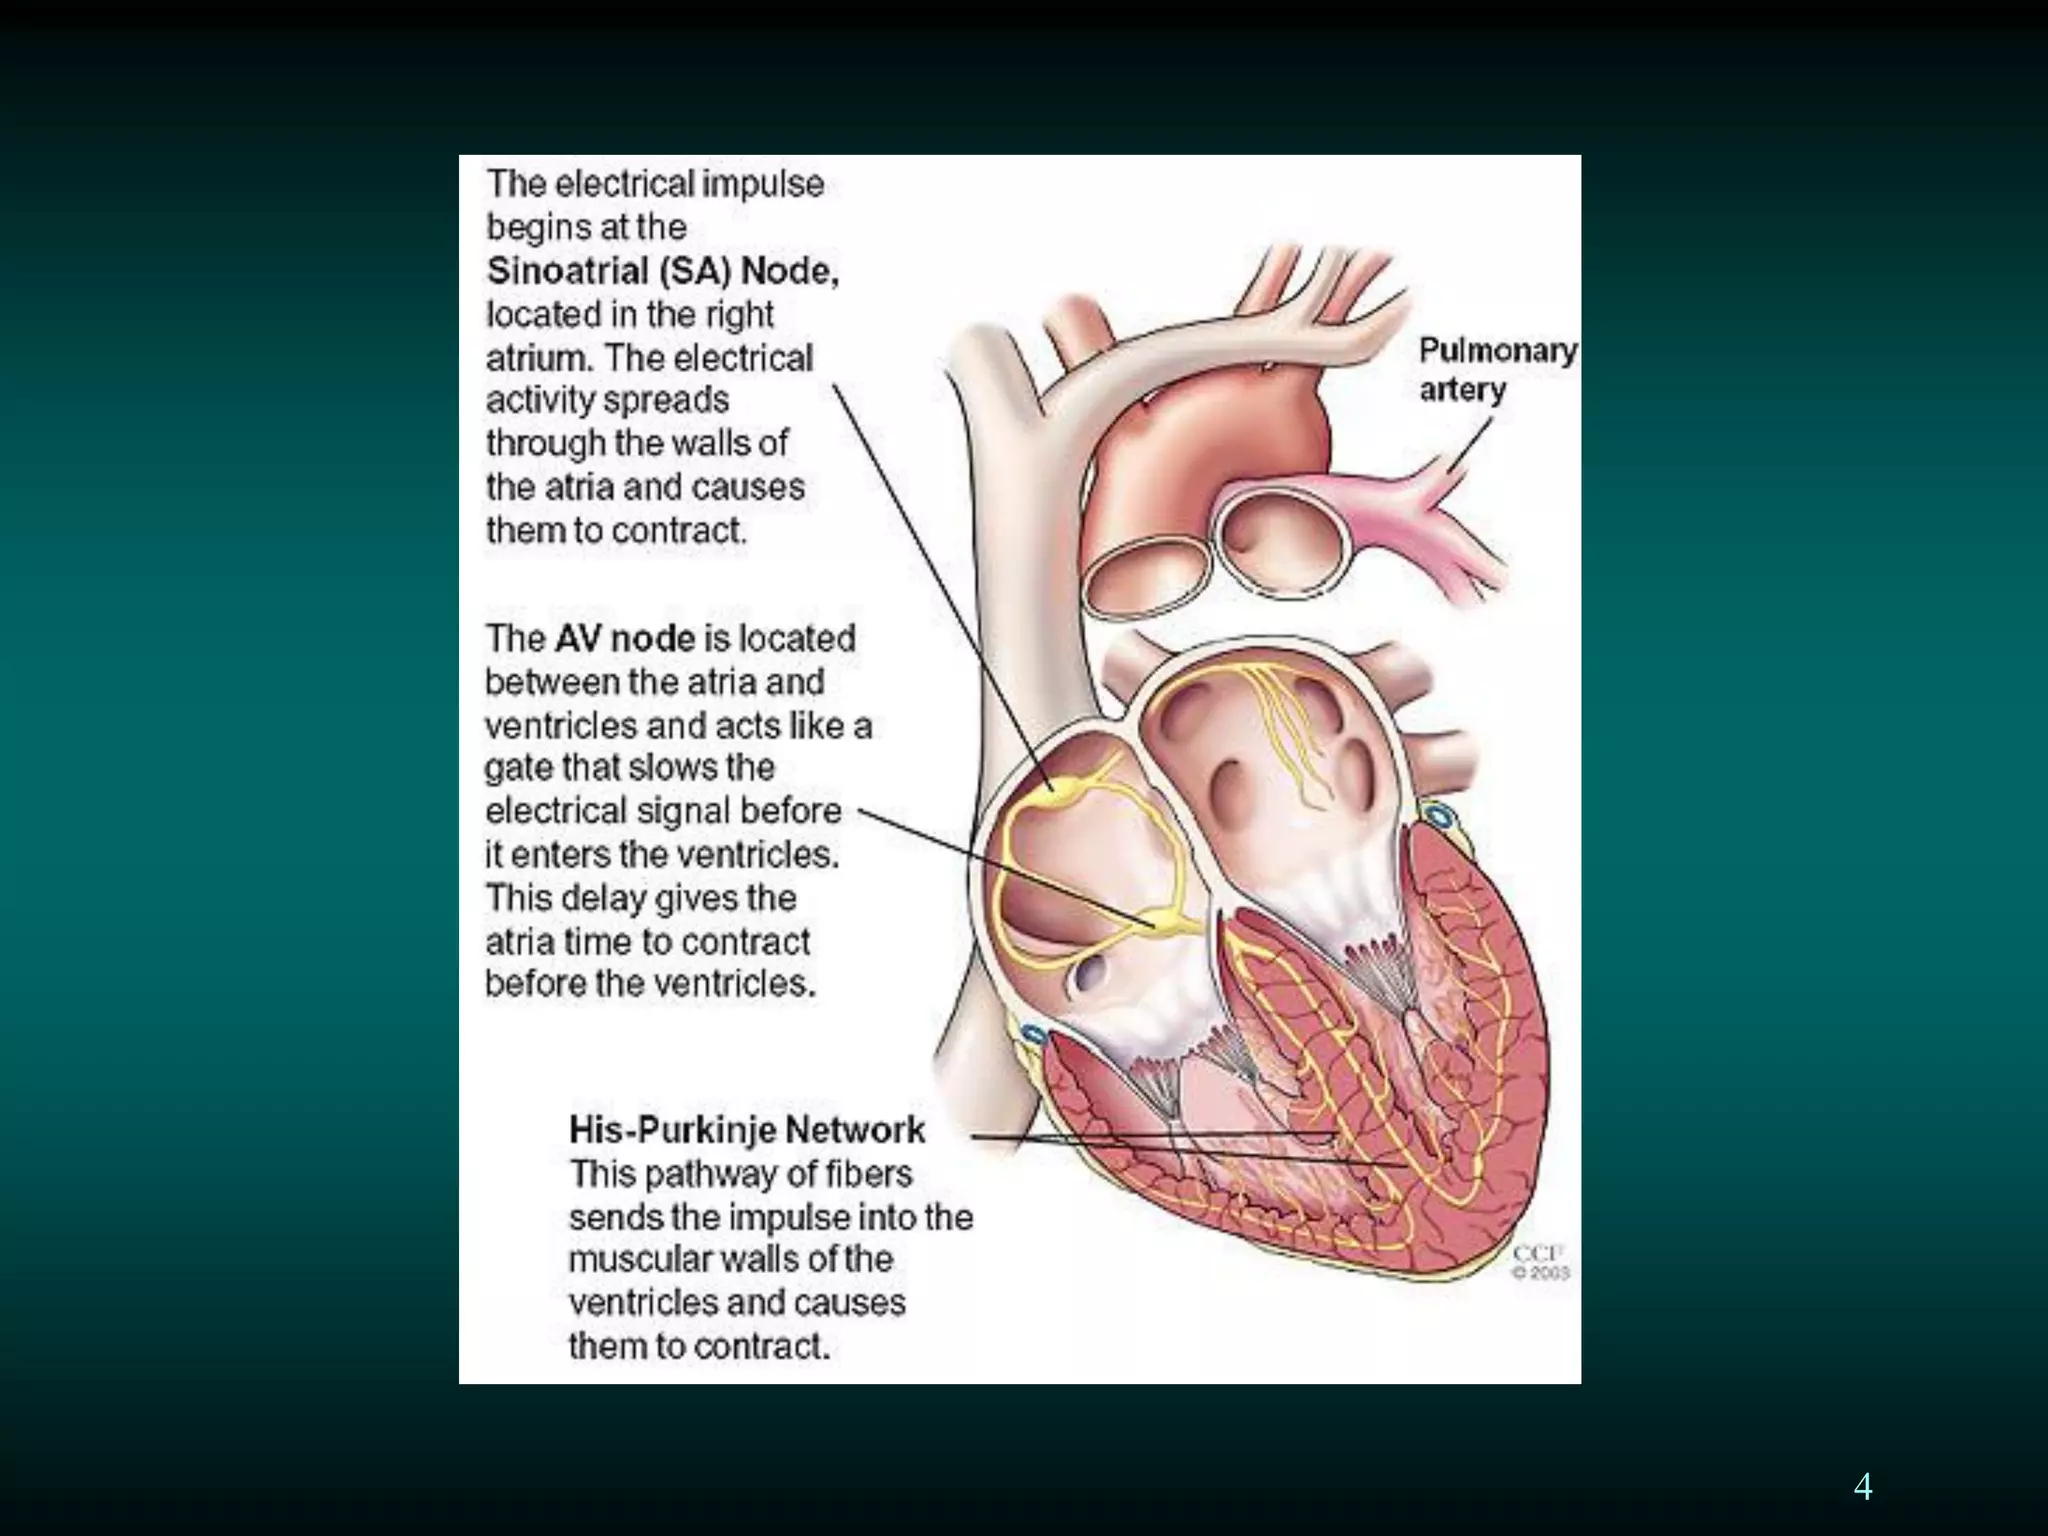
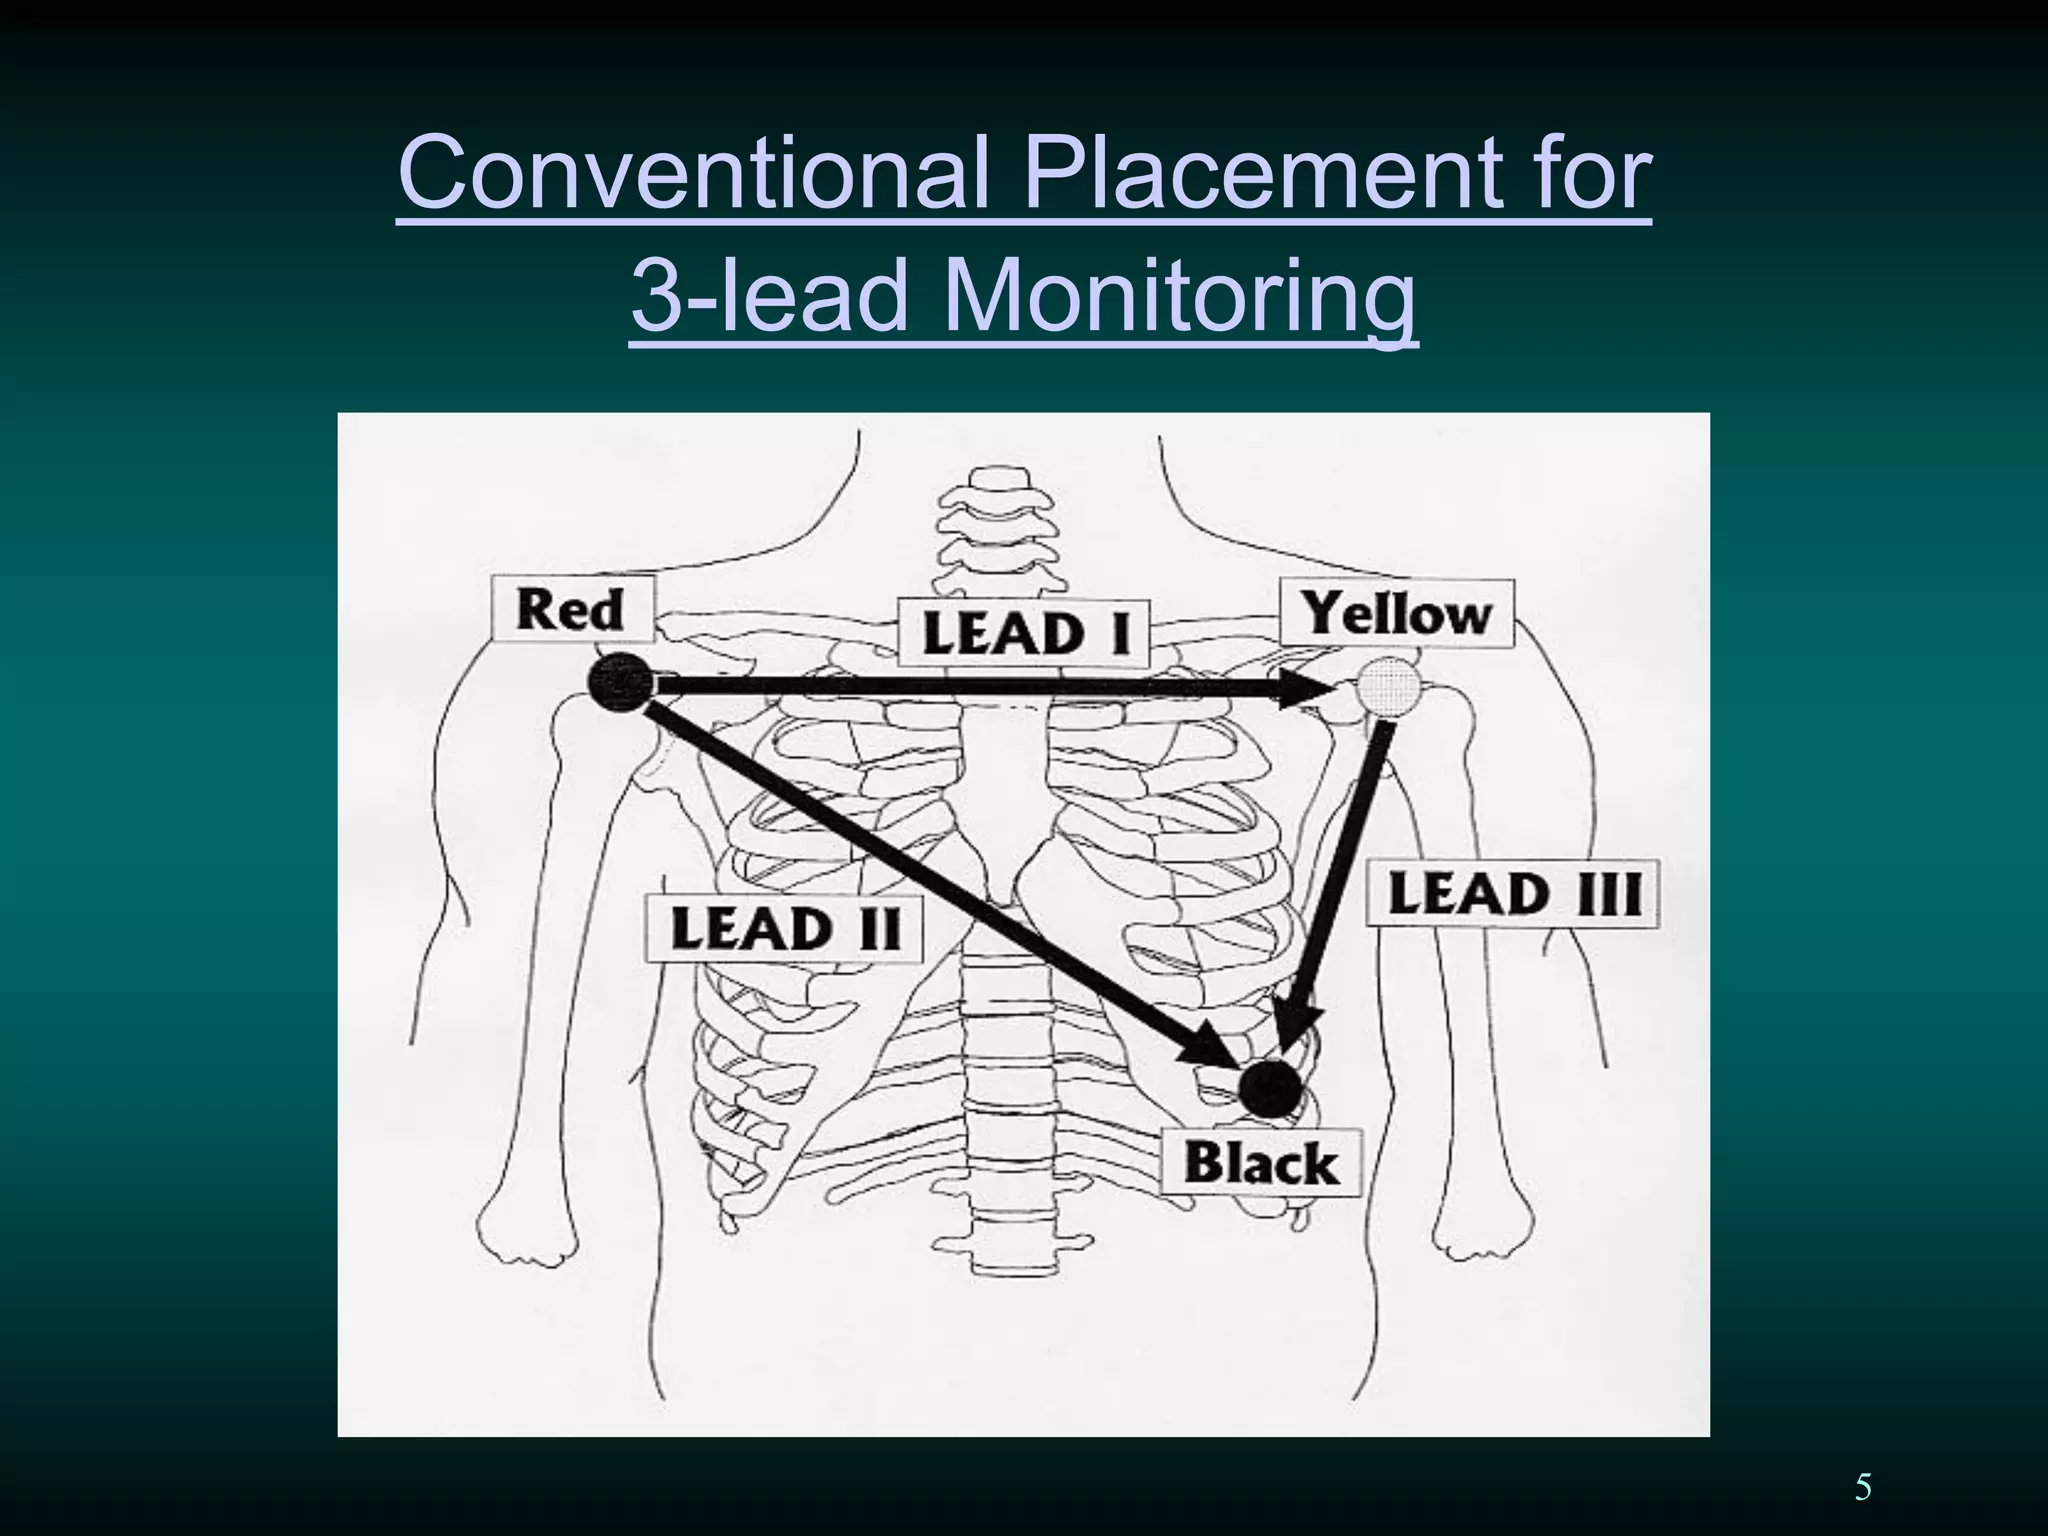

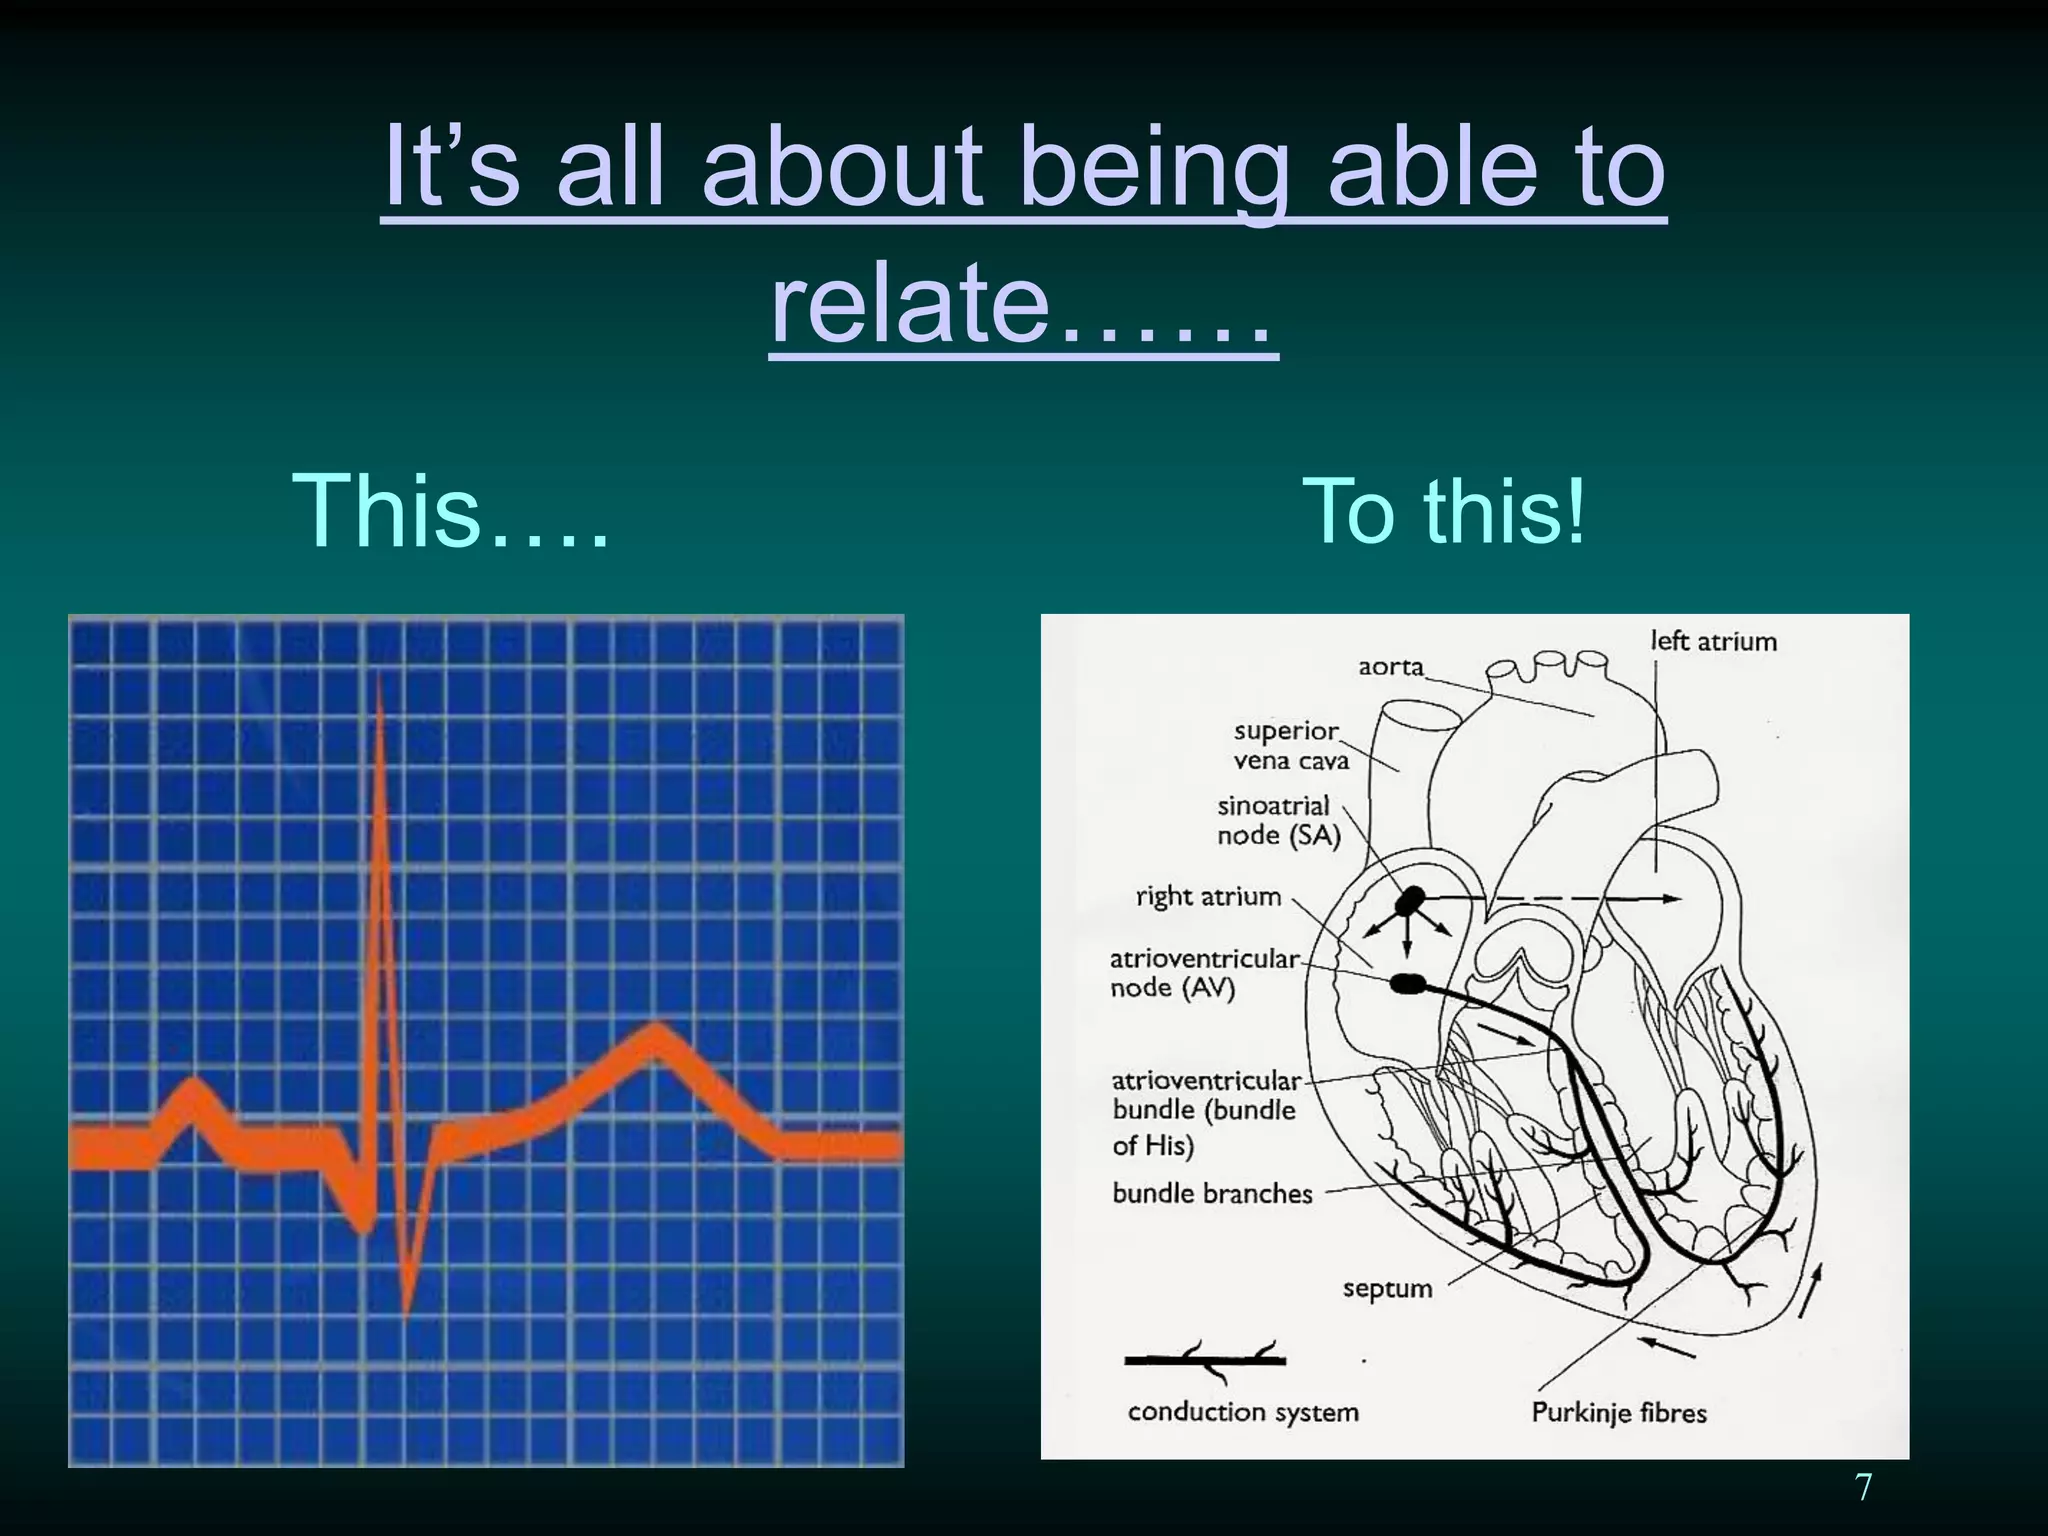
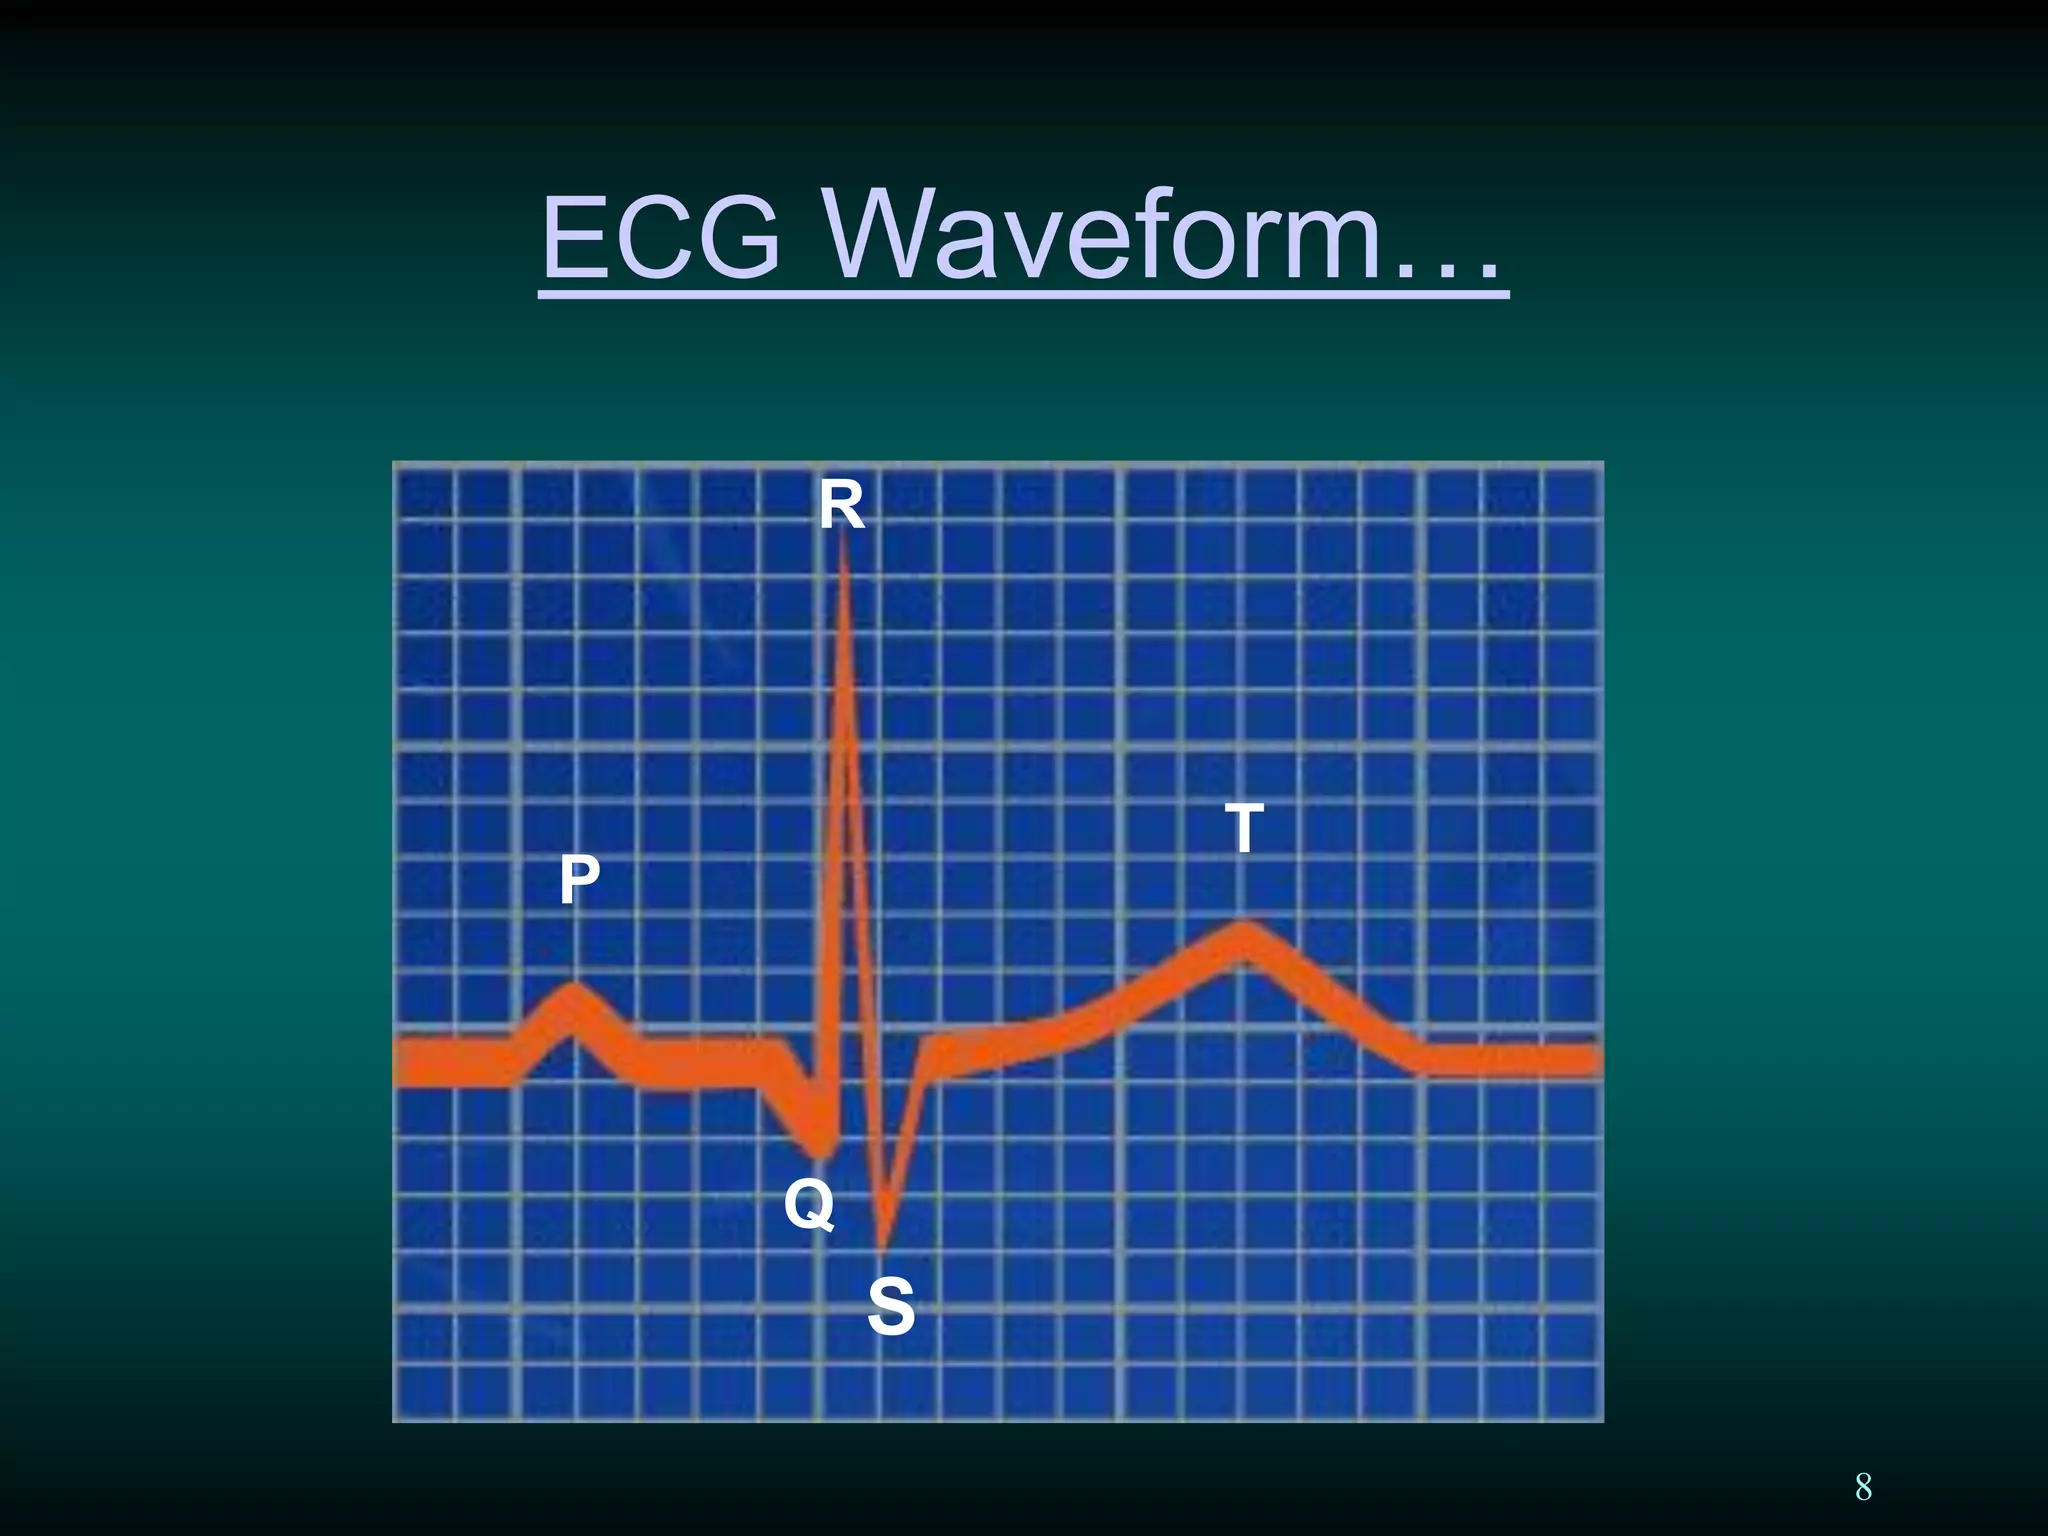
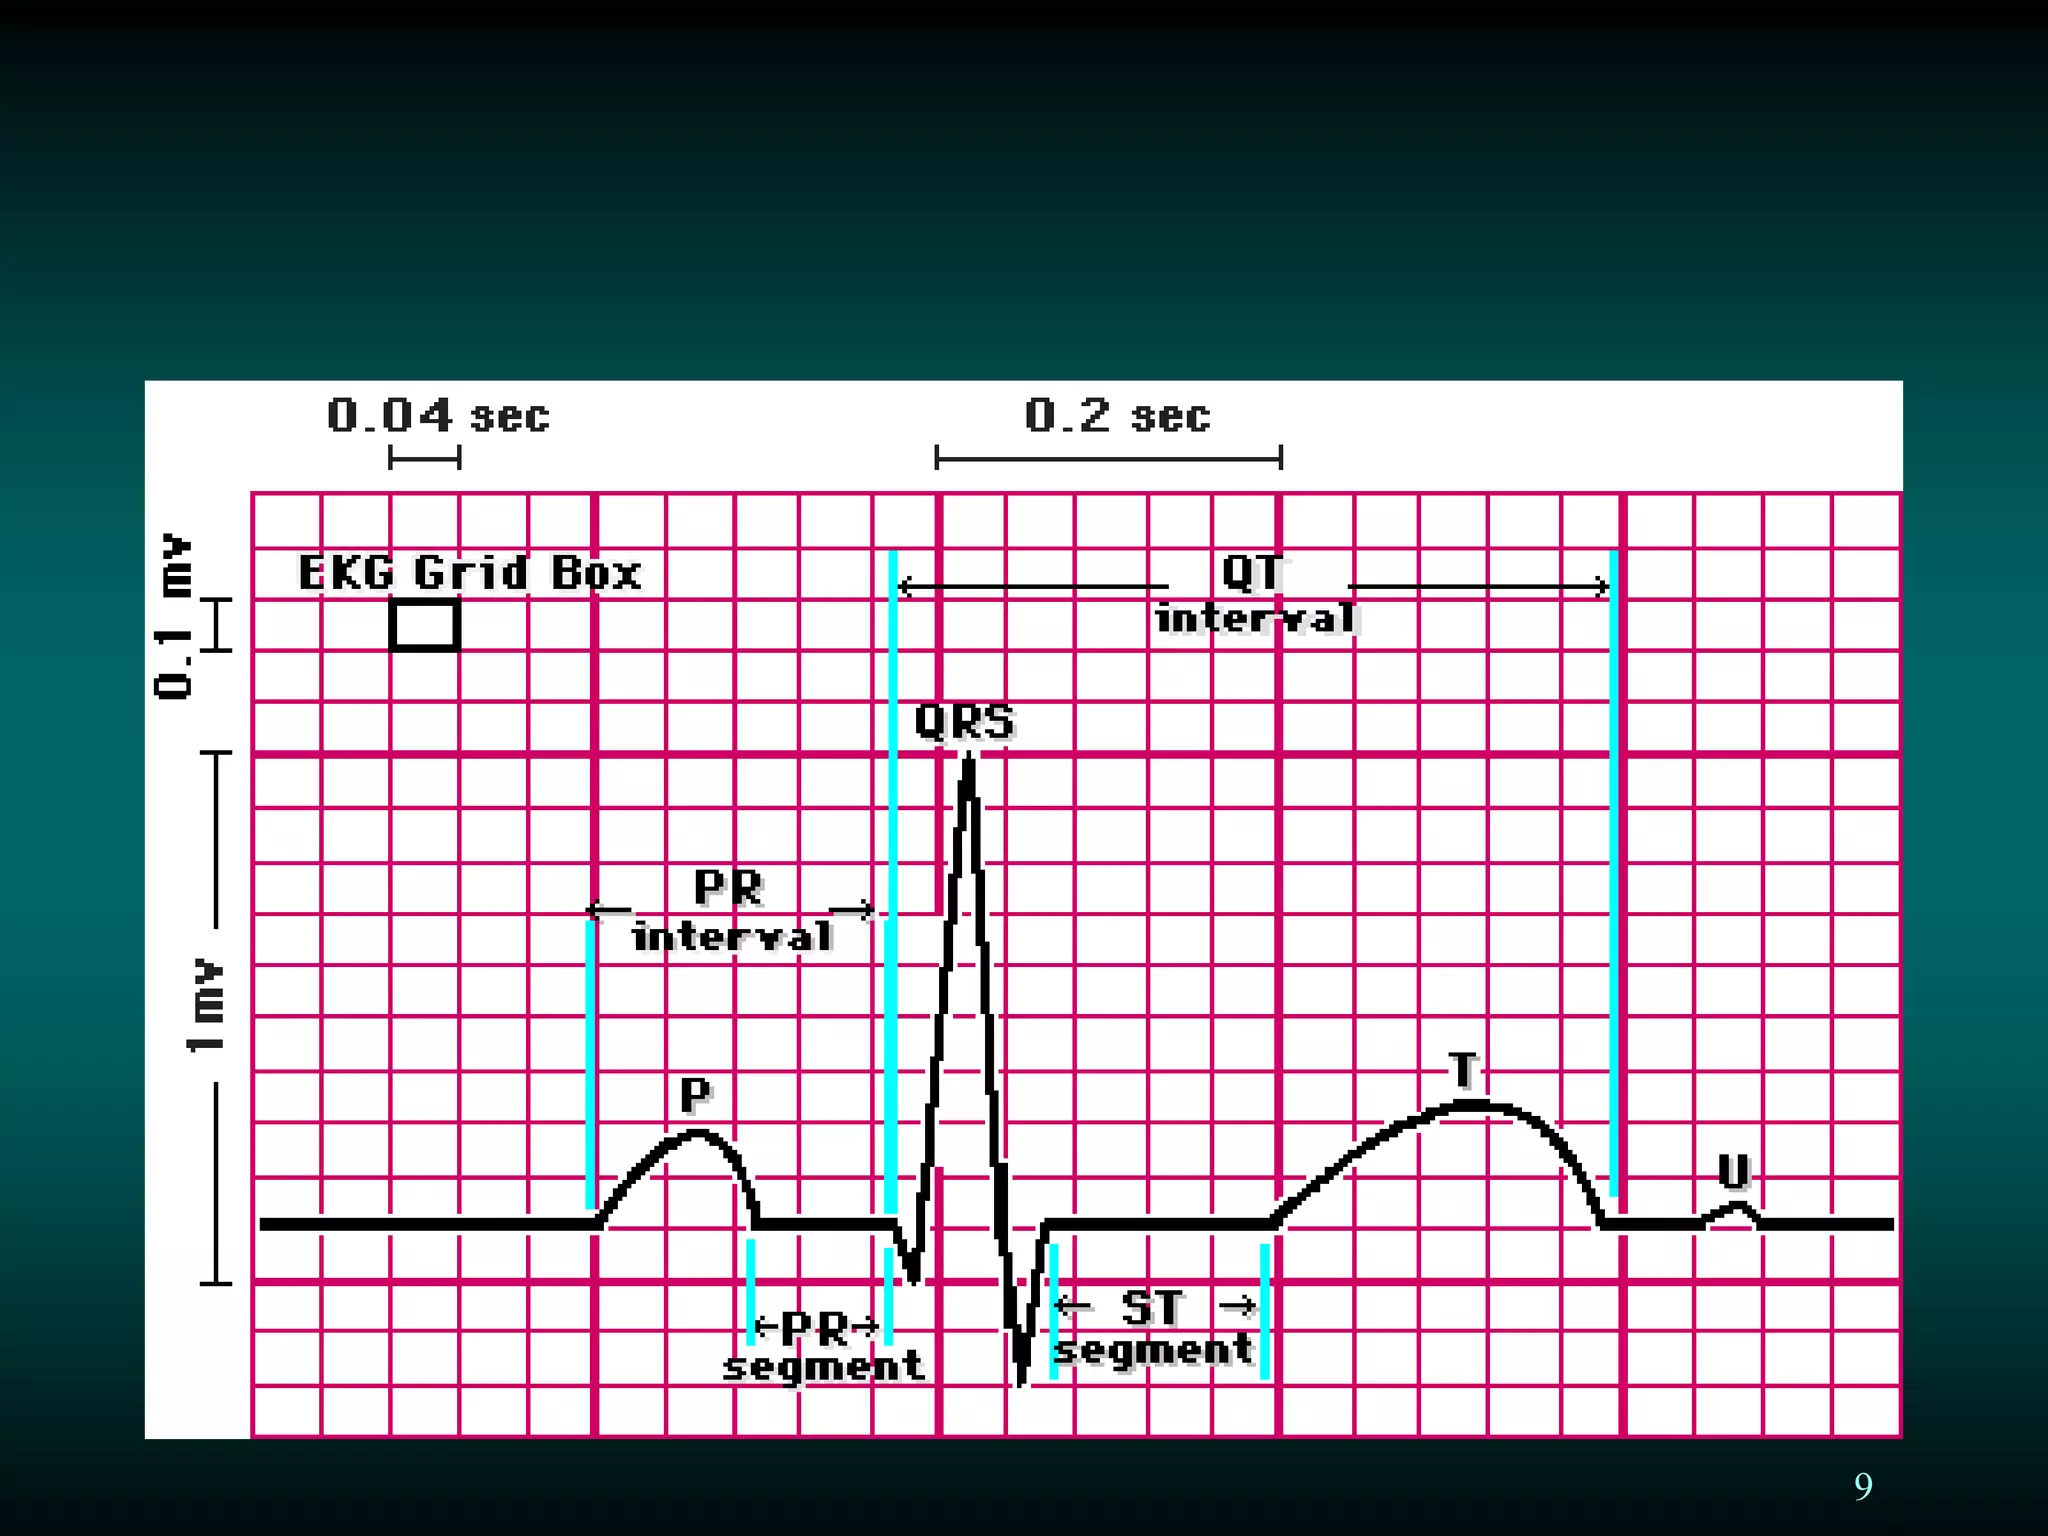
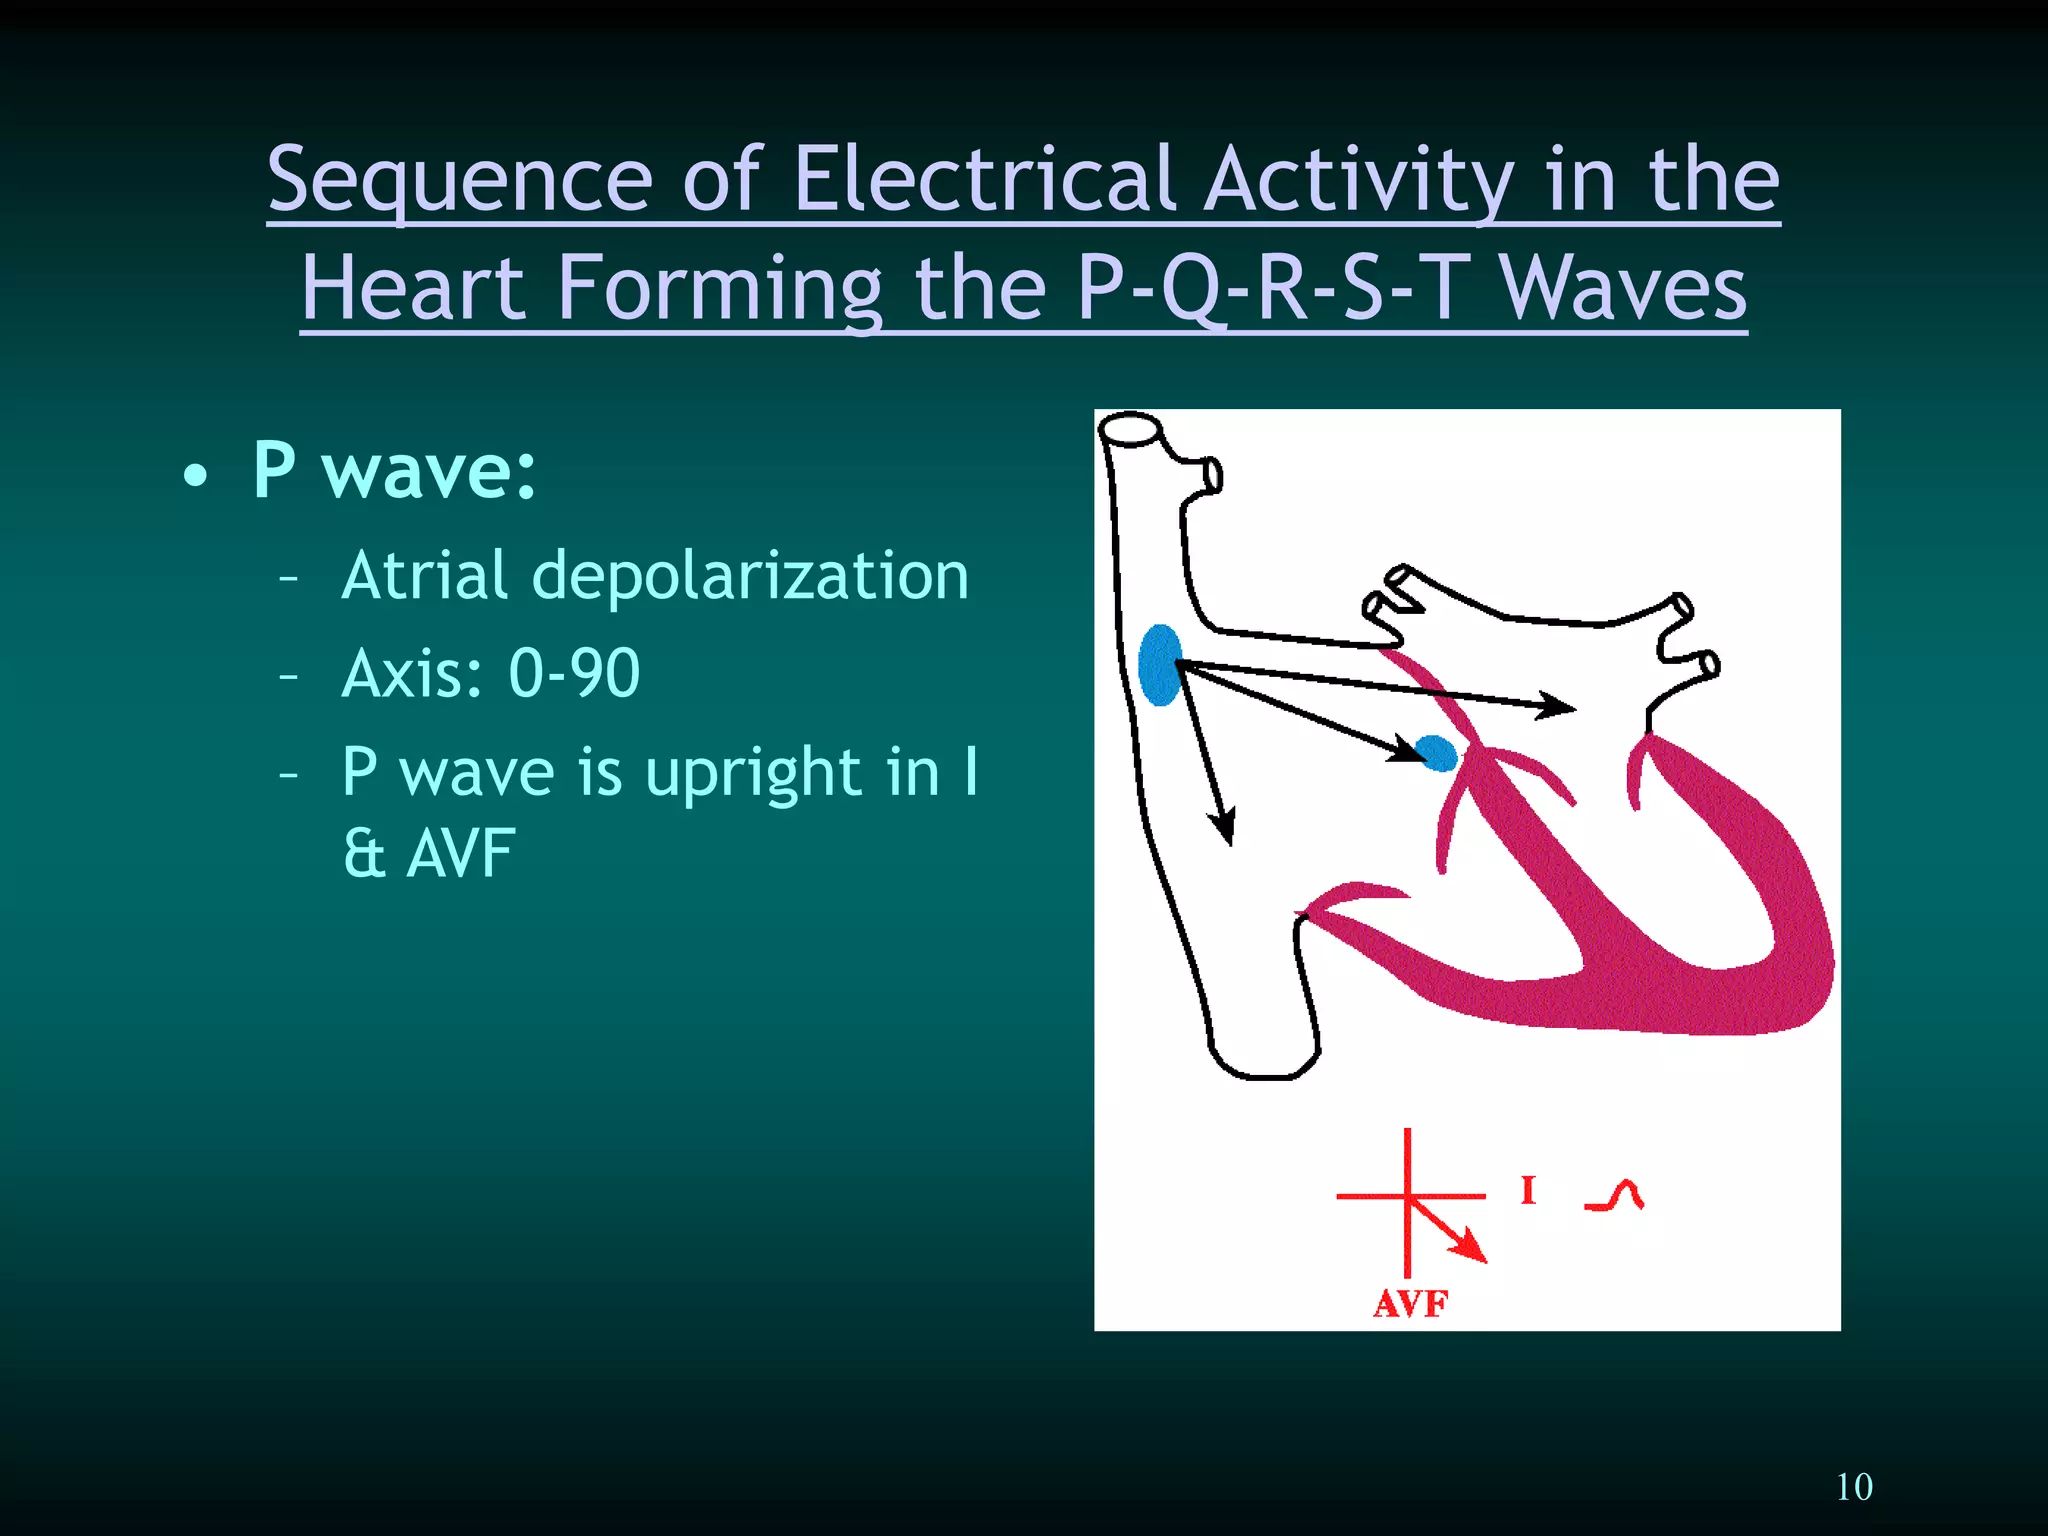
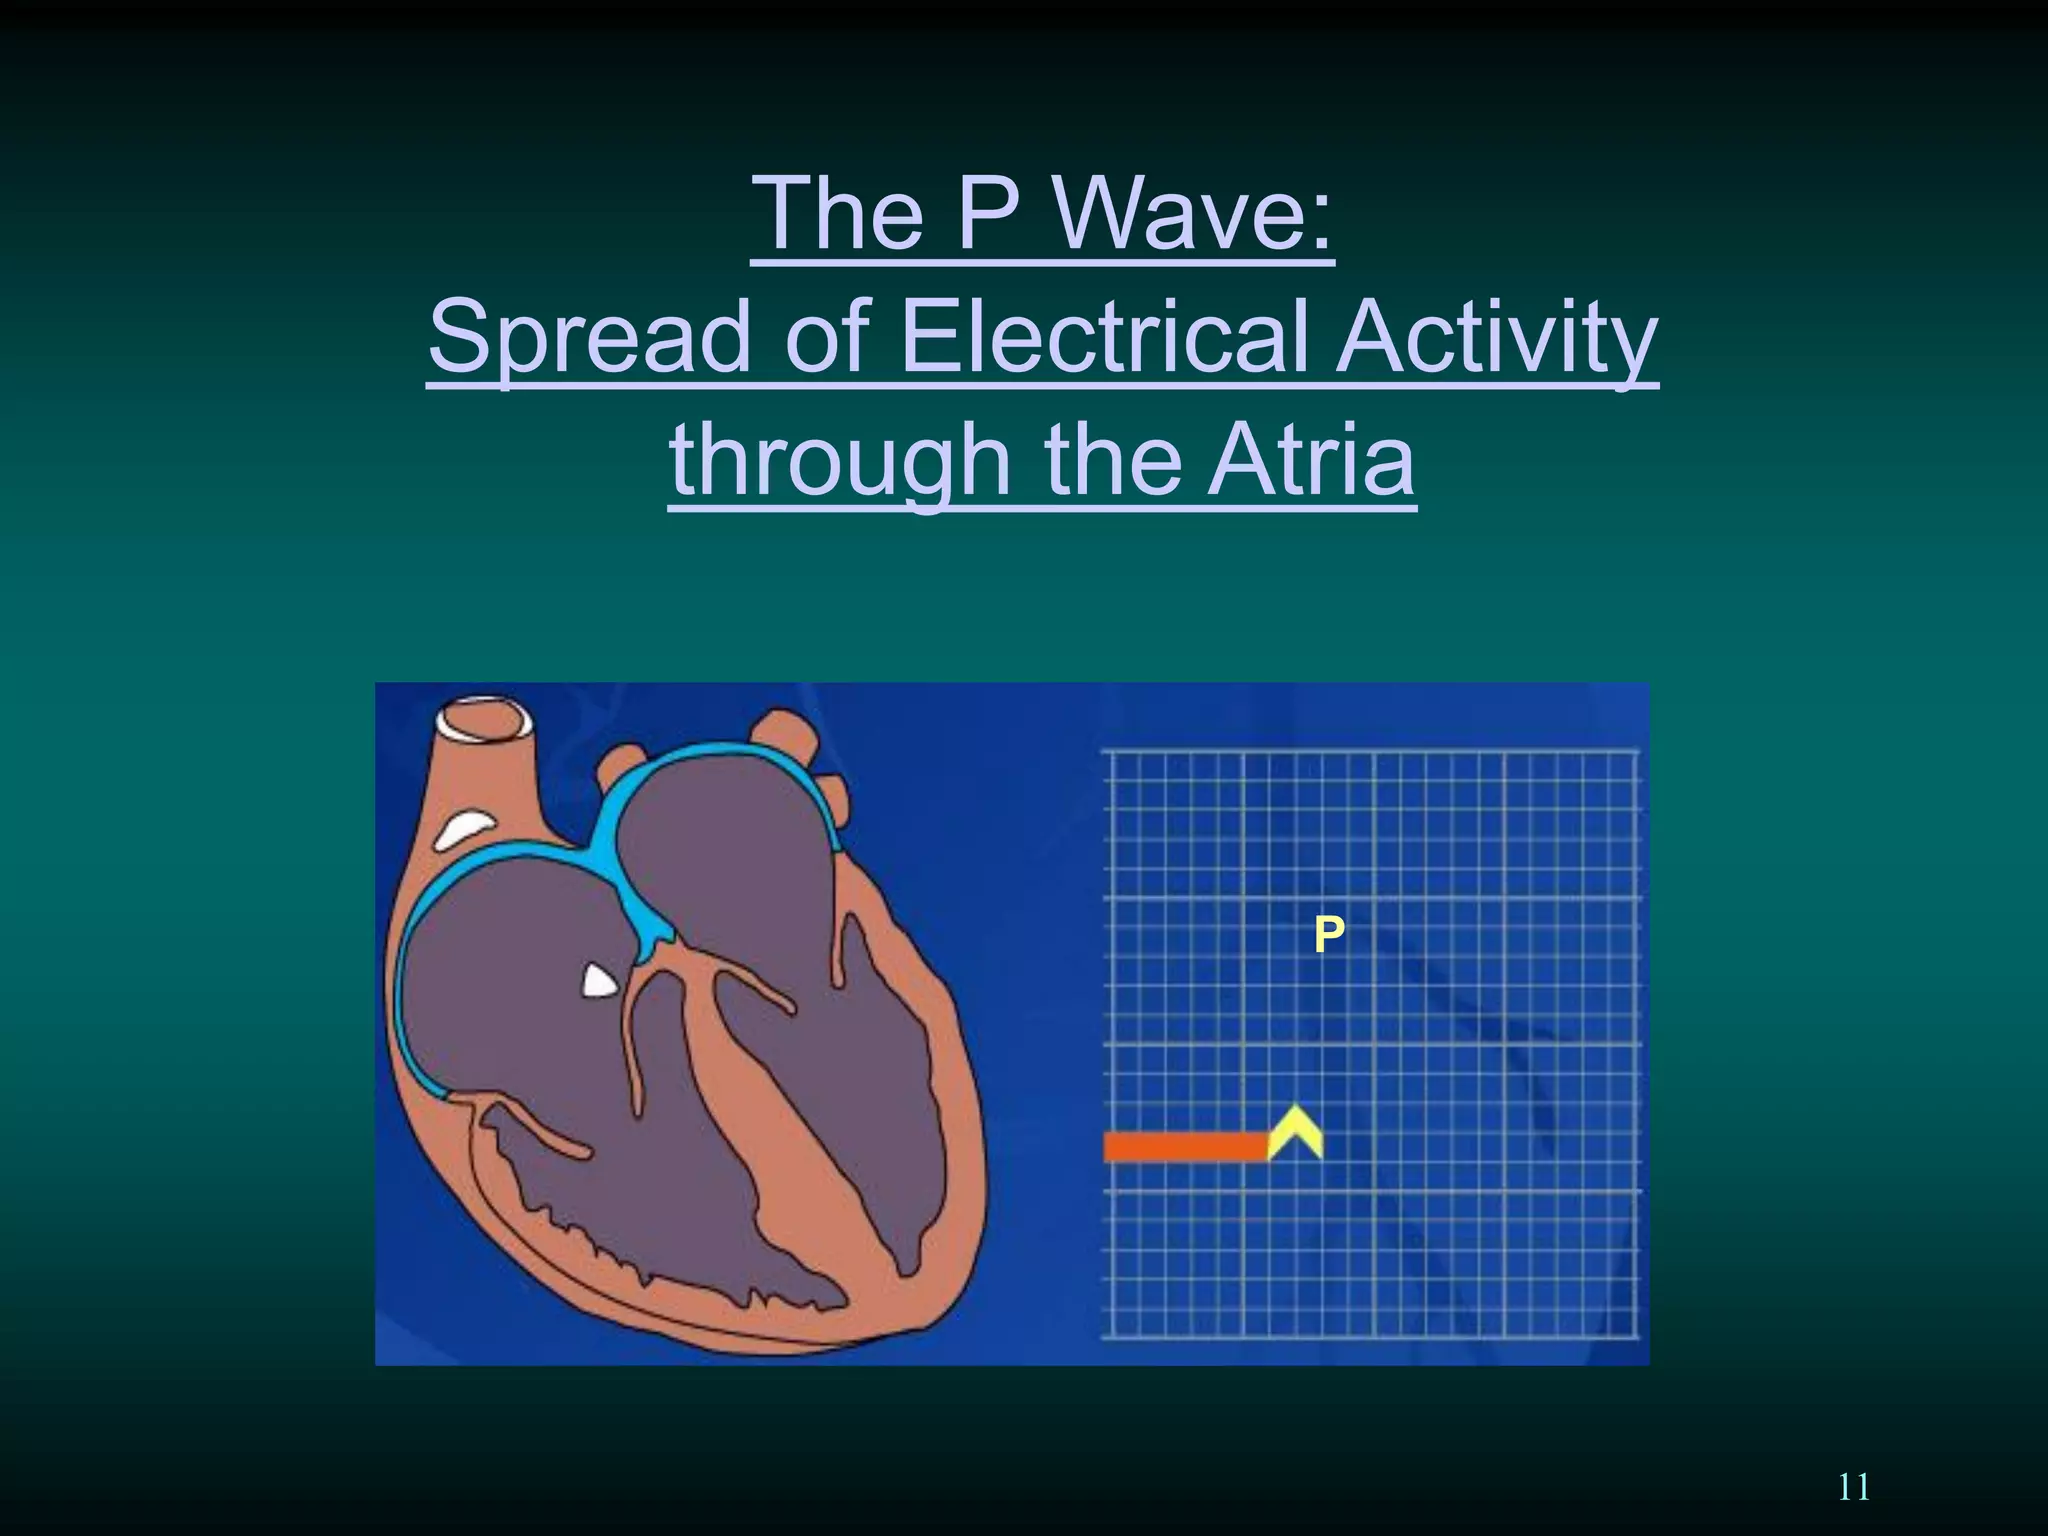


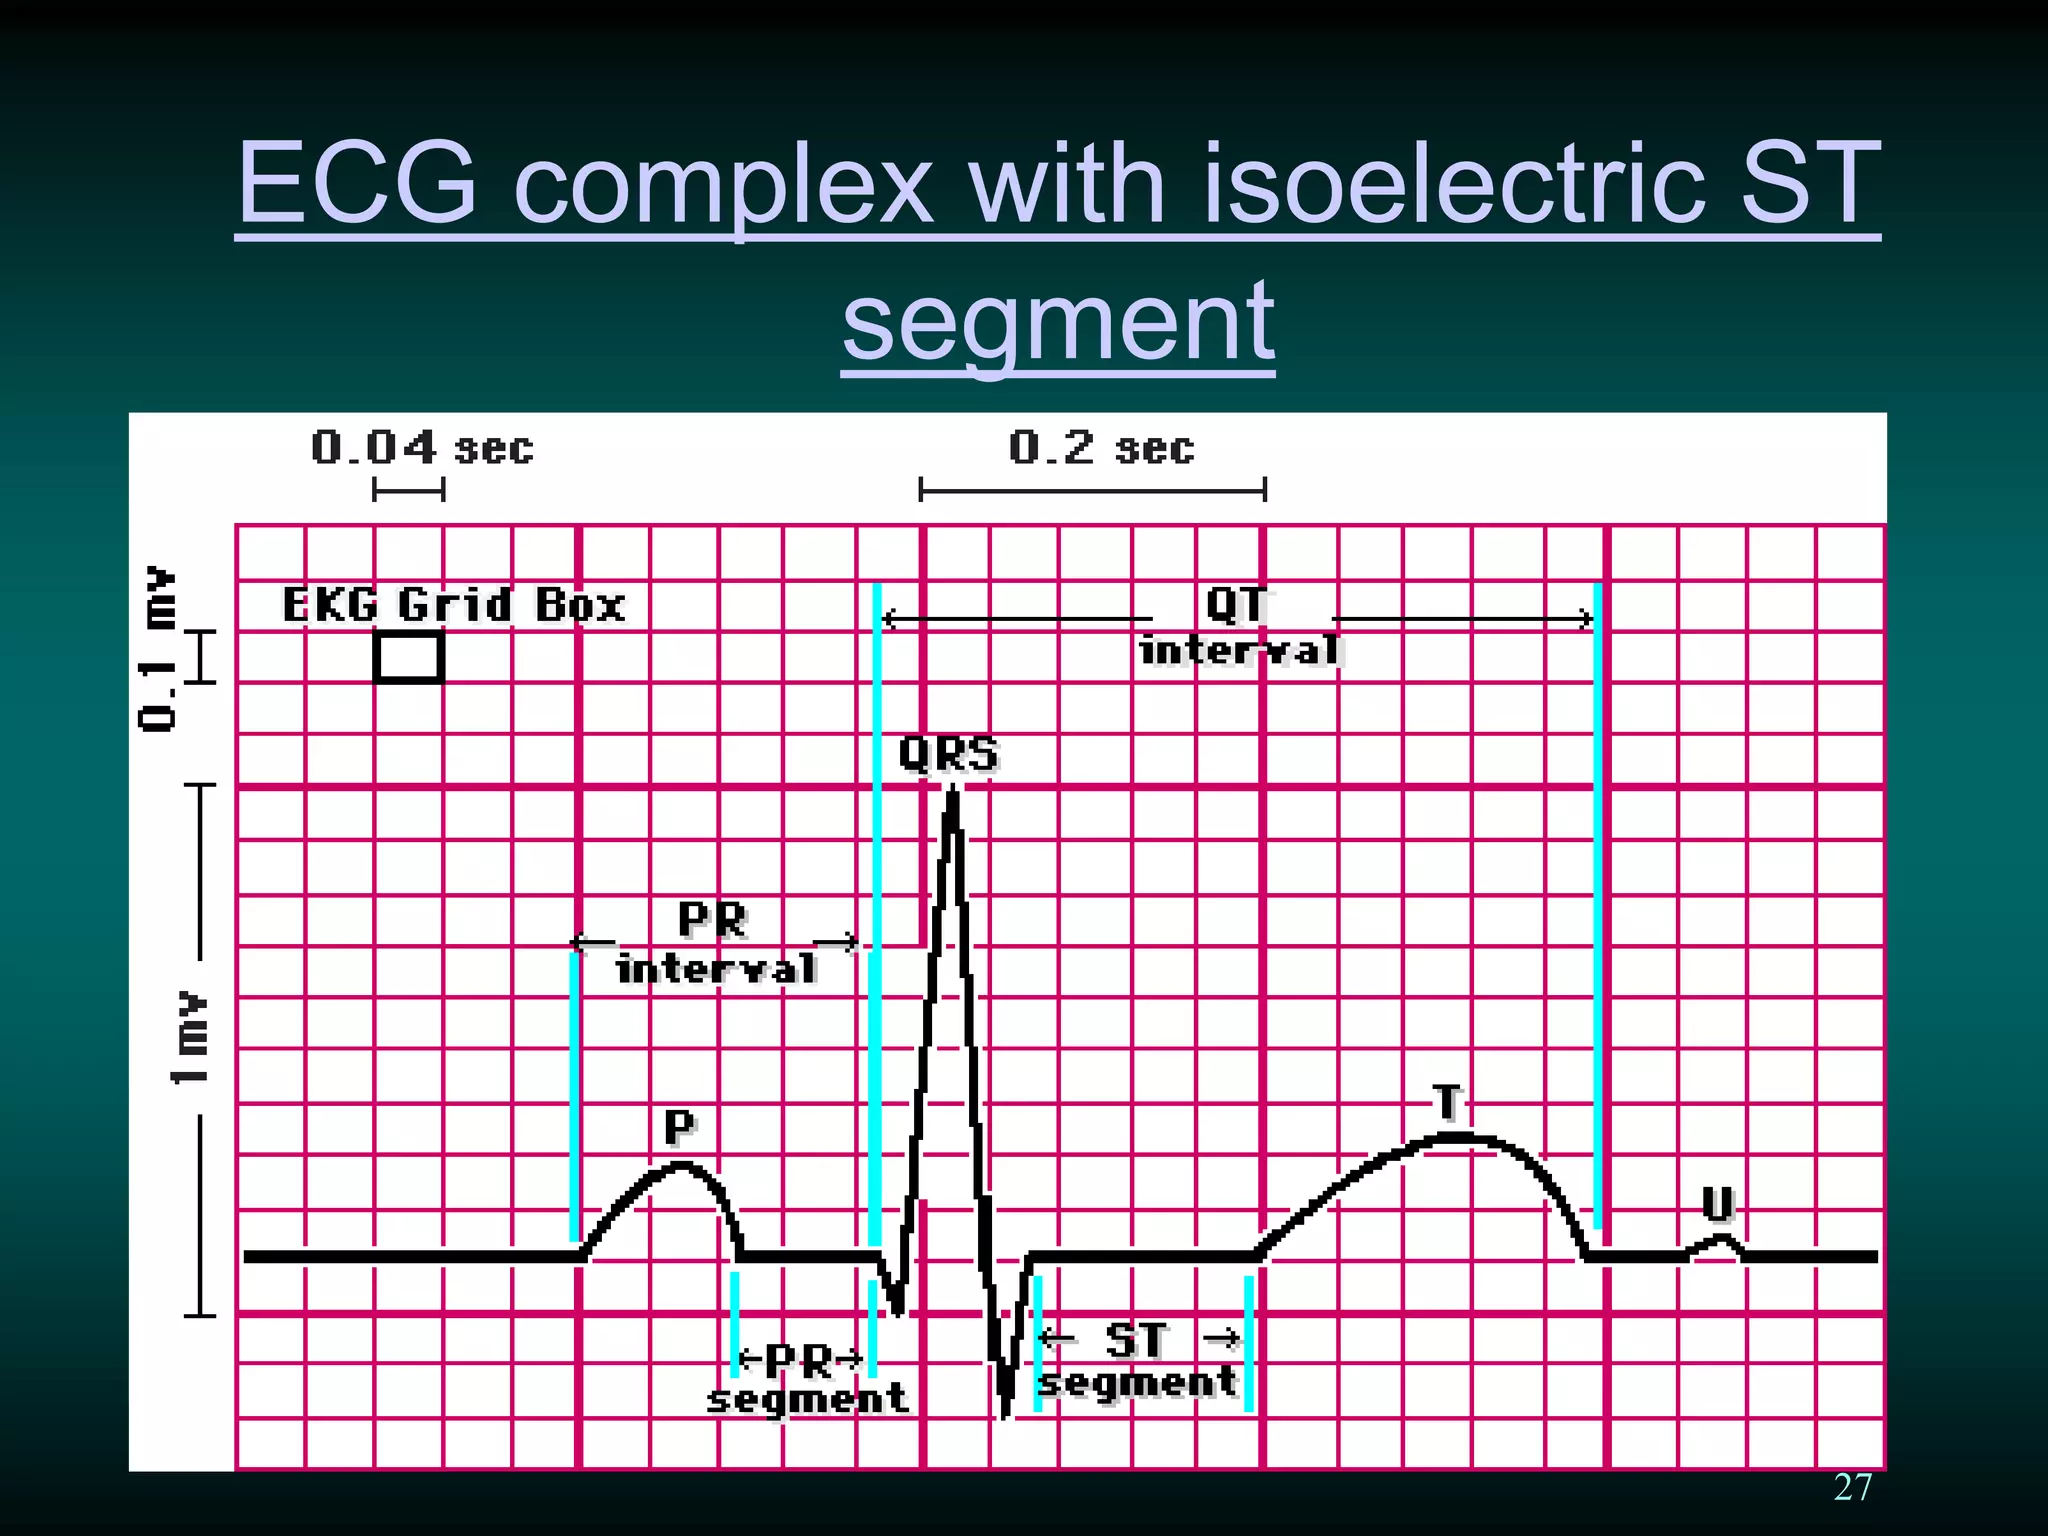


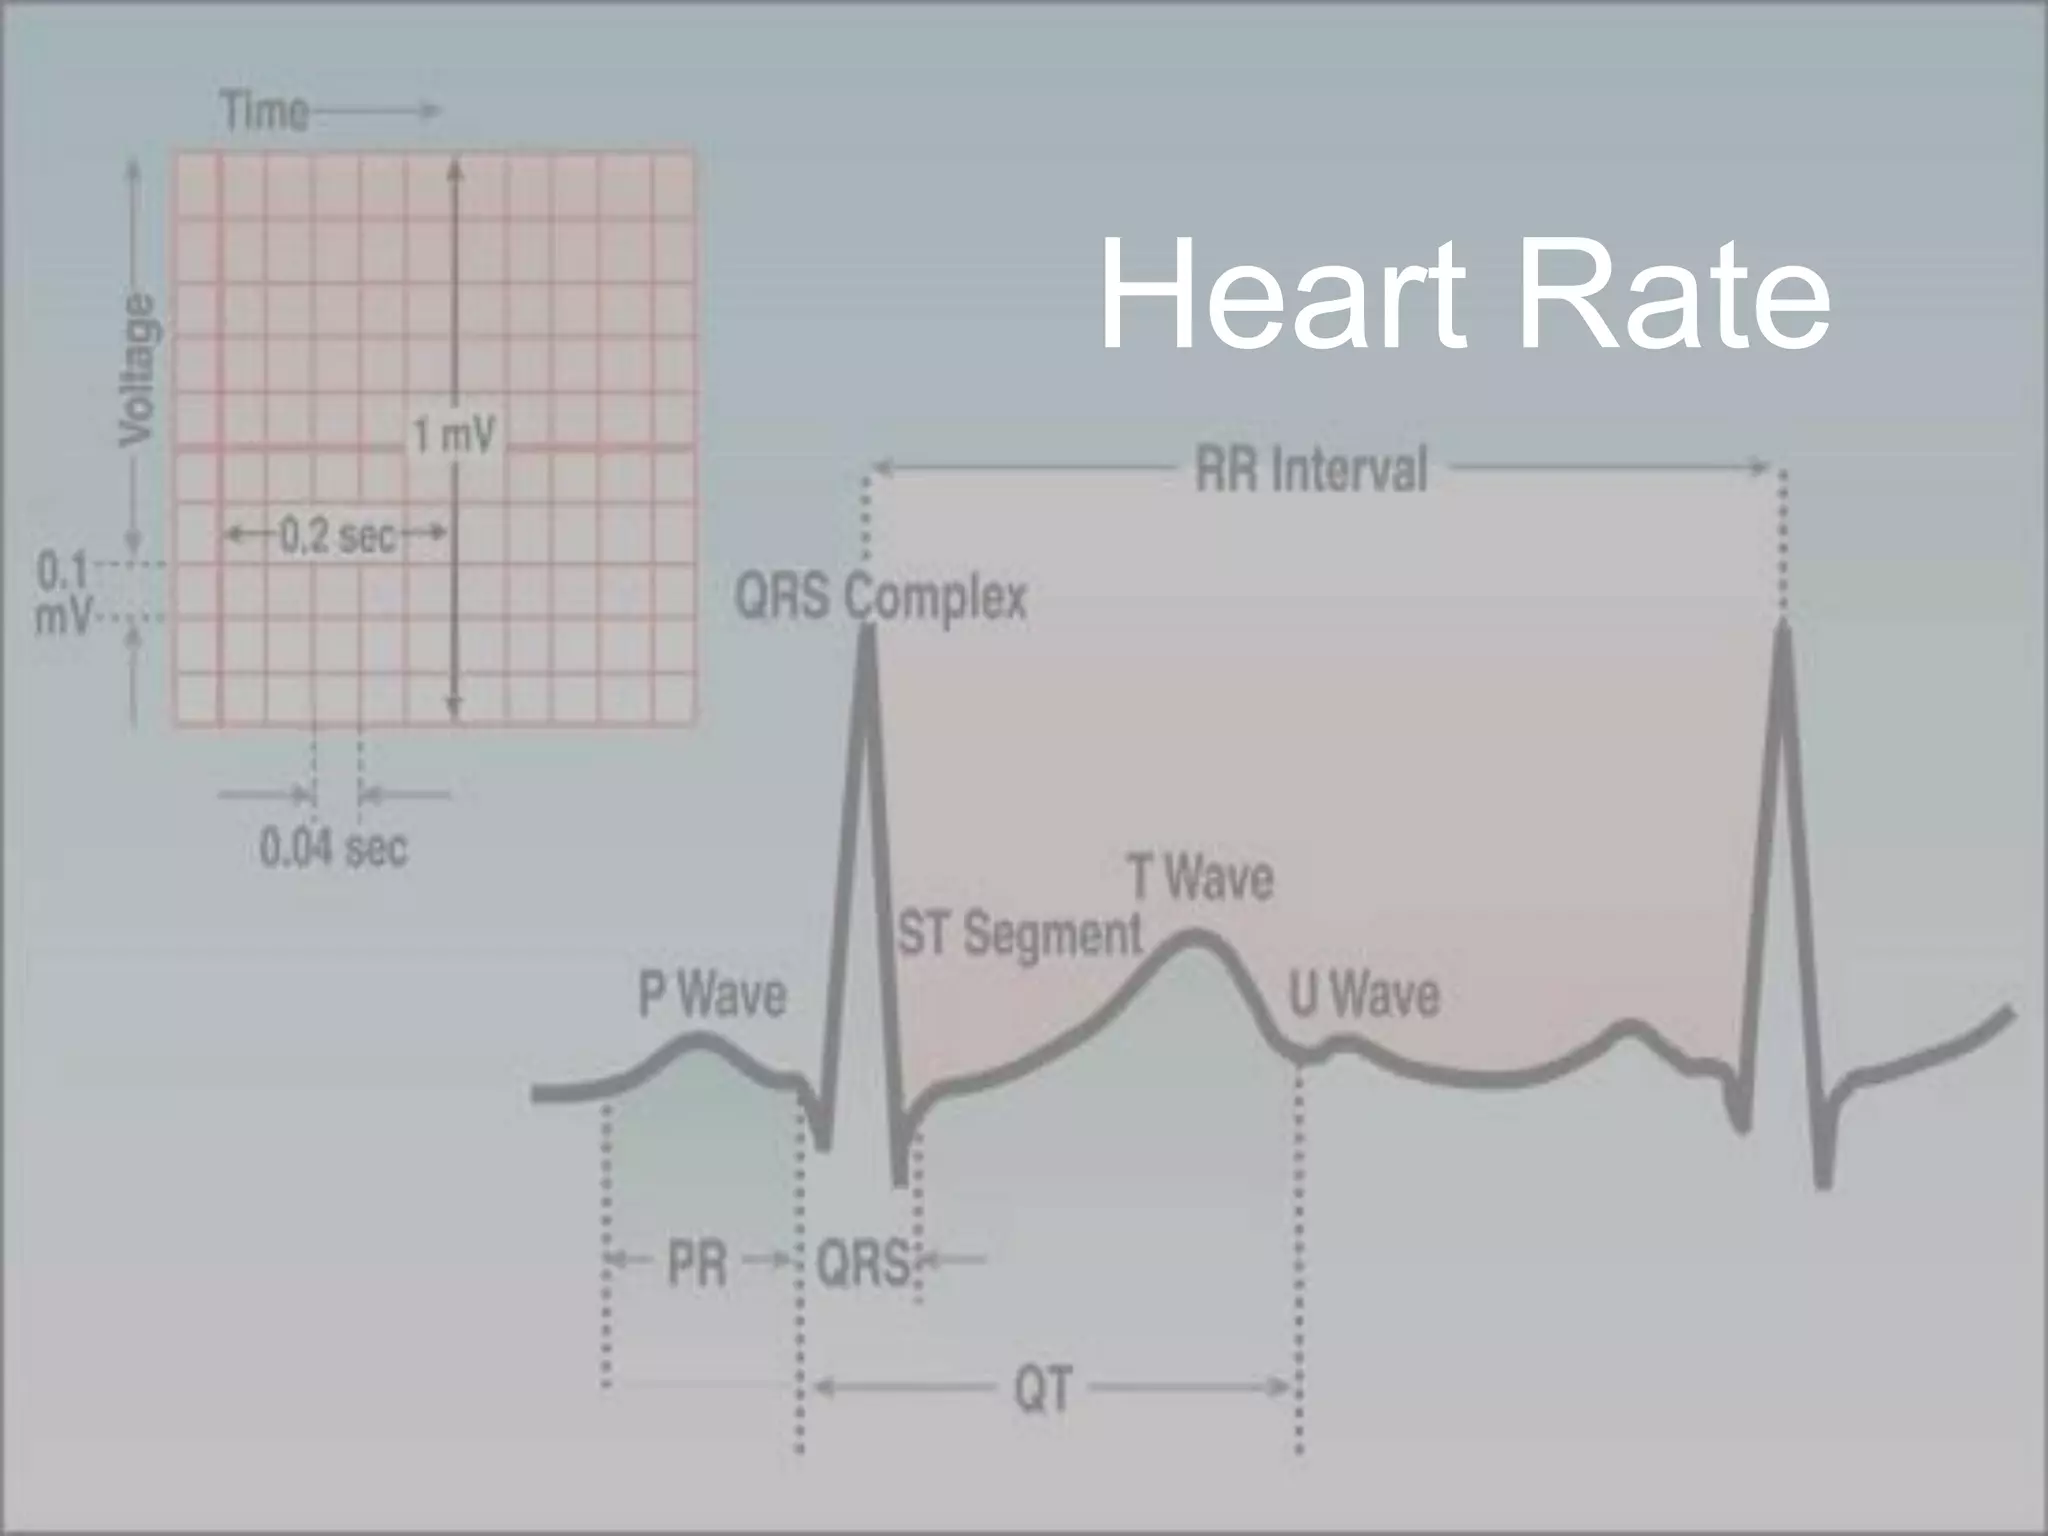


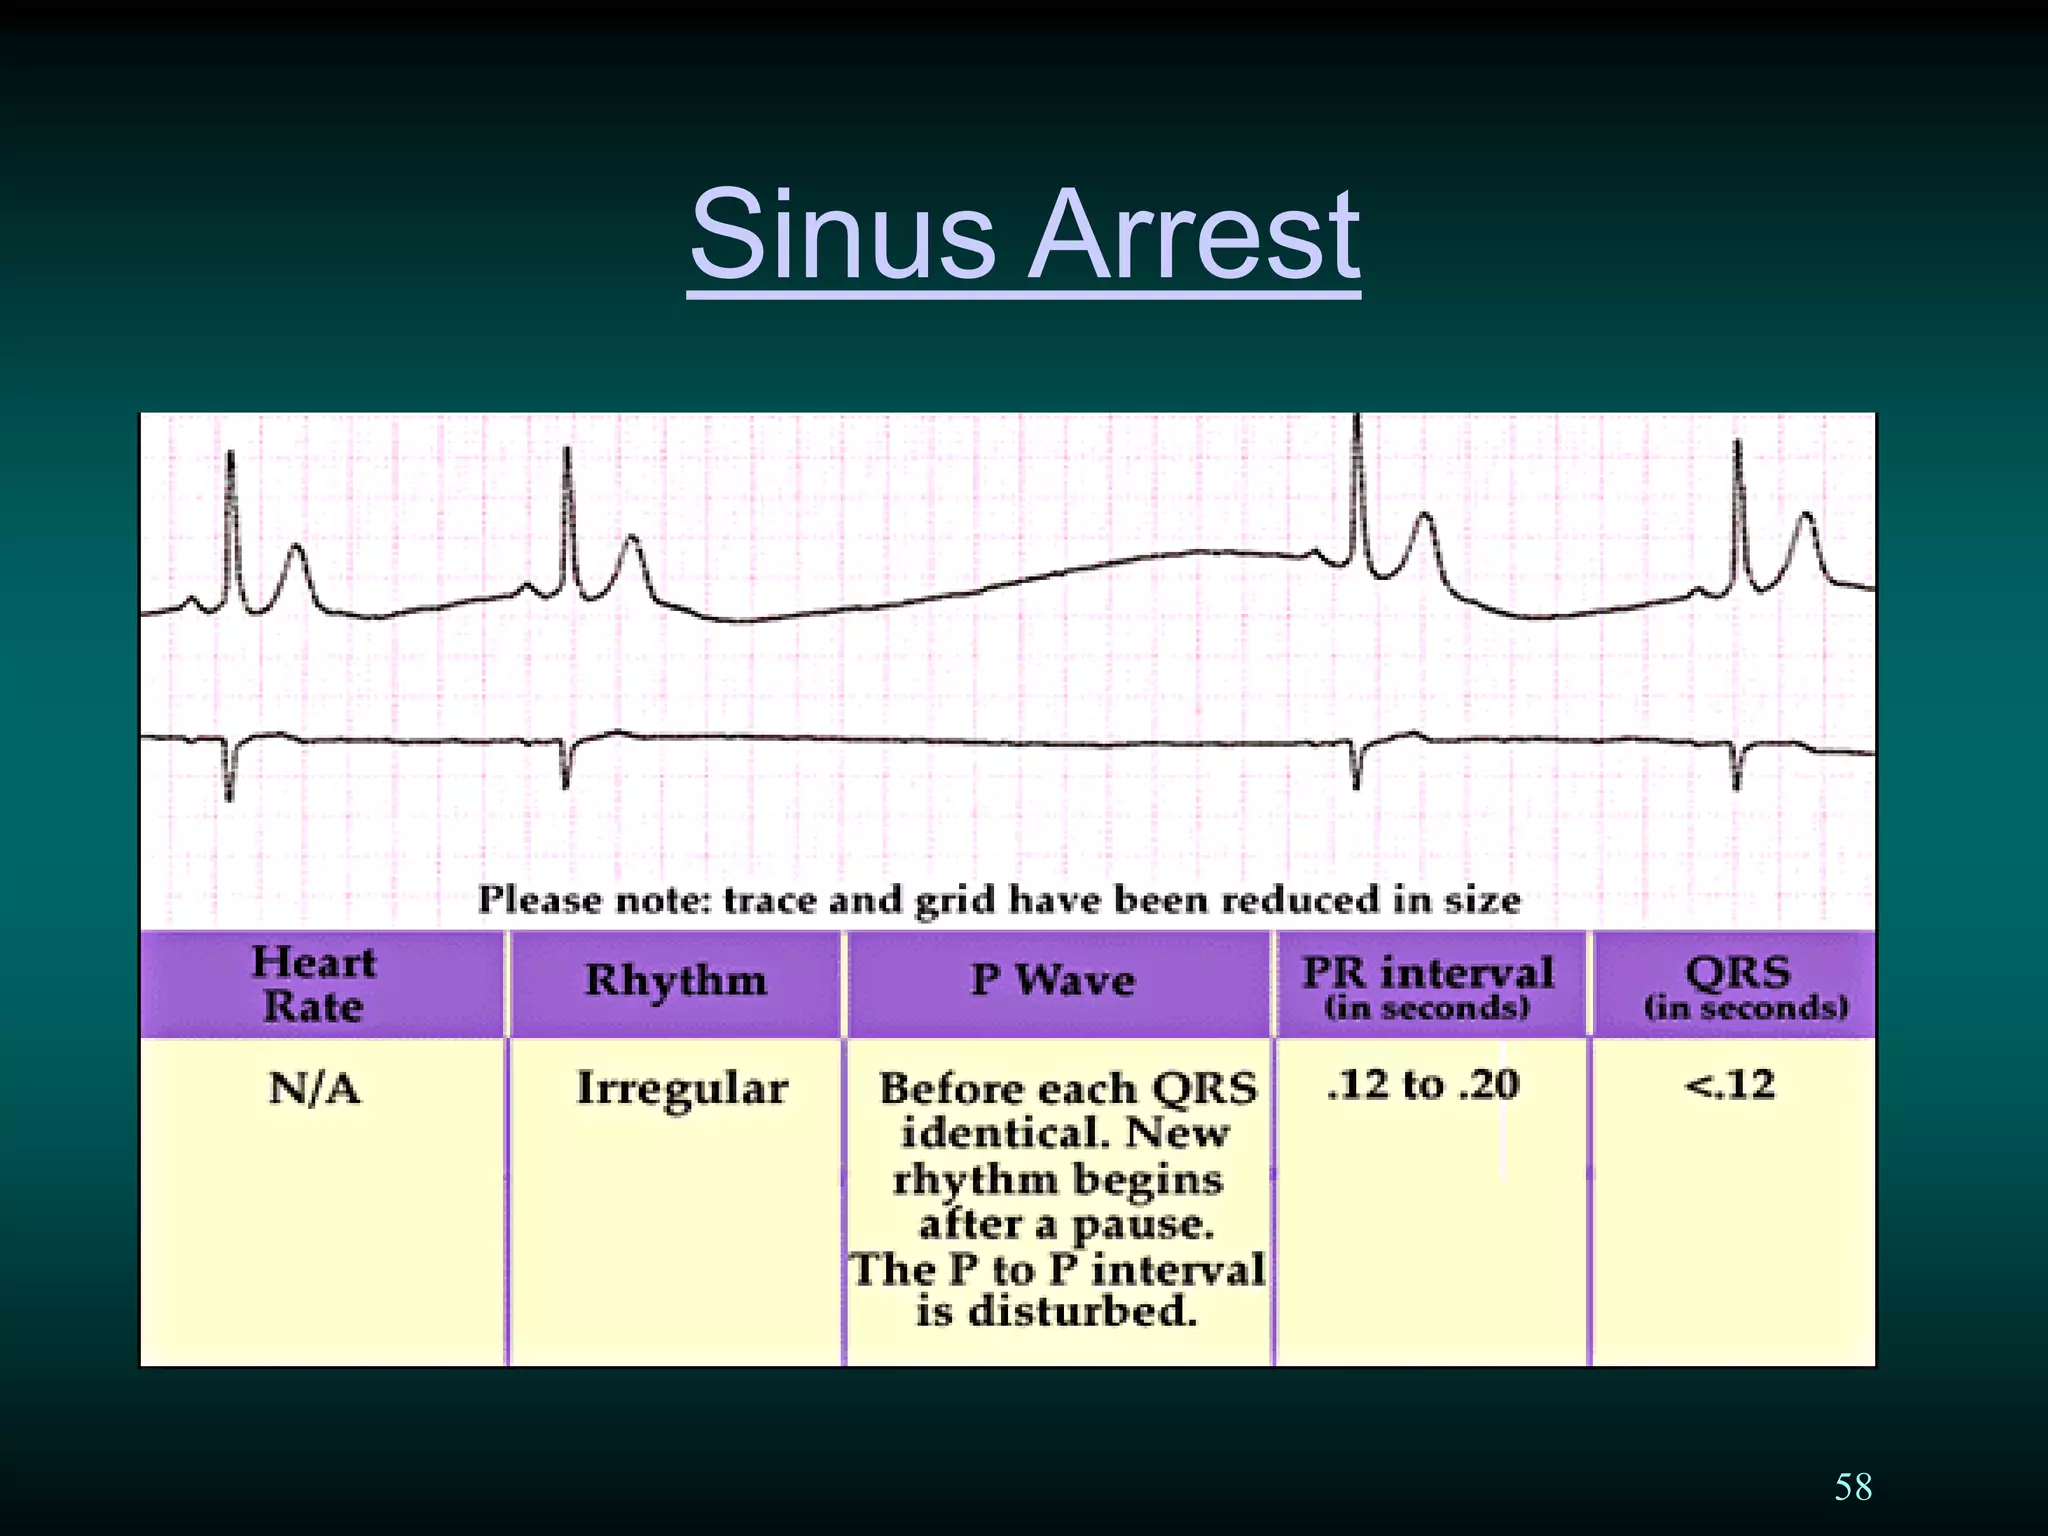


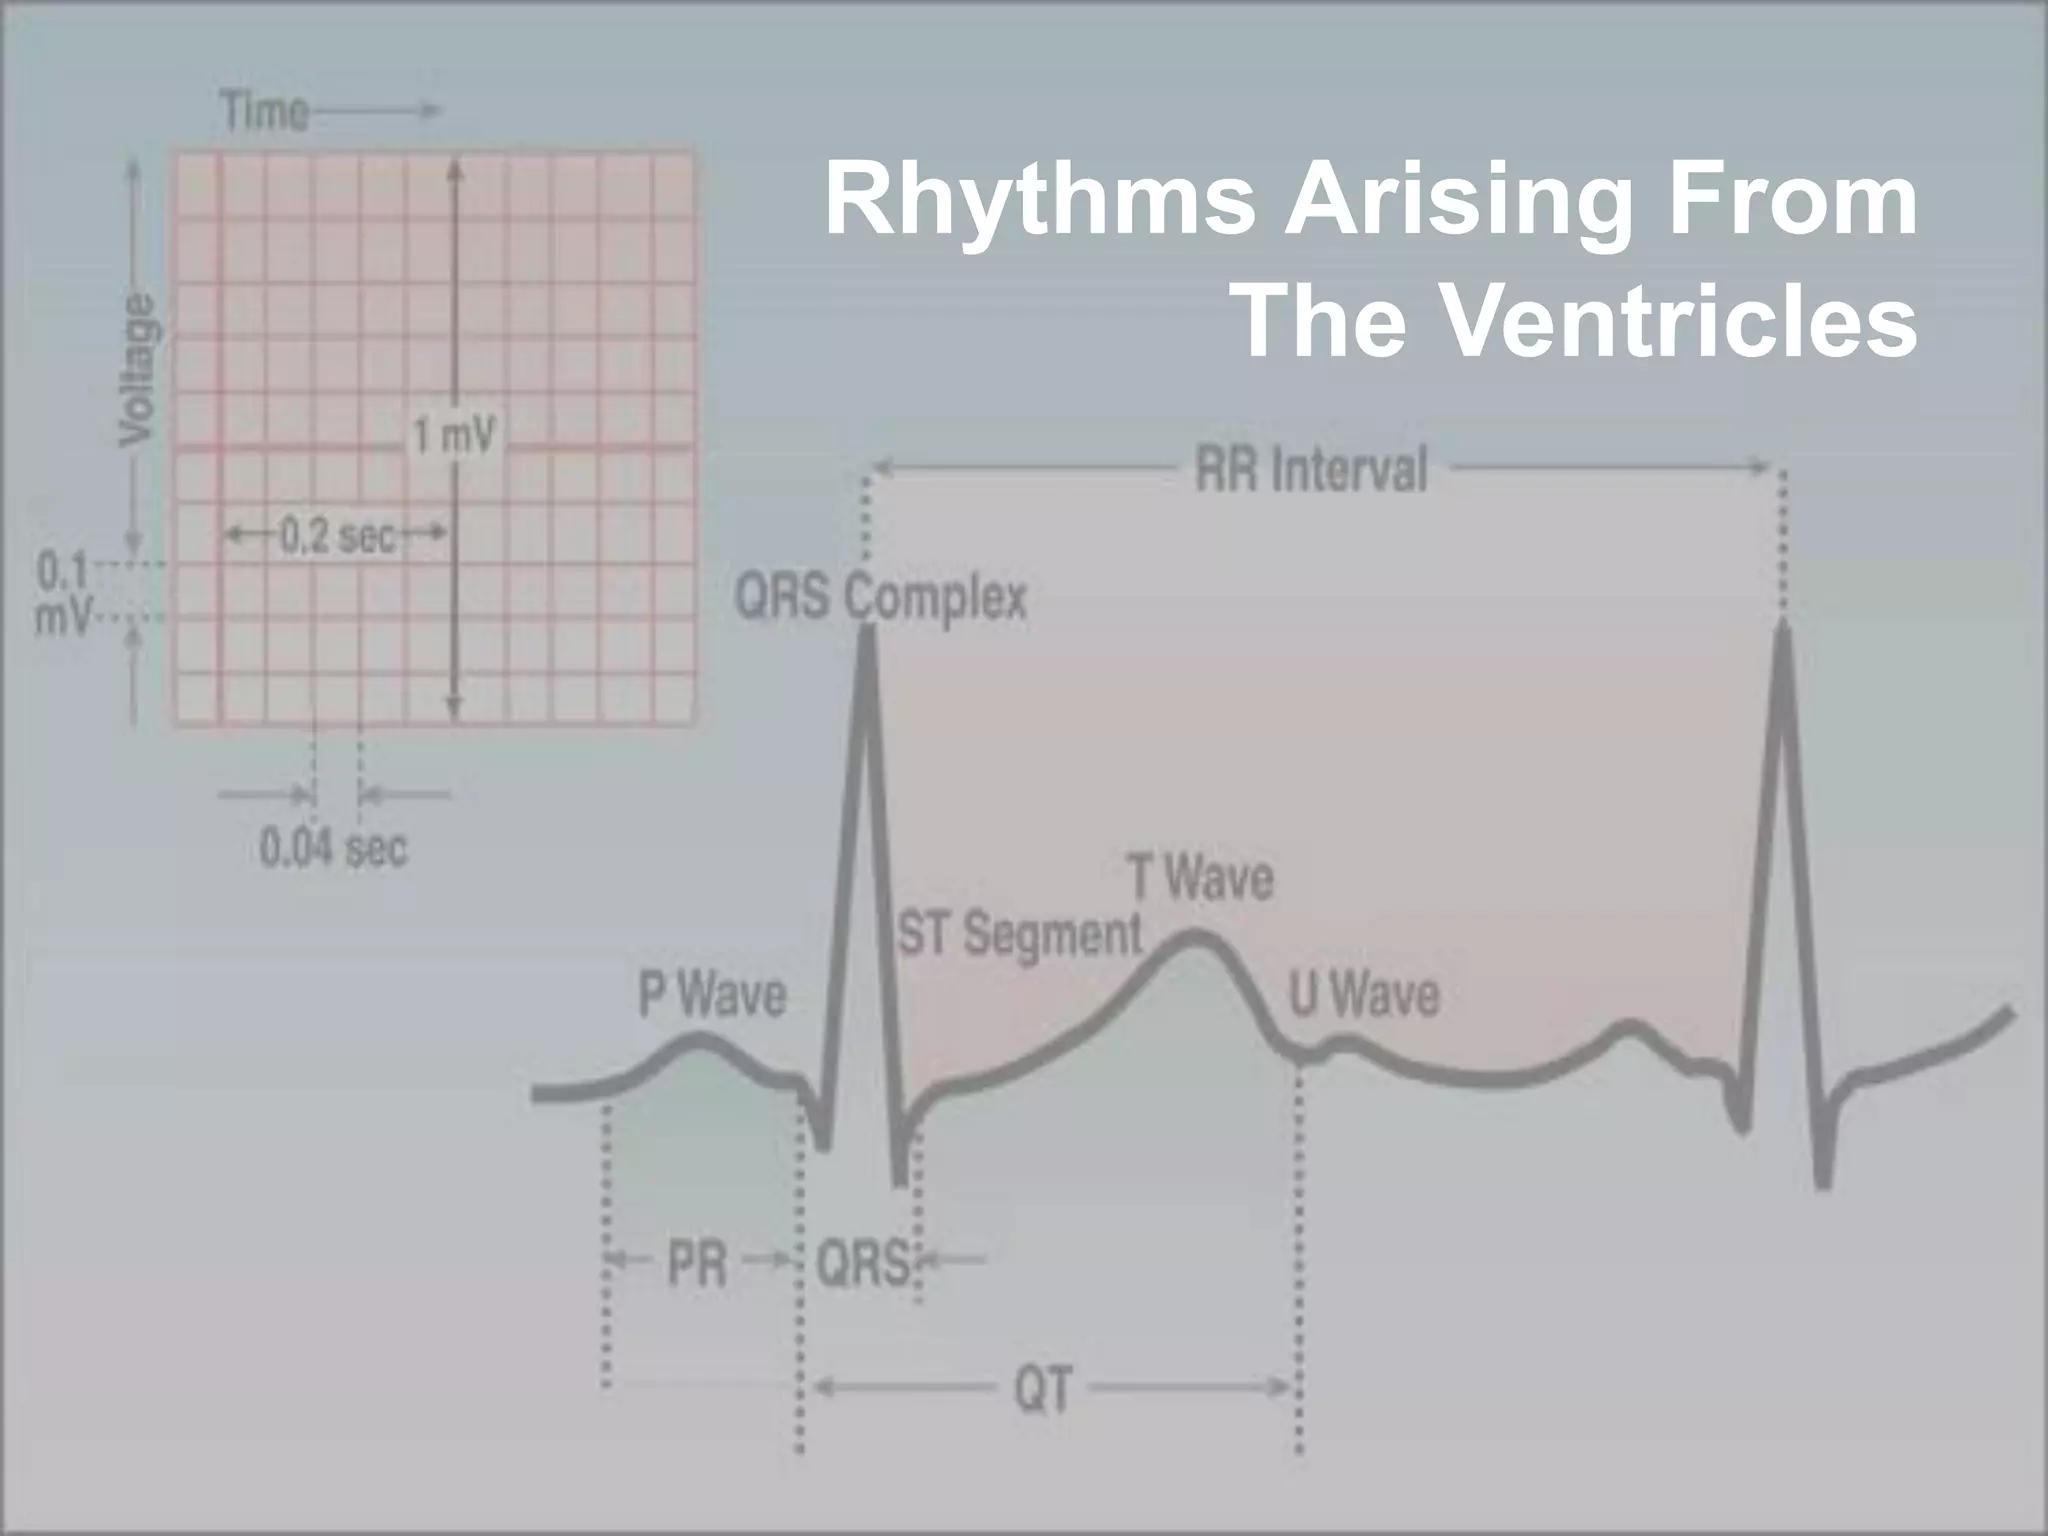
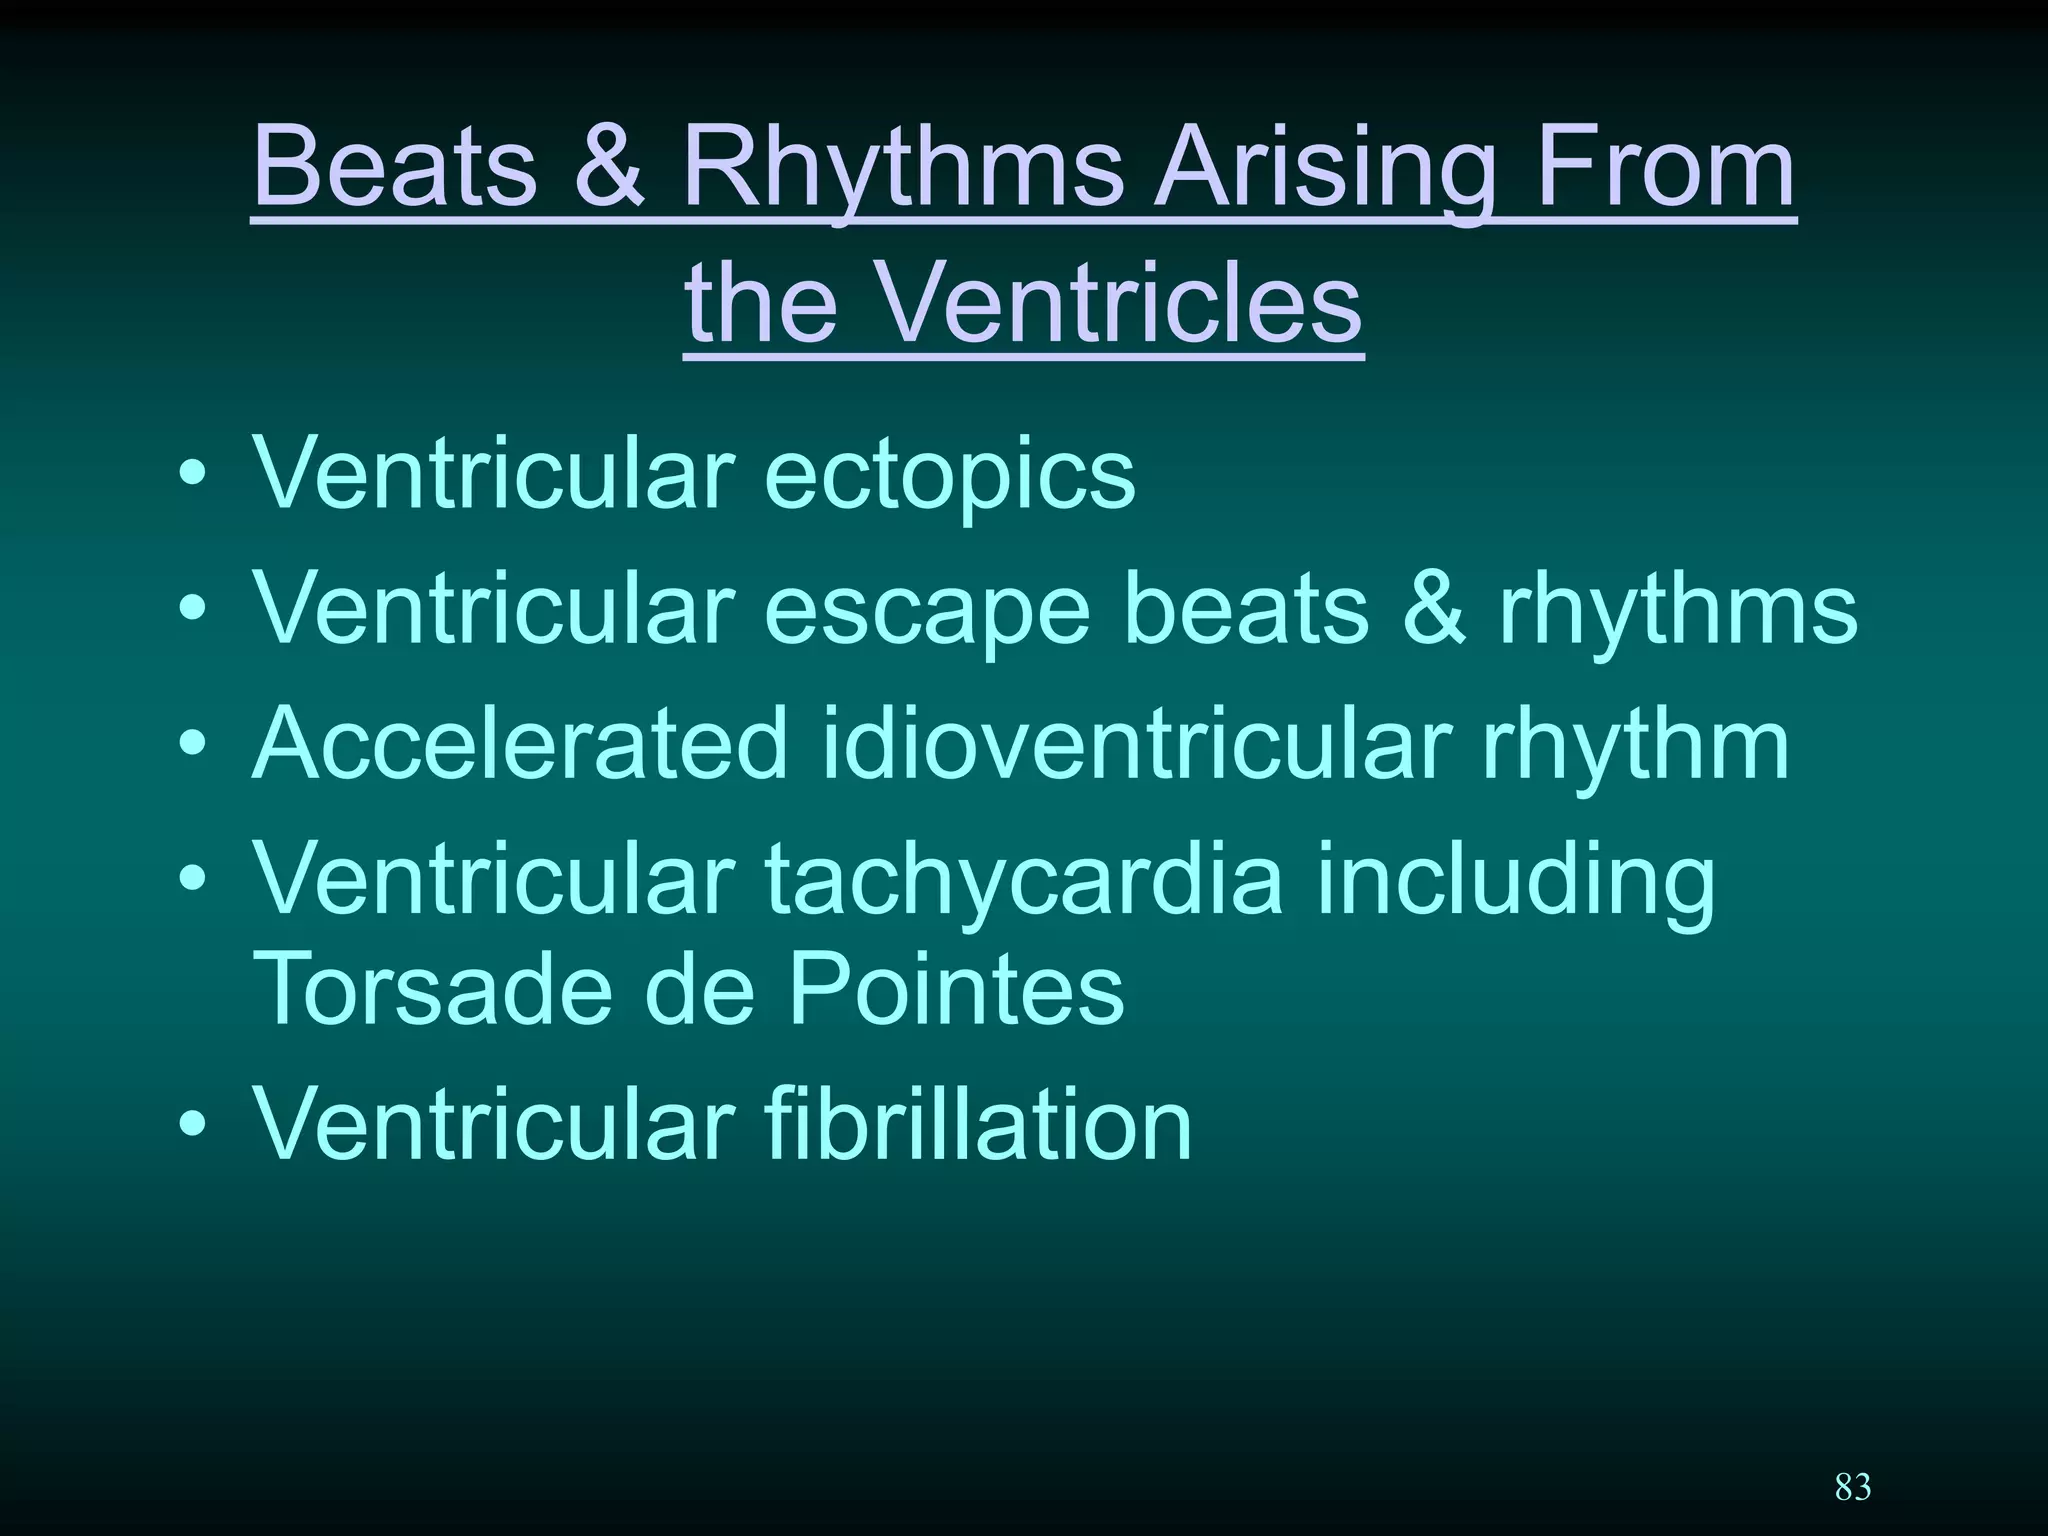

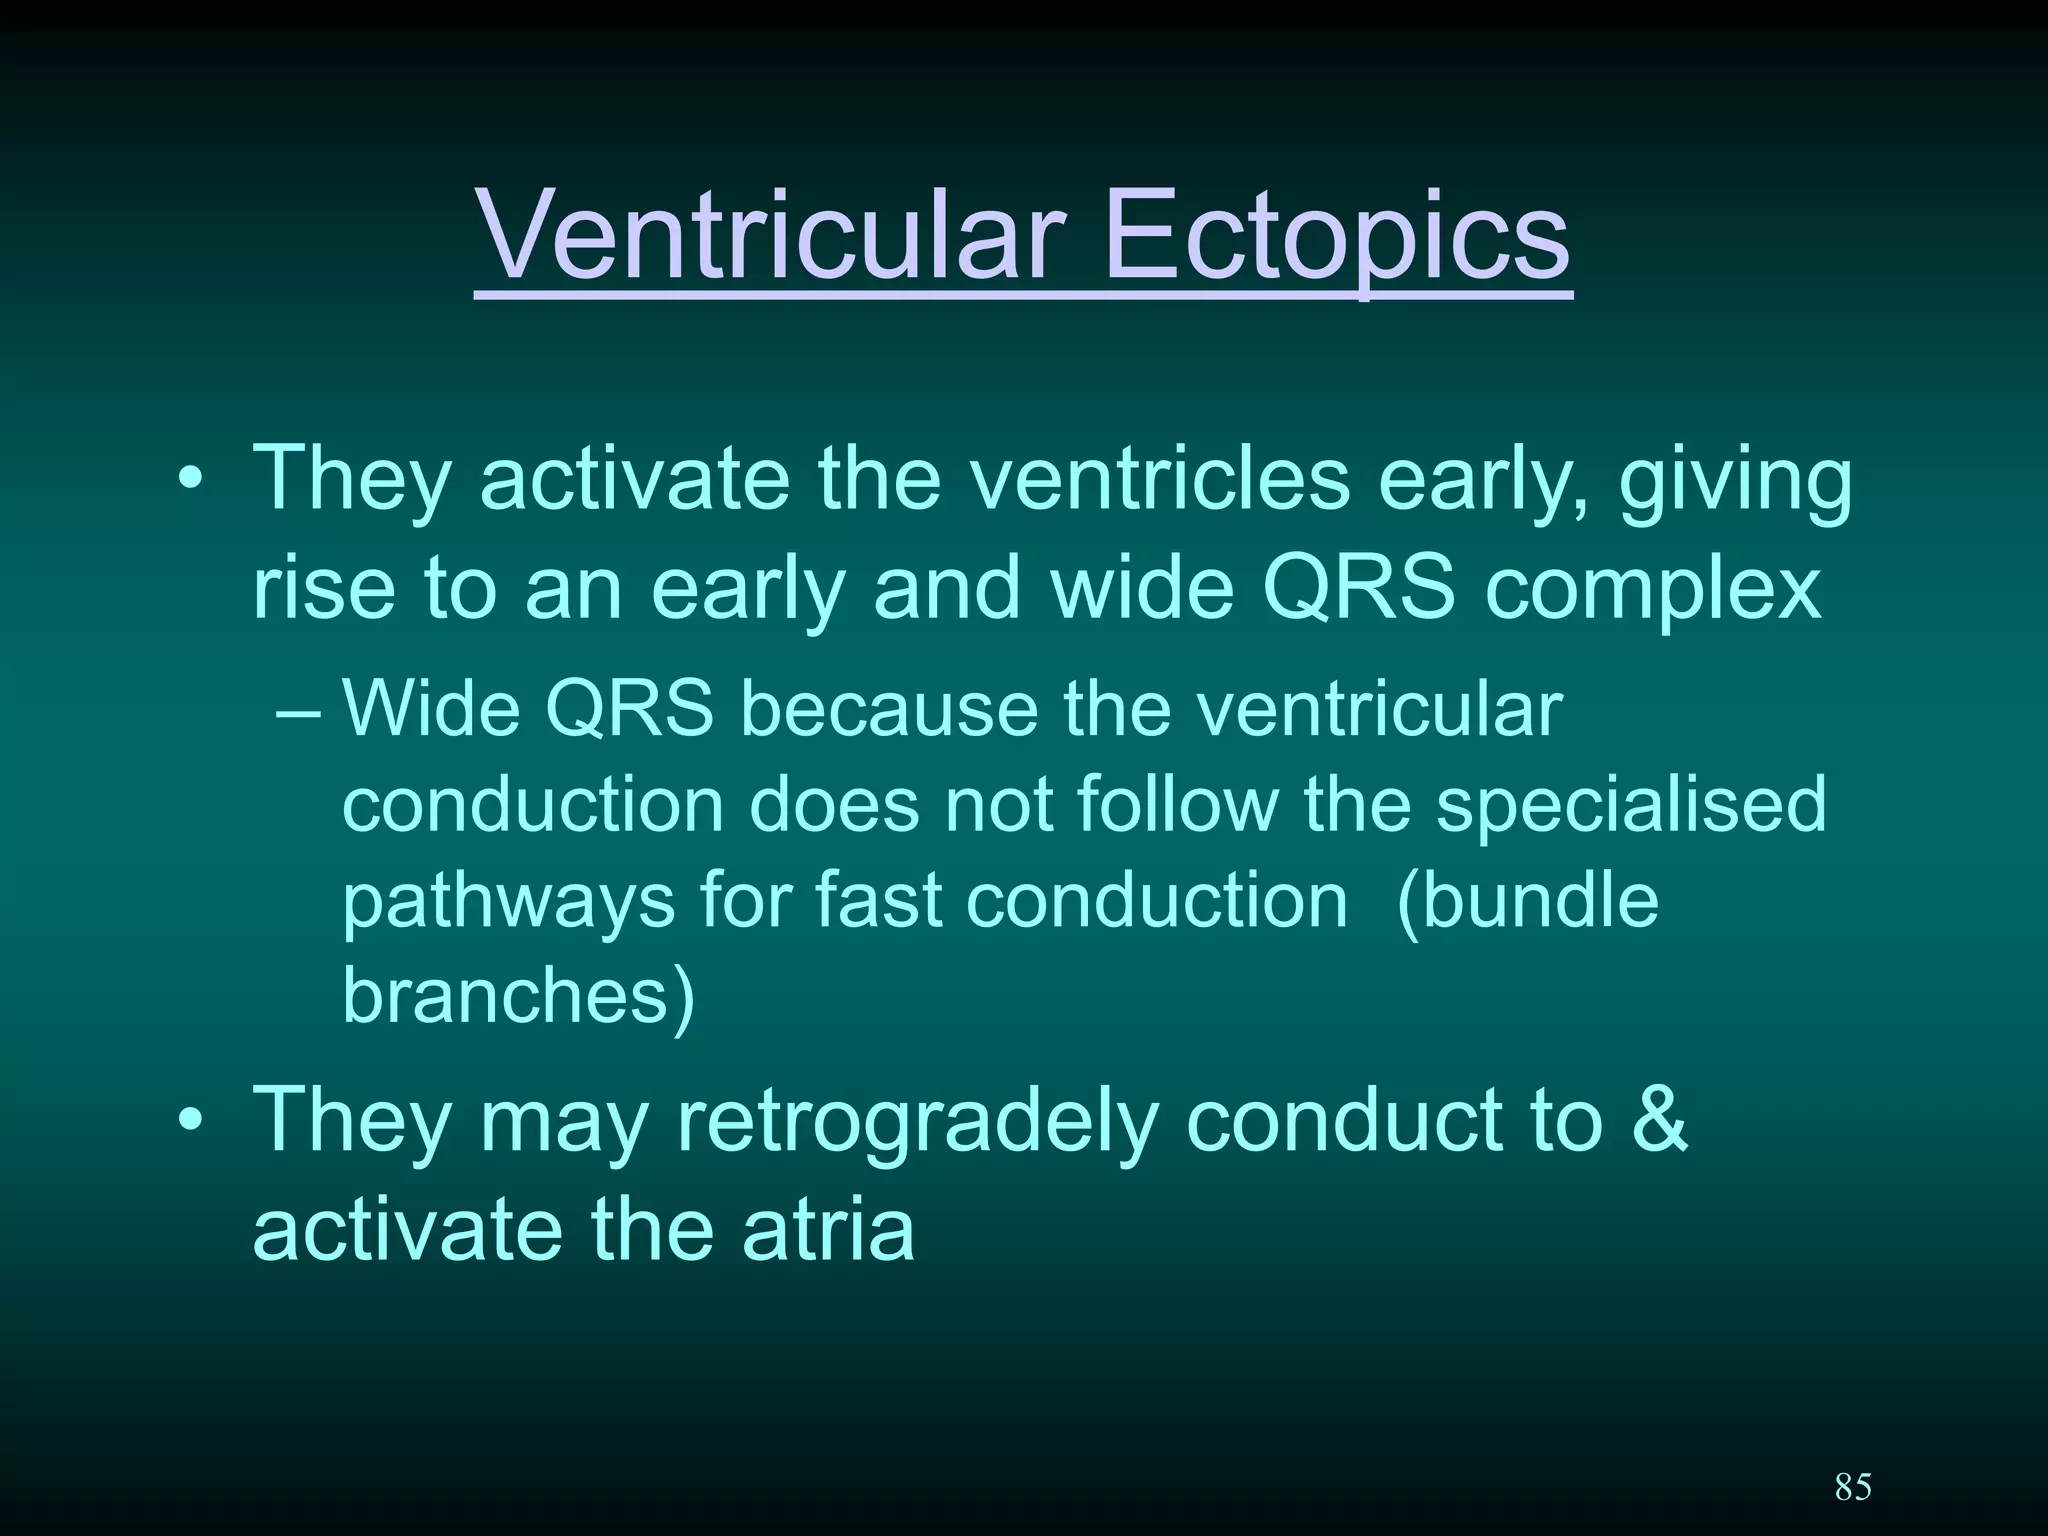


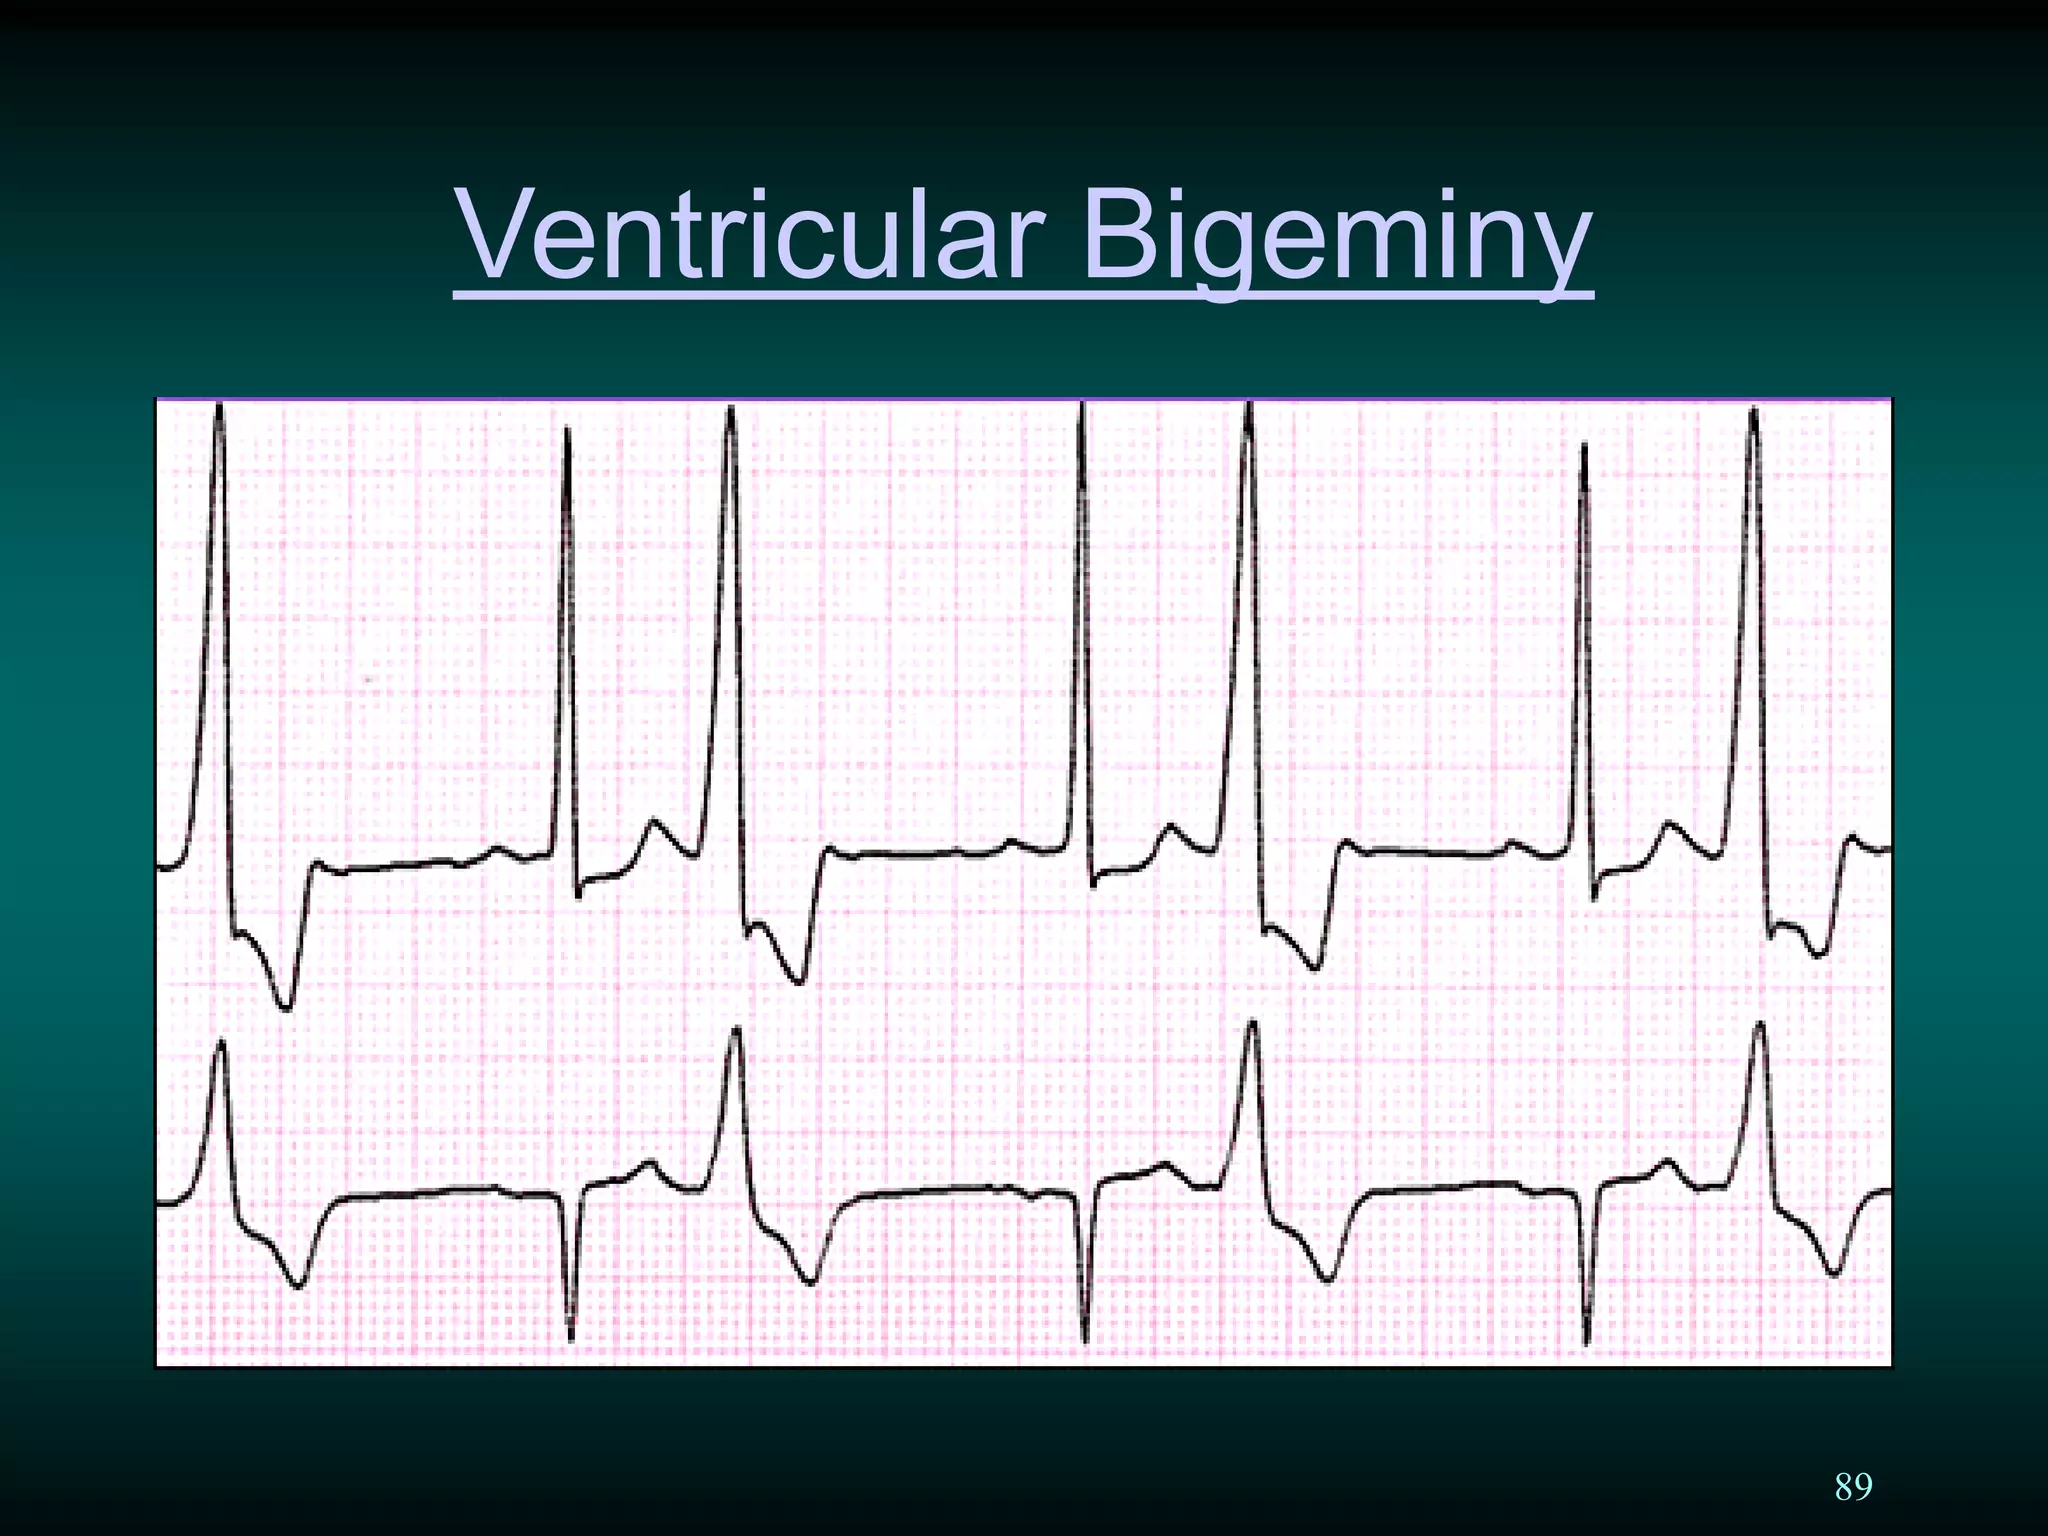


This document provides a comprehensive guide on interpreting pediatric electrocardiograms (ECGs), detailing the anatomy of the cardiac conduction system, waveform characteristics (P, QRS, T waves), and intervals (PR, QT). It discusses normal and abnormal rhythms like sinus bradycardia, tachycardia, and various types of ectopic beats, emphasizing the significance of clinical context, patient age, and ECG standards in accurate diagnosis. Key analysis points include measurement of heart rate, examination of waveforms, and intervals to identify potential cardiac issues.


![Apporach to lung biopsy [Auto-saved].pptx latest](https://cdn.slidesharecdn.com/ss_thumbnails/apporachtolungbiopsyauto-saved-251211225655-93258539-thumbnail.jpg?width=640&height=640&fit=bounds)


