SlideShare a Scribd company logo
1 of 9
Download to read offline
4QFY2010 Result Update I Automobile
                                                                                                                           May 14, 2010


  Bajaj Auto                                                                             ACCUMULATE
                                                                                         CMP                                     Rs2,186
  Performance Highlights                                                                 Target Price                            Rs2,361
  For 4QFY2010, Bajaj Auto (BAL) clocked Net Sales of Rs3,399cr (Rs1,883cr),             Investment Period                      15 Months
  up 80.5% yoy, which were marginally above our expectation of Rs3,329cr. The
  top-line growth was entirely on the back of volume growth, which stood at              Stock Info
  83.8% yoy, while realisations growth was almost flat at 0.2% yoy, primarily due
                                                                                         Sector                            Automobile
  to a higher contribution of low-end bikes (Discover) in the Sales mix. The
  Discover 100 and the Pulsar were the primary game-changer brands, as the               Market Cap (Rs cr)                       31,620
  company continues to launch new products under the two-brand umbrella.
                                                                                         Beta                                         0.7
  BAL’s Bottom-line for the quarter stood at Rs529cr (Rs130cr), and came in
  above our estimate of Rs425cr. We recommend an Accumulate on the stock.                52 WK High / Low                       2,220/727

  OPM at 22.9%; management maintains guidance of 20% OPM for FY2011E:                    Avg. Daily Volume                         52302
  During 4QFY2010, BAL witnessed a substantial 768bp yoy jump in its EBITDA              Face Value (Rs)                              10
  Margin to 22.9% (15.2%). On a qoq basis too, the Margin was up by 90bp,
  despite an increase in core raw material prices, on the back of better operating       BSE Sensex                               16,995
  leverage. Raw Material costs increased by 49bp and accounted for almost                Nifty                                     5,094
  69.3% of Sales, while Other expenditure and Staff cost showed a significant
  drop of 568bp yoy and 249bp yoy, respectively. Overall, the Operating Profit           Reuters Code                            BAJA.BO
  increased by 171.9% yoy to Rs777cr (Rs286cr), which came in better than our
                                                                                         Bloomberg Code                     BJAUT@IN
  estimate of Rs665cr. The Net Profit, before Extraordinary items, stood at
  Rs529cr (Rs130cr) and exceeded our expectation of Rs425cr, largely owing to            Shareholding Pattern (%)
  better margins and a lower tax rate.
                                                                                         Promoters                                   49.6
  Outlook and Valuation: We have revised our Earnings estimate upwards for               MF/Banks/Indian FLs                        15.1
  FY2011E to Rs137.9 (Rs120.3 earlier), and for FY2012E to Rs147.6 (Rs135.2
  earlier), owing to the better-than-expected Operating performance in                   FII/NRIs/OCBs                               18.3
  4QFY2010 and lower tax provisioning, while we have modeled around a 13%                Indian Public                              17.0
  CAGR in Volumes over FY2010-12E. We expect the Margins to decline due to
  an uptick in raw material prices in FY2011E. However, the company’s cost-              Abs.                3m           1yr         3yr
  cutting measures and improved operating leverage would restrict a substantial
                                                                                         Sensex (%)          5.2         43.1        21.7
  fall in the OPM. The company is poised to win back some of its lost market
  share over the next couple of years, with multiple new launches in the
                                                                                         BAL (%)           22.2          175.6       NA#
  Motorcycle and Three-wheeler Segments. At the CMP, the stock is trading at
  15.9x its FY2011E and 14.8x its FY2012E EPS. We recommend an Accumulate               Note: # Listed on May 26, 2008
  on the stock, with a Target Price of Rs2,361, at which the stock would trade at
  16x its FY2012E Earnings.

 Key Financials
 Y/E March (Rs cr)                 FY2009         FY2010E         FY2011E   FY2012E
 Net Sales                           8,813          11,921         14,213    15,535
 % chg                                (2.3)            35.3          19.2       9.3
 Adj. Net Profit                       769            1,865         1,995     2,135
 % chg                                (4.9)           142.4           7.0       7.1
 OPM (%)                              11.6             22.5          19.5      19.0
 EPS (Rs)                             53.2            128.9         137.9     147.6
 P/E (x)                              41.1             17.0          15.9      14.8
 P/BV (x)                             16.9             10.3           7.4       5.7
 RoE (%)                              44.5             75.7          54.3      43.6
 RoCE (%)                             26.7             60.8          48.5      41.7
                                                                                      Vaishali Jajoo
 EV/Sales (x)                           3.5             2.4           1.9       1.6   Tel: 022 – 4040 3800 Ext: 344
 EV/EBITDA (x)                        31.8             11.2          10.4       9.3   E-mail: vaishali.jajoo@angeltrade.com
Source: Company, Angel Research
                                                                                                                                            1
Please refer to important disclosures at the end of this report                           Sebi Registration No: INB 010996539
Bajaj Auto I 4QFY2010 Result Update

               Exhibit 1: Financial Performance Update
               Y/E March (Rs cr)                       4QFY10     4QFY09     % chg       FY10      FY09    % chg
               Net Sales (include Other Op. Inc.)      3,399.5    1,883.4     80.5    11,920.9   8,813.0    35.3
               Consumption of RM                       2,236.7    1,241.7     80.1     7,650.6   6,089.1    25.6
               (% of Sales)                               65.8       65.9                 64.2      69.1
               Staff Costs                                86.2       94.6     (8.9)      399.5     354.4    12.7
               (% of Sales)                                2.5        5.0                  3.4       4.0
               Purchases of TG                           117.7       53.5    120.2       419.8     374.4    12.1
               (% of Sales)                                 3.5       2.8                  3.5       4.2
               Other Expenses                            181.8     207.8     (12.5)     858.5     792.9      8.3
               (% of Sales)                                 5.3      11.0                  7.2       9.0
               Total Expenditure                       2,622.4    1,597.6     64.1     9,328.4   7,610.7    22.6
               Operating Profit                          777.1      285.8    171.9     2,592.5   1,202.3   115.6
               OPM                                        22.9       15.2                 21.7      13.6
               Interest                                   (0.0)      5.2    (100.2)        6.0      21.0   (71.5)
               Depreciation                               34.1      31.3        9.0      136.5     129.8      5.1
               Other Income                               42.5      22.9       85.5      122.5     111.7      9.7
               PBT (excl. Extr. Items)                   785.5     272.3      188.5    2,572.6   1,163.2   121.2
               Extr. Income/(Expense)                     49.4      82.9          -      165.0     207.1        -
               PBT (incl. Extr. Items)                   736.2     189.3      288.8    2,407.6     956.1   151.8
               (% of Sales)                               21.7       10.1                 20.2      10.8
               Provision for Taxation                    207.5      59.1     251.0      707.5     301.6    134.6
               (% of PBT)                                 28.2       31.2                 29.4      31.5
               Reported PAT                              528.7     130.2     306.0     1,700.1    654.5    159.8
               PATM                                       15.6        6.9                 14.3       7.4
               Equity capital (cr)                       144.7     144.7                101.2     101.2
               EPS (Rs)                                   36.5        9.0    306.0      117.5      45.2    159.8
               Source: Company, Angel Research

                          Strong volume growth boosts top-line; Profit beats estimates: For 4QFY2010, Bajaj
                          Auto (BAL) clocked Net Sales of Rs3,399cr (Rs1,883cr), up 80.5% yoy, which was
                          marginally above our expectation of Rs3,329cr. The top-line growth was entirely on
                          the back of volume growth, which stood at 83.8% yoy, while the realisations growth
                          was almost flat at 0.2% yoy, primarily due to a higher contribution of low-end bikes
                          (Discover) in the Sales mix. The Discover 100 and the Pulsar were the primary game-
                          changer brands, as the company continues to launch new products under the two-
                          brand umbrella. BAL’s Bottom-line for the quarter stood at Rs529cr (Rs130cr), and
                          came in above our estimate of Rs425cr. Overall, a strong volume growth, a yoy
                          decline in staff costs and effective operating cost management, have resulted in a
                          substantial jump in the OPMs and the performance during the quarter.

                          OPM at 22.9%; management maintains guidance of 20% OPM for FY2011E:
                          During 4QFY2010, BAL witnessed a substantial 768bp yoy jump in its EBITDA
                          Margin to 22.9% (15.2%). On a qoq basis too, the Margin was up by 90bp, despite
                          an increase in core raw material prices, on the back of better operating leverage.
                          Raw Material costs increased by 49bp and accounted for almost 69.3% of Sales,
                          while Other expenditure and Staff cost showed a significant drop of 568bp yoy and
                          249bp yoy, respectively. Overall, the Operating Profit increased by 171.9% yoy to
                          Rs777cr (Rs286cr), which came in better than our estimate of Rs665cr. The
                          proposed increase in production at the Pantnagar plant, a focus on cost reductions
                          and minimal sales promotion expenses contributed to BAL achieving better Margins.

                          Net Profit up 306% yoy: The Net Profit, before Extraordinary items, stood at Rs529cr
                          (Rs130cr) and exceeded our expectation of Rs425cr. BAL announced VRS for 2,331
                          workmen at its Akurdi plant, and decided to recognise expenditure amounting to
                          Rs337cr over an appropriate period; for 4QFY2010, the company recognised
                          Rs45.8cr. After deducting the Exceptional items amounting to Rs49.4cr (Rs82.9.cr),
                          the Bottom-line grew by 306% yoy to Rs529cr (Rs130cr). The tax rate has declined
                          by 304bp yoy, due to higher production at Uttarakhand.
May 14, 2010                                                                                                2
Bajaj Auto I 4QFY2010 Result Update


               Conference Call – Key Highlights

               Volume guidance: The Management has guided for robust growth in total volumes
               during FY2011E, with expected sales of around 3.6-4mn units in FY2011E (2.85mn
               units in FY2010). This growth will primarily be on the back of robust volumes
               clocked by the three brands across segments: Discover, Pulsar (Two-Wheelers) and
               RE (Three-Wheelers). The two-wheeler segment is expected to grow by around 40%
               yoy in the Motorcycle segment in FY2011E, with the Three-Wheeler segment
               following at a yoy growth of around 18% yoy. This growth is expected to continue
               due to a slew of new launches under its primary brands in the next couple of
               quarters. Moreover, the company is also optimistic about export volumes, and is
               poised to achieve its target of 1.1mn vehicles for FY2011E. Additionally, it has
               guided for robust sales expected at a CAGR of 18%-20% over the next 2-3 years in
               the key markets of Africa, South-East Asia, Latin America and Sri-Lanka, with forays
               expected in other emerging markets.

               The BAL management believes that the elevated growth rates for the two wheeler
               industry in FY2010 at 24% were partially aided by the pent up demand of the
               previous years, and that growth rates will moderate in FY2011E to the trend levels of
               12-14%.

               Exhibit 2: Motorcycle Segment volumes
                   Units                                                                                                                                                                                                                                                                   %
                                                                                Market Share (RHS)                                                                    Volume (LHS)
                 800,000                                                                                                                                                                                                                                                                  100
                 700,000                                                                                                                                                                                                                                                                  80
                 600,000                                                                                                                                                                                                                                                                  60
                 500,000                                                                                                                                                                                                                                                                  40
                 400,000                                                                                                                                                                                                                                                                  20
                 300,000                                                                                                                                                                                                                                                                  0
                 200,000                                                                                                                                                                                                                                                                  (20)
                 100,000                                                                                                                                                                                                                                                                  (40)
                          0                                                                                                                                                                                                                                                               (60)
                              1QFY2007

                                          2QFY2007

                                                      3QFY2007

                                                                   4QFY2007

                                                                                1QFY2008

                                                                                              2QFY2008

                                                                                                            3QFY2008

                                                                                                                           4QFY2008

                                                                                                                                          1QFY2009

                                                                                                                                                          2QFY2009

                                                                                                                                                                           3QFY2009

                                                                                                                                                                                            4QFY2009

                                                                                                                                                                                                              1QFY2010

                                                                                                                                                                                                                                2QFY2010

                                                                                                                                                                                                                                                  3QFY2010

                                                                                                                                                                                                                                                                    4QFY2010
               Source: SIAM, Angel Research

               Exhibit 3: Three-Wheeler Segment volumes
                  Units                                                       Market Share (RHS)                                                                      Volume (LHS)                                                                                                             %
                 100,000                                                                                                                                                                                                                                                                       80
                  90,000                                                                                                                                                                                                                                                                       60
                  80,000                                                                                                                                                                                                                                                                       40
                  70,000                                                                                                                                                                                                                                                                       20
                  60,000                                                                                                                                                                                                                                                                       0
                  50,000                                                                                                                                                                                                                                                                       (20)
                  40,000                                                                                                                                                                                                                                                                       (40)
                  30,000                                                                                                                                                                                                                                                                       (60)
                               1QFY2007

                                           2QFY2007

                                                        3QFY2007

                                                                     4QFY2007

                                                                                   1QFY2008

                                                                                                 2QFY2008

                                                                                                                3QFY2008

                                                                                                                               4QFY2008

                                                                                                                                               1QFY2009

                                                                                                                                                                2QFY2009

                                                                                                                                                                                 3QFY2009

                                                                                                                                                                                                   4QFY2009

                                                                                                                                                                                                                     1QFY2010

                                                                                                                                                                                                                                           2QFY2010

                                                                                                                                                                                                                                                             3QFY2010

                                                                                                                                                                                                                                                                               4QFY2010


               Source: SIAM, Angel Research


May 14, 2010                                                                                                                                                                                                                                                                                       3
Bajaj Auto I 4QFY2010 Result Update


               Target to achieve 34% market share in FY2011E: BAL maintained its market
               leadership in the 125cc-plus category, with a market share of around 46.7%. Its
               market share in the domestic Motorcycle Segment declined to around 21.9% in
               FY2009, which has improved to 24.3% in FY2010. The management believes that
               the full effect of new launches in 4QFY2010 helped the company to regain its
               market share. It expects to further increase its market share in the motorcycle
               segment to 34-35% in FY2011E.

               Operating Margins expected to be at around 20%: The company recorded robust
               margins in 4QFY2010 at 22.9%, higher on a qoq basis. The company had given a
               guidance of maintaining a healthy Margin level, at around 20% in FY2011, despite
               relatively higher Raw material costs, primarily on the back of cost-cutting efforts
               adopted at the operating level and better realisations in Exports, all of which it has
               realised in FY2010. Going ahead, the management has guided to maintain its
               margin above the 20% level for the next couple of quarters, despite an uptrend seen
               in input cost prices in the recent months. Also, the management is sanguine about
               maintaining the 18-20% margin range for FY2011E, on the back of better operating
               leverage on higher volumes, which is expected to offset the hike in raw material
               costs, to a certain extent. Further, a higher volume off-take from the Pantnagar plant
               (60,000 per month currently) will have a positive effect on the NPM. The
               management expects the production at the Pantnagar plant to increase to 70,000
               per month in the June 2010 quarter, and to 1,20,000 per month in the later part of
               FY2011E.

               Capacity Expansion: Bajaj Auto has guided for capex of Rs250cr in FY2011E. It is
               scaling up production at its Uttarakhand plant to 1.2m units (from 0.6m units in
               FY2010). The company will incrementally produce the Discover range and the Pulsar
               135cc bikes from there. The management also pointed that the capex over FY2012E
               would be determined by the roll out plans for the small car.

               Currency hedges: The company has hedged its entire FY2011E export exposure at
               Rs46.5/US$.


May 14, 2010                                                                                       4
Bajaj Auto I 4QFY2010 Result Update

               Outlook and Valuation
               Overall, Two-wheeler sales improved in FY2010, owing to the various measures
               adopted by the government and positive developments on the macro-economic
               front. We believe that although the substantial ownership base of Two-wheelers
               results in reduced headroom for higher double-digit growth rates, the increased
               dependence on replacement demand is expected to sustain volumes. Moreover, the
               rural markets are expected to register better growth on account of the new demand
               arising from the relevant rural population, which is expected to help Two-wheeler
               companies in maintaining their growth momentum, registering an 8-9% CAGR in
               Volumes over the next few years.

               In the case of BAL, we have revised our Earnings estimate upwards for FY2011E to
               Rs137.9 (Rs120.3 earlier), and for FY2012E to Rs147.6 (Rs135.2 earlier), owing to
               its better-than-expected Operating performance in 4QFY2010 and lower tax
               provisioning, while we have modeled around a 13% CAGR in Volumes over
               FY2010-12E. We expect the Margins to decline on an uptick in raw material prices
               in FY2011E. However, the company’s cost-cutting measures and improved
               operating leverage would restrict a substantial fall in the OPM.

               The company is poised to win back some of its lost market share over the next
               couple of years, with multiple new launches in the Motorcycle and Three-wheeler
               Segments. At the CMP, the stock is trading at 15.9x its FY2011E and 14.8x its
               FY2012E EPS. We recommend an Accumulate on the stock, with a Target Price of
               Rs2,361, at which the stock would trade at 16x its FY2012E Earnings.

               Exhibit 4: One year forward P/E

                 60.0

                 50.0

                 40.0

                 30.0

                 20.0

                 10.0

                   -
                                   Aug-02


                                                               Aug-03


                                                                                          Aug-04


                                                                                                                     Aug-05


                                                                                                                                                 Aug-06


                                                                                                                                                                              Aug-07


                                                                                                                                                                                                            Aug-08


                                                                                                                                                                                                                                           Aug-09
                                             Dec-02


                                                                        Dec-03


                                                                                                   Dec-04


                                                                                                                              Dec-05


                                                                                                                                                          Dec-06


                                                                                                                                                                                        Dec-07


                                                                                                                                                                                                                      Dec-08


                                                                                                                                                                                                                                                      Dec-09
                         Apr-02


                                                      Apr-03


                                                                                 Apr-04


                                                                                                            Apr-05


                                                                                                                                       Apr-06


                                                                                                                                                                    Apr-07


                                                                                                                                                                                                  Apr-08


                                                                                                                                                                                                                                Apr-09


                                                                                                                                                                                                                                                                 Apr-10
                                                                                            Absolute P/E                                        3 year Average P/E

               Source: C-line, Angel Research

               Exhibit 5: BAL - Premium/Discount to Sensex P/E

                 250%

                 200%

                 150%

                 100%

                  50%

                    0%

                  -50%

                -100%
                          Apr-02


                                                      Apr-03


                                                                                 Apr-04


                                                                                                            Apr-05


                                                                                                                                       Apr-06


                                                                                                                                                                   Apr-07


                                                                                                                                                                                                 Apr-08


                                                                                                                                                                                                                               Apr-09


                                                                                                                                                                                                                                                               Apr-10
                                    Aug-02


                                                               Aug-03


                                                                                          Aug-04


                                                                                                                     Aug-05


                                                                                                                                                 Aug-06


                                                                                                                                                                             Aug-07


                                                                                                                                                                                                           Aug-08


                                                                                                                                                                                                                                         Aug-09
                                             Dec-02


                                                                        Dec-03


                                                                                                   Dec-04


                                                                                                                              Dec-05


                                                                                                                                                          Dec-06


                                                                                                                                                                                       Dec-07


                                                                                                                                                                                                                     Dec-08


                                                                                                                                                                                                                                                    Dec-09


                                                                                 Absolute Premium                                               3 year Average Premium

               Source: C-line, Angel Research
May 14, 2010                                                                                                                                                                                                                                                            5
Bajaj Auto I 4QFY2010 Result Update


               Profit & Loss Statement                                                               (Rs cr)
                Y/E March                      FY2007    FY2008    FY2009    FY2010E    FY2011E   FY2012E
                Gross sales                    10,639     9,690     9,050     12,118     15,126    16,832
                Less: Excise duty              1,321.7   1,029.5    610.1      609.7    1,285.7   1,683.2
                Net Sales                       9,317     8,660     8,440     11,508     13,840    15,149
                Other operating income          227.5     358.5     373.4      412.5      373.2     386.5
                Total operating income          9,545     9,019     8,813     11,921     14,213    15,535
                % chg                                -     (5.5)     (2.3)      35.3       19.2       9.3
                Total Expenditure               8,146     7,855     7,831      9,328     11,515    12,664
                Net Raw Materials               6,893     6,618     6,466      8,070      9,965    10,983
                Other Mfg costs                 249.1     216.4     192.2           -     207.6     227.2
                Personnel                       340.1     444.0     537.7      399.5      470.6     499.9
                Other                           663.7     576.8     635.2      858.5      871.9     954.4
                EBITDA                          1,399     1,164       982      2,592      2,698     2,871
                % chg                                -    (16.8)    (15.7)     164.0        4.1       6.4
                (% of Net Sales)                  15.0      13.4     11.6       22.5       19.5      19.0
                Depreciation& Amortisation      190.3     174.0     129.8      136.5      154.2     168.3
                EBIT                            1,209       990       852      2,456      2,544     2,703
                % chg                                -    (18.1)    (14.0)     188.3        3.6       6.2
                (% of Net Sales)                  13.0      11.4     10.1       21.3       18.4      17.8
                Interest & other Charges           5.3       5.2     21.0        6.0       19.6      19.6
                Other Income                    524.2     148.7     122.2      122.5      171.0     183.4
                (% of PBT)                       27.9      13.8      14.6        5.1        6.3       6.4
                Recurring PBT                   1,728     1,134       953      2,573      2,696     2,866
                % chg                                -    (34.4)    (15.9)     169.9        4.8       6.3
                Extraordinary (Expense)/Inc.    150.6     (52.8)   (114.8)    (165.0)         -         -
                PBT                             1,878     1,081       838      2,408      2,696     2,866
                Tax                             489.6     378.0     298.7      707.5      700.8     730.9
                (% of PBT)                        26.1      35.0     35.6       29.4       26.0      25.5
                PAT (reported)                  1,238       756       655      1,700      1,995     2,135
                ADJ. PAT                        1,087       809       769      1,865      1,995     2,135
                % chg                                -    (25.6)     (4.9)     142.4        7.0       7.1
                (% of Net Sales)                 11.7        9.3      9.1       16.2       14.4      14.1
                Basic EPS (Rs)                  107.5      55.9      53.2      128.9      137.9     147.6
                Fully Diluted EPS (Rs)          107.5      55.9      53.2      128.9      137.9     147.6
                % chg                                -    (48.0)     (4.9)     142.4        7.0       7.1


May 14, 2010                                                                                                6
Bajaj Auto I 4QFY2010 Result Update


               Balance Sheet                                                                                 (Rs cr)
                Y/E March                           FY2007    FY2008    FY2009     FY2010E     FY2011E     FY2012E
                SOURCES OF FUNDS
                Equity Share Capital                 101.2     144.7      144.7       144.7      144.7       144.7
                Preference Capital                        -         -          -           -          -           -
                Reserves& Surplus                    5,433     1,443      1,725       2,916      4,149       5,367
                Shareholders Funds                   5,534     1,588      1,870       3,060      4,293       5,512
                Total Loans                         1,625.4   1,334.3   1,570.0       1,570      1,570       1,570
                Deferred Tax Liability                74.2      11.0         4.2        4.2         4.2         4.2
                Total Liabilities                    7,234     2,933      3,444       4,634      5,867       7,086
                APPLICATION OF FUNDS
                Gross Block                          3,179     2,984      3,334       3,596      3,954       4,208
                Less: Acc. Depreciation              1,922     1,726      1,808       1,944      2,099       2,267
                Net Block                            1,256     1,258      1,526       1,652      1,856       1,941
                Capital Work-in-Progress              26.9      34.7       22.1        36.0        39.5       42.1
                Goodwill                                  -         -          -           -          -           -
                Investments                          6,448     1,857      1,809       3,244      4,401       5,669
                Current Assets                       3,819     1,650      2,325       3,522      3,796       4,008
                Cash                                  83.5      56.1      136.9       909.1      672.9       758.6
                Loans & Advances                     2,896       969      1,491       1,726      2,076       2,121
                Other                                  840       625        697         887      1,048       1,129
                Current liabilities                  4,333     1,877      2,438       3,820      4,225       4,574
                Net Current Assets                  (514.1)   (227.6)    (112.3)      (298)     (428.4)     (566.0)
                Mis. Exp. not written off             17.5      10.5      199.6            -          -           -
                Total Assets                         7,234     2,933      3,444       4,634      5,867       7,086

               Cash Flow                                                                                      (Rs cr)
                Y/E March                           FY2007    FY2008    FY2009     FY2010E     FY2011E     FY2012E
                Profit before tax                    1,878     1,081        838       2,408       2,696       2,866
                Depreciation                         190.3     174.0      129.8       136.5       154.2       168.3
                Change in Working Capital               6.8   (203.6)     144.6     (176.0)       176.3       108.3
                Less: Other income                   903.9     193.2        403     (1,094)         458       134.7
                Direct taxes paid                    489.6     378.0      298.7       707.5       700.8       730.9
                Cash Flow from Operations            681.7     480.2        411     2,754.9       1,867     2,277.3
                (Inc.)/Dec. in Fixed Assets         (287.1)    186.6     (337.1)      (276)     (361.5)     (256.2)
                (Inc.)/Dec. in Investments          (590.6)         -      48.6    (1,435.6)   (1,156.4)   (1,268.3)
                (Inc.)/Dec. in loans and advances    (93.7)    (95.3)    (141.4)      813.4     (366.4)        30.4
                Other income                         524.2     148.7      122.2       122.5       171.0       183.4
                Cash Flow from Investing            (447.1)    240.0     (307.7)      (776)     (1,713)    (1,310.8)
                Issue of Equity                           -     43.5           -           -           -           -
                Inc./(Dec.) in loans                 158.3    (291.1)     235.7            -           -           -
                Dividend Paid (Incl. Tax)            461.5     473.5      338.6       372.4       677.1       761.7
                Others                              (853.0)   (973.5)    (597.2)   (1,579.0)   (1,067.5)   (1,642.6)
                Cash Flow from Financing            (233.3)   (747.6)     (23.0)    (1,207)     (390.4)     (880.8)
                Inc./(Dec.) in Cash                     1.4    (27.4)      80.8       772.2     (236.2)        85.7
                Opening Cash balances                  82.1     83.5       56.1       136.9       909.1       672.9
                Closing Cash balances                  83.5     56.1      136.9       909.1       672.9       758.6


May 14, 2010                                                                                                       7
Bajaj Auto I 4QFY2010 Result Update


               Key Ratios
                Y/E March                         FY2007    FY2008     FY2009    FY2010E    FY2011E    FY2012E
                Valuation Ratio (x)
                P/E (on FDEPS)                      20.3      39.1       41.1       17.0       15.9       14.8
                P/CEPS                              15.5      34.0       40.3       15.8       14.7       13.7
                P/BV                                 4.0      19.9       16.9       10.3        7.4        5.7
                Dividend yield (%)                   1.8       0.9        1.0        1.8        2.1        2.3
                EV/Sales                             2.5       3.2        3.5        2.4        1.9        1.6
                EV/EBITDA                           19.1      26.7       31.8       11.2       10.4        9.3
                EV / Total Assets                    3.7      10.6        9.1        6.3        4.8        3.8
                Per Share Data (Rs)
                EPS (Basic)                        107.5      55.9       53.2      128.9      137.9      147.6
                EPS (fully diluted)                107.5      55.9       53.2      128.9      137.9      147.6
                Cash EPS                           141.2      64.3       54.2      138.3      148.5      159.2
                DPS                                 40.0      20.0       22.0       40.0       45.0       50.0
                Book Value                         547.0     109.7      129.2      211.5      296.7      381.0
                Dupont Analysis
                EBIT margin                         13.0      11.4       10.1       21.3       18.4       17.8
                Tax retention ratio                  0.7       0.7        0.6        0.7        0.7        0.7
                Asset turnover (x)                   1.4       1.8        2.9        3.4        3.2        2.7
                ROIC (Post-tax)                     13.7      13.4       18.5       51.1       43.4       35.8
                Cost of Debt (Post Tax)                 -         -          -          -          -          -
                Leverage (x)                            -         -          -          -          -          -
                Operating ROE                       13.7      13.4       18.5       51.1       43.4       35.8
                Returns (%)
                ROCE (Pre-tax)                      17.8      19.5       26.7       60.8       48.5       41.7
                Angel ROIC (Pre-tax)                16.9      34.4       25.8       65.9       49.0       42.7
                ROE                                 21.1      22.7       44.5       75.7       54.3       43.6
                Turnover ratios (x)
                Asset Turnover (Gross Block)         3.1       2.9        2.8        3.4        3.8        3.8
                Inventory / Sales (days)            11.4      13.9       14.9       12.1       12.3       12.7
                Receivables (days)                  16.3      17.0       13.7       14.6       14.3       14.0
                Payables (days)                     53.4      53.6       48.8       39.4       38.0       41.1
                WC cycle (ex-cash) (days)          (22.9)    (17.8)     (11.0)     (22.3)     (29.6)     (28.5)
                Solvency ratios (x)
                Net debt to equity                  (0.9)     (0.4)      (0.2)      (0.8)      (0.8)      (0.9)
                Net debt to EBITDA                  (3.5)     (0.5)      (0.4)      (1.0)      (1.3)      (1.7)
                Interest Coverage (EBIT / Int.)    226.3     191.9       40.6      410.7      129.6      137.7


May 14, 2010                                                                                                  8
Bajaj Auto I 4QFY2010 Result Update


Research Team Tel: 022-4040 3800                                         E-mail: research@angeltrade.com                                       Website: www.angeltrade.com


DISCLAIMER

This document is solely for the personal information of the recipient, and must not be singularly used as the basis of any investment decision. Nothing in this
document should be construed as investment or financial advice. Each recipient of this document should make such investigations as they deem necessary to
arrive at an independent evaluation of an investment in the securities of the companies referred to in this document (including the merits and risks involved),
and should consult their own advisors to determine the merits and risks of such an investment.

Angel Securities Limited, its affiliates, directors, its proprietary trading and investment businesses may, from time to time, make investment decisions that are
inconsistent with or contradictory to the recommendations expressed herein. The views contained in this document are those of the analyst, and the company
may or may not subscribe to all the views expressed within.

Reports based on technical and derivative analysis center on studying charts of a stock's price movement, outstanding positions and trading volume, as
opposed to focusing on a company's fundamentals and, as such, may not match with a report on a company's fundamentals.

The information in this document has been printed on the basis of publicly available information, internal data and other reliable sources believed to be true,
and is for general guidance only. Angel Securities Limited has not independently verified all the information contained within this document. Accordingly, we
cannot testify, nor make any representation or warranty, express or implied, to the accuracy, contents or data contained within this document. While Angel
Securities Limited endeavours to update on a reasonable basis the information discussed in this material, there may be regulatory, compliance, or other
reasons that prevent us from doing so.

This document is being supplied to you solely for your information, and its contents, information or data may not be reproduced, redistributed or passed on,
directly or indirectly.

Angel Securities Limited and its affiliates may seek to provide or have engaged in providing corporate finance, investment banking or other advisory services
in a merger or specific transaction to the companies referred to in this report, as on the date of this report or in the past.

Neither Angel Securities Limited, nor its directors, employees or affiliates shall be liable for any loss or damage that may arise from or in connection with the
use of this information.
Note: Please refer to the important `Stock Holding Disclosure' report on the Angel website (Research Section).


 Disclosure of Interest Statement                                                                        Bajaj Auto
 1. Analyst ownership of the stock                                                                            No
 2. Angel and its Group companies ownership of the stock                                                      No
 3. Angel and its Group companies’ Directors ownership of the stock                                           No
 4. Broking relationship with company covered                                                                 No
 Note: We have not considered any Exposure below Rs 1 lakh for Angel and its Group companies


                                Address: Acme Plaza, ‘A’ Wing, 3rd Floor, M.V. Road, Opp. Sangam Cinema, Andheri (E), Mumbai - 400 059.
                                                                    Tel : (022) 3952 4568 / 4040 3800


    Angel Broking Ltd: BSE Sebi Regn No : INB 010996539 / CDSL Regn No: IN - DP - CDSL - 234 - 2004 / PMS Regn Code: PM/INP000001546 Angel Securities Ltd:BSE: INB010994639/INF010994639 NSE:
    INB230994635/INF230994635 Membership numbers: BSE 028/NSE:09946
    Angel Capital & Debt Market Ltd: INB 231279838 / NSE FNO: INF 231279838 / NSE Member code -12798 Angel Commodities Broking (P) Ltd: MCX Member ID: 12685 / FMC Regn No: MCX / TCM /
    CORP / 0037 NCDEX : Member ID 00220 / FMC Regn No: NCDEX / TCM / CORP / 0302


May 14, 2010                                                                                                                                                                                9

More Related Content

What's hot

Pantaloon Retail Result Update
Pantaloon Retail Result UpdatePantaloon Retail Result Update
Pantaloon Retail Result UpdateAngel Broking
 
MPL Result Update 4qfy2010-030510-final
MPL Result Update 4qfy2010-030510-finalMPL Result Update 4qfy2010-030510-final
MPL Result Update 4qfy2010-030510-finalAngel Broking
 
Bajaj auto Result Updated
Bajaj auto Result UpdatedBajaj auto Result Updated
Bajaj auto Result UpdatedAngel Broking
 
Maruti suzuki Result Update
Maruti suzuki Result UpdateMaruti suzuki Result Update
Maruti suzuki Result UpdateAngel Broking
 
Tajgvk result update - 290410
Tajgvk  result update - 290410Tajgvk  result update - 290410
Tajgvk result update - 290410Angel Broking
 
Bajaj electricals ru4-qfy2010-280510
Bajaj electricals ru4-qfy2010-280510Bajaj electricals ru4-qfy2010-280510
Bajaj electricals ru4-qfy2010-280510Angel Broking
 
Blue star ru4 qfy2010-190510
Blue star ru4 qfy2010-190510Blue star ru4 qfy2010-190510
Blue star ru4 qfy2010-190510Angel Broking
 
Pratibha ind Result Update 4 qfy2010-110510
Pratibha ind  Result Update 4 qfy2010-110510Pratibha ind  Result Update 4 qfy2010-110510
Pratibha ind Result Update 4 qfy2010-110510Angel Broking
 
Jk tyre ru4 qfy2010-260510
Jk tyre ru4 qfy2010-260510Jk tyre ru4 qfy2010-260510
Jk tyre ru4 qfy2010-260510Angel Broking
 
Jyoti structures ru4 qfy2010-240510
Jyoti structures ru4 qfy2010-240510Jyoti structures ru4 qfy2010-240510
Jyoti structures ru4 qfy2010-240510Angel Broking
 
Bgr energy ru4 qfy2010-010610
Bgr energy ru4 qfy2010-010610Bgr energy ru4 qfy2010-010610
Bgr energy ru4 qfy2010-010610Angel Broking
 
Subros result update 4 qfy2010 040510
Subros result update 4 qfy2010 040510Subros result update 4 qfy2010 040510
Subros result update 4 qfy2010 040510Angel Broking
 
Sadbhav engg ru4 qfy2010-240510
Sadbhav engg ru4 qfy2010-240510Sadbhav engg ru4 qfy2010-240510
Sadbhav engg ru4 qfy2010-240510Angel Broking
 
Colgate ru4 qfy2010-270510
Colgate ru4 qfy2010-270510Colgate ru4 qfy2010-270510
Colgate ru4 qfy2010-270510Angel Broking
 

What's hot (20)

Pantaloon Retail Result Update
Pantaloon Retail Result UpdatePantaloon Retail Result Update
Pantaloon Retail Result Update
 
MPL Result Update 4qfy2010-030510-final
MPL Result Update 4qfy2010-030510-finalMPL Result Update 4qfy2010-030510-final
MPL Result Update 4qfy2010-030510-final
 
Bajaj auto Result Updated
Bajaj auto Result UpdatedBajaj auto Result Updated
Bajaj auto Result Updated
 
Maruti suzuki Result Update
Maruti suzuki Result UpdateMaruti suzuki Result Update
Maruti suzuki Result Update
 
Tajgvk result update - 290410
Tajgvk  result update - 290410Tajgvk  result update - 290410
Tajgvk result update - 290410
 
Bajaj electricals ru4-qfy2010-280510
Bajaj electricals ru4-qfy2010-280510Bajaj electricals ru4-qfy2010-280510
Bajaj electricals ru4-qfy2010-280510
 
Blue star ru4 qfy2010-190510
Blue star ru4 qfy2010-190510Blue star ru4 qfy2010-190510
Blue star ru4 qfy2010-190510
 
Pratibha ind Result Update 4 qfy2010-110510
Pratibha ind  Result Update 4 qfy2010-110510Pratibha ind  Result Update 4 qfy2010-110510
Pratibha ind Result Update 4 qfy2010-110510
 
Jk tyre ru4 qfy2010-260510
Jk tyre ru4 qfy2010-260510Jk tyre ru4 qfy2010-260510
Jk tyre ru4 qfy2010-260510
 
Jyoti structures ru4 qfy2010-240510
Jyoti structures ru4 qfy2010-240510Jyoti structures ru4 qfy2010-240510
Jyoti structures ru4 qfy2010-240510
 
Bharat Forge
Bharat ForgeBharat Forge
Bharat Forge
 
Fag y2010-220410
Fag y2010-220410Fag y2010-220410
Fag y2010-220410
 
Hindalco
Hindalco Hindalco
Hindalco
 
Sadbhav
SadbhavSadbhav
Sadbhav
 
Automotive Axles
Automotive Axles Automotive Axles
Automotive Axles
 
RIL Result Update
RIL Result UpdateRIL Result Update
RIL Result Update
 
Bgr energy ru4 qfy2010-010610
Bgr energy ru4 qfy2010-010610Bgr energy ru4 qfy2010-010610
Bgr energy ru4 qfy2010-010610
 
Subros result update 4 qfy2010 040510
Subros result update 4 qfy2010 040510Subros result update 4 qfy2010 040510
Subros result update 4 qfy2010 040510
 
Sadbhav engg ru4 qfy2010-240510
Sadbhav engg ru4 qfy2010-240510Sadbhav engg ru4 qfy2010-240510
Sadbhav engg ru4 qfy2010-240510
 
Colgate ru4 qfy2010-270510
Colgate ru4 qfy2010-270510Colgate ru4 qfy2010-270510
Colgate ru4 qfy2010-270510
 

Viewers also liked

Techical Report June 28, 2010
Techical Report June 28, 2010Techical Report June 28, 2010
Techical Report June 28, 2010Angel Broking
 
Techical Report - June 30, 2010
Techical Report - June 30, 2010Techical Report - June 30, 2010
Techical Report - June 30, 2010Angel Broking
 
Bajaj electricals ru2 qfy2011-271010
Bajaj electricals ru2 qfy2011-271010Bajaj electricals ru2 qfy2011-271010
Bajaj electricals ru2 qfy2011-271010Angel Broking
 
Market Outlook - August 11, 2010
Market Outlook - August 11, 2010Market Outlook - August 11, 2010
Market Outlook - August 11, 2010Angel Broking
 
Market Outlook - 19th Oct 10
Market Outlook - 19th Oct 10Market Outlook - 19th Oct 10
Market Outlook - 19th Oct 10Angel Broking
 
Market outlook 15 06-10
Market outlook 15 06-10Market outlook 15 06-10
Market outlook 15 06-10Angel Broking
 
Market Outlook -Spetember 7, 2010
Market Outlook -Spetember 7, 2010Market Outlook -Spetember 7, 2010
Market Outlook -Spetember 7, 2010Angel Broking
 
Derivatives Report - july 30, 2010
Derivatives Report - july 30, 2010Derivatives Report - july 30, 2010
Derivatives Report - july 30, 2010Angel Broking
 
Derivatives Report - August 20, 2010
Derivatives Report - August 20, 2010Derivatives Report - August 20, 2010
Derivatives Report - August 20, 2010Angel Broking
 
Market Outlook -July 30, 2010
Market Outlook -July 30, 2010Market Outlook -July 30, 2010
Market Outlook -July 30, 2010Angel Broking
 
Market outlook 09 06-10
Market outlook 09 06-10Market outlook 09 06-10
Market outlook 09 06-10Angel Broking
 
Technical report - september 2, 2010
Technical report - september 2, 2010Technical report - september 2, 2010
Technical report - september 2, 2010Angel Broking
 
Derivatives report 18 may-2010
Derivatives report 18 may-2010Derivatives report 18 may-2010
Derivatives report 18 may-2010Angel Broking
 

Viewers also liked (19)

Techical Report June 28, 2010
Techical Report June 28, 2010Techical Report June 28, 2010
Techical Report June 28, 2010
 
Techical Report - June 30, 2010
Techical Report - June 30, 2010Techical Report - June 30, 2010
Techical Report - June 30, 2010
 
Bajaj electricals ru2 qfy2011-271010
Bajaj electricals ru2 qfy2011-271010Bajaj electricals ru2 qfy2011-271010
Bajaj electricals ru2 qfy2011-271010
 
HDIL
HDILHDIL
HDIL
 
Market Outlook - August 11, 2010
Market Outlook - August 11, 2010Market Outlook - August 11, 2010
Market Outlook - August 11, 2010
 
IRB
IRBIRB
IRB
 
Market Outlook - 19th Oct 10
Market Outlook - 19th Oct 10Market Outlook - 19th Oct 10
Market Outlook - 19th Oct 10
 
Glaxo Result Update
Glaxo Result UpdateGlaxo Result Update
Glaxo Result Update
 
Elecon
EleconElecon
Elecon
 
Market outlook 15 06-10
Market outlook 15 06-10Market outlook 15 06-10
Market outlook 15 06-10
 
Market Outlook -Spetember 7, 2010
Market Outlook -Spetember 7, 2010Market Outlook -Spetember 7, 2010
Market Outlook -Spetember 7, 2010
 
Derivatives Report - july 30, 2010
Derivatives Report - july 30, 2010Derivatives Report - july 30, 2010
Derivatives Report - july 30, 2010
 
DLF
DLFDLF
DLF
 
Derivatives Report - August 20, 2010
Derivatives Report - August 20, 2010Derivatives Report - August 20, 2010
Derivatives Report - August 20, 2010
 
Market Outlook -July 30, 2010
Market Outlook -July 30, 2010Market Outlook -July 30, 2010
Market Outlook -July 30, 2010
 
Market outlook 09 06-10
Market outlook 09 06-10Market outlook 09 06-10
Market outlook 09 06-10
 
OBC
OBCOBC
OBC
 
Technical report - september 2, 2010
Technical report - september 2, 2010Technical report - september 2, 2010
Technical report - september 2, 2010
 
Derivatives report 18 may-2010
Derivatives report 18 may-2010Derivatives report 18 may-2010
Derivatives report 18 may-2010
 

Similar to Bajaj Auto 4QFY2010 Result Update

Similar to Bajaj Auto 4QFY2010 Result Update (20)

Ashok leyland ru4 qfy2010-300410
Ashok leyland ru4 qfy2010-300410Ashok leyland ru4 qfy2010-300410
Ashok leyland ru4 qfy2010-300410
 
Exide
Exide Exide
Exide
 
Igl ru4 qfy2010-260510
Igl ru4 qfy2010-260510Igl ru4 qfy2010-260510
Igl ru4 qfy2010-260510
 
Tvs motor ru4 qfy2010-21042010
Tvs motor ru4 qfy2010-21042010Tvs motor ru4 qfy2010-21042010
Tvs motor ru4 qfy2010-21042010
 
Gipcl ru4 qfy2010-260510
Gipcl ru4 qfy2010-260510Gipcl ru4 qfy2010-260510
Gipcl ru4 qfy2010-260510
 
Bosch ru1 qcy2010-290410
Bosch ru1 qcy2010-290410Bosch ru1 qcy2010-290410
Bosch ru1 qcy2010-290410
 
Tata motors ru4 qfy2010-280510
Tata motors  ru4 qfy2010-280510Tata motors  ru4 qfy2010-280510
Tata motors ru4 qfy2010-280510
 
Tech Mahindra
Tech Mahindra Tech Mahindra
Tech Mahindra
 
Cccl ru4 qfy2010-100510
Cccl  ru4 qfy2010-100510Cccl  ru4 qfy2010-100510
Cccl ru4 qfy2010-100510
 
Anant raj ru4 qfy2010-280510
Anant raj ru4 qfy2010-280510Anant raj ru4 qfy2010-280510
Anant raj ru4 qfy2010-280510
 
Tata Motors
Tata Motors Tata Motors
Tata Motors
 
FAG Bearing
FAG BearingFAG Bearing
FAG Bearing
 
Colgate Palmolive
Colgate PalmoliveColgate Palmolive
Colgate Palmolive
 
TVS Motor
TVS MotorTVS Motor
TVS Motor
 
Gcpl Result Update
Gcpl Result UpdateGcpl Result Update
Gcpl Result Update
 
Spice jet ru4qfy2010-030610
Spice jet  ru4qfy2010-030610Spice jet  ru4qfy2010-030610
Spice jet ru4qfy2010-030610
 
ONGC
ONGCONGC
ONGC
 
Ongc ru4 qfy2010-280510
Ongc ru4 qfy2010-280510Ongc ru4 qfy2010-280510
Ongc ru4 qfy2010-280510
 
GSPL
GSPLGSPL
GSPL
 
GSPL
GSPLGSPL
GSPL
 

More from Angel Broking

Market outlook 110612
Market outlook 110612Market outlook 110612
Market outlook 110612Angel Broking
 
Axis%20 bank ru1qfy2012-220711
Axis%20 bank ru1qfy2012-220711Axis%20 bank ru1qfy2012-220711
Axis%20 bank ru1qfy2012-220711Angel Broking
 
Electrosteel castings
Electrosteel castingsElectrosteel castings
Electrosteel castingsAngel Broking
 
Derivative report 19th July 2011
Derivative report 19th July 2011Derivative report 19th July 2011
Derivative report 19th July 2011Angel Broking
 
Market outlook 19th July 2011
Market outlook 19th July 2011Market outlook 19th July 2011
Market outlook 19th July 2011Angel Broking
 
Weekly Report 18th July 2011
Weekly Report 18th July 2011Weekly Report 18th July 2011
Weekly Report 18th July 2011Angel Broking
 
Derivative Report 18th July 2011
Derivative Report 18th July 2011Derivative Report 18th July 2011
Derivative Report 18th July 2011Angel Broking
 
Technical Report 18th July 2011
Technical Report 18th July 2011Technical Report 18th July 2011
Technical Report 18th July 2011Angel Broking
 
Market Outlook 18th July 2011
Market Outlook 18th July 2011Market Outlook 18th July 2011
Market Outlook 18th July 2011Angel Broking
 
Tata consultancy services
Tata consultancy services Tata consultancy services
Tata consultancy services Angel Broking
 
Derivatives Report 15th July 2011
Derivatives Report 15th July 2011Derivatives Report 15th July 2011
Derivatives Report 15th July 2011Angel Broking
 
Technical Report 15th July 2011
Technical Report 15th July 2011Technical Report 15th July 2011
Technical Report 15th July 2011Angel Broking
 
Infosys Result Updated
Infosys Result UpdatedInfosys Result Updated
Infosys Result UpdatedAngel Broking
 
Derivative Report 13th July 2011
Derivative Report 13th July 2011Derivative Report 13th July 2011
Derivative Report 13th July 2011Angel Broking
 
Technical Report 13th July 2011
Technical Report 13th July 2011Technical Report 13th July 2011
Technical Report 13th July 2011Angel Broking
 

More from Angel Broking (20)

Market outlook 110612
Market outlook 110612Market outlook 110612
Market outlook 110612
 
Axis%20 bank ru1qfy2012-220711
Axis%20 bank ru1qfy2012-220711Axis%20 bank ru1qfy2012-220711
Axis%20 bank ru1qfy2012-220711
 
Electrosteel castings
Electrosteel castingsElectrosteel castings
Electrosteel castings
 
Persistent systems
Persistent systemsPersistent systems
Persistent systems
 
Ht media
Ht mediaHt media
Ht media
 
Derivative report 19th July 2011
Derivative report 19th July 2011Derivative report 19th July 2011
Derivative report 19th July 2011
 
Market outlook 19th July 2011
Market outlook 19th July 2011Market outlook 19th July 2011
Market outlook 19th July 2011
 
Telecom sector
Telecom sectorTelecom sector
Telecom sector
 
Weekly Report 18th July 2011
Weekly Report 18th July 2011Weekly Report 18th July 2011
Weekly Report 18th July 2011
 
Derivative Report 18th July 2011
Derivative Report 18th July 2011Derivative Report 18th July 2011
Derivative Report 18th July 2011
 
Technical Report 18th July 2011
Technical Report 18th July 2011Technical Report 18th July 2011
Technical Report 18th July 2011
 
Market Outlook 18th July 2011
Market Outlook 18th July 2011Market Outlook 18th July 2011
Market Outlook 18th July 2011
 
South Indian Bank
 South Indian Bank South Indian Bank
South Indian Bank
 
Tata consultancy services
Tata consultancy services Tata consultancy services
Tata consultancy services
 
Fc4 e63c4d01
Fc4 e63c4d01Fc4 e63c4d01
Fc4 e63c4d01
 
Derivatives Report 15th July 2011
Derivatives Report 15th July 2011Derivatives Report 15th July 2011
Derivatives Report 15th July 2011
 
Technical Report 15th July 2011
Technical Report 15th July 2011Technical Report 15th July 2011
Technical Report 15th July 2011
 
Infosys Result Updated
Infosys Result UpdatedInfosys Result Updated
Infosys Result Updated
 
Derivative Report 13th July 2011
Derivative Report 13th July 2011Derivative Report 13th July 2011
Derivative Report 13th July 2011
 
Technical Report 13th July 2011
Technical Report 13th July 2011Technical Report 13th July 2011
Technical Report 13th July 2011
 

Recently uploaded

(8264348440) 🔝 Call Girls In Keshav Puram 🔝 Delhi NCR
(8264348440) 🔝 Call Girls In Keshav Puram 🔝 Delhi NCR(8264348440) 🔝 Call Girls In Keshav Puram 🔝 Delhi NCR
(8264348440) 🔝 Call Girls In Keshav Puram 🔝 Delhi NCRsoniya singh
 
Marketing Management Business Plan_My Sweet Creations
Marketing Management Business Plan_My Sweet CreationsMarketing Management Business Plan_My Sweet Creations
Marketing Management Business Plan_My Sweet Creationsnakalysalcedo61
 
Call Girls Miyapur 7001305949 all area service COD available Any Time
Call Girls Miyapur 7001305949 all area service COD available Any TimeCall Girls Miyapur 7001305949 all area service COD available Any Time
Call Girls Miyapur 7001305949 all area service COD available Any Timedelhimodelshub1
 
Intro to BCG's Carbon Emissions Benchmark_vF.pdf
Intro to BCG's Carbon Emissions Benchmark_vF.pdfIntro to BCG's Carbon Emissions Benchmark_vF.pdf
Intro to BCG's Carbon Emissions Benchmark_vF.pdfpollardmorgan
 
Call Girls in Mehrauli Delhi 💯Call Us 🔝8264348440🔝
Call Girls in Mehrauli Delhi 💯Call Us 🔝8264348440🔝Call Girls in Mehrauli Delhi 💯Call Us 🔝8264348440🔝
Call Girls in Mehrauli Delhi 💯Call Us 🔝8264348440🔝soniya singh
 
Call Girls In Sikandarpur Gurgaon ❤️8860477959_Russian 100% Genuine Escorts I...
Call Girls In Sikandarpur Gurgaon ❤️8860477959_Russian 100% Genuine Escorts I...Call Girls In Sikandarpur Gurgaon ❤️8860477959_Russian 100% Genuine Escorts I...
Call Girls In Sikandarpur Gurgaon ❤️8860477959_Russian 100% Genuine Escorts I...lizamodels9
 
2024 Numerator Consumer Study of Cannabis Usage
2024 Numerator Consumer Study of Cannabis Usage2024 Numerator Consumer Study of Cannabis Usage
2024 Numerator Consumer Study of Cannabis UsageNeil Kimberley
 
Call Girls In Connaught Place Delhi ❤️88604**77959_Russian 100% Genuine Escor...
Call Girls In Connaught Place Delhi ❤️88604**77959_Russian 100% Genuine Escor...Call Girls In Connaught Place Delhi ❤️88604**77959_Russian 100% Genuine Escor...
Call Girls In Connaught Place Delhi ❤️88604**77959_Russian 100% Genuine Escor...lizamodels9
 
(8264348440) 🔝 Call Girls In Hauz Khas 🔝 Delhi NCR
(8264348440) 🔝 Call Girls In Hauz Khas 🔝 Delhi NCR(8264348440) 🔝 Call Girls In Hauz Khas 🔝 Delhi NCR
(8264348440) 🔝 Call Girls In Hauz Khas 🔝 Delhi NCRsoniya singh
 
BEST Call Girls In Old Faridabad ✨ 9773824855 ✨ Escorts Service In Delhi Ncr,
BEST Call Girls In Old Faridabad ✨ 9773824855 ✨ Escorts Service In Delhi Ncr,BEST Call Girls In Old Faridabad ✨ 9773824855 ✨ Escorts Service In Delhi Ncr,
BEST Call Girls In Old Faridabad ✨ 9773824855 ✨ Escorts Service In Delhi Ncr,noida100girls
 
Vip Female Escorts Noida 9711199171 Greater Noida Escorts Service
Vip Female Escorts Noida 9711199171 Greater Noida Escorts ServiceVip Female Escorts Noida 9711199171 Greater Noida Escorts Service
Vip Female Escorts Noida 9711199171 Greater Noida Escorts Serviceankitnayak356677
 
Lowrate Call Girls In Laxmi Nagar Delhi ❤️8860477959 Escorts 100% Genuine Ser...
Lowrate Call Girls In Laxmi Nagar Delhi ❤️8860477959 Escorts 100% Genuine Ser...Lowrate Call Girls In Laxmi Nagar Delhi ❤️8860477959 Escorts 100% Genuine Ser...
Lowrate Call Girls In Laxmi Nagar Delhi ❤️8860477959 Escorts 100% Genuine Ser...lizamodels9
 
Lowrate Call Girls In Sector 18 Noida ❤️8860477959 Escorts 100% Genuine Servi...
Lowrate Call Girls In Sector 18 Noida ❤️8860477959 Escorts 100% Genuine Servi...Lowrate Call Girls In Sector 18 Noida ❤️8860477959 Escorts 100% Genuine Servi...
Lowrate Call Girls In Sector 18 Noida ❤️8860477959 Escorts 100% Genuine Servi...lizamodels9
 
VIP Call Girl Jamshedpur Aashi 8250192130 Independent Escort Service Jamshedpur
VIP Call Girl Jamshedpur Aashi 8250192130 Independent Escort Service JamshedpurVIP Call Girl Jamshedpur Aashi 8250192130 Independent Escort Service Jamshedpur
VIP Call Girl Jamshedpur Aashi 8250192130 Independent Escort Service JamshedpurSuhani Kapoor
 
Catalogue ONG NƯỚC uPVC - HDPE DE NHAT.pdf
Catalogue ONG NƯỚC uPVC - HDPE DE NHAT.pdfCatalogue ONG NƯỚC uPVC - HDPE DE NHAT.pdf
Catalogue ONG NƯỚC uPVC - HDPE DE NHAT.pdfOrient Homes
 
BEST Call Girls In BELLMONT HOTEL ✨ 9773824855 ✨ Escorts Service In Delhi Ncr,
BEST Call Girls In BELLMONT HOTEL ✨ 9773824855 ✨ Escorts Service In Delhi Ncr,BEST Call Girls In BELLMONT HOTEL ✨ 9773824855 ✨ Escorts Service In Delhi Ncr,
BEST Call Girls In BELLMONT HOTEL ✨ 9773824855 ✨ Escorts Service In Delhi Ncr,noida100girls
 
Sales & Marketing Alignment: How to Synergize for Success
Sales & Marketing Alignment: How to Synergize for SuccessSales & Marketing Alignment: How to Synergize for Success
Sales & Marketing Alignment: How to Synergize for SuccessAggregage
 
VIP Kolkata Call Girl Howrah 👉 8250192130 Available With Room
VIP Kolkata Call Girl Howrah 👉 8250192130  Available With RoomVIP Kolkata Call Girl Howrah 👉 8250192130  Available With Room
VIP Kolkata Call Girl Howrah 👉 8250192130 Available With Roomdivyansh0kumar0
 
Progress Report - Oracle Database Analyst Summit
Progress  Report - Oracle Database Analyst SummitProgress  Report - Oracle Database Analyst Summit
Progress Report - Oracle Database Analyst SummitHolger Mueller
 

Recently uploaded (20)

(8264348440) 🔝 Call Girls In Keshav Puram 🔝 Delhi NCR
(8264348440) 🔝 Call Girls In Keshav Puram 🔝 Delhi NCR(8264348440) 🔝 Call Girls In Keshav Puram 🔝 Delhi NCR
(8264348440) 🔝 Call Girls In Keshav Puram 🔝 Delhi NCR
 
Enjoy ➥8448380779▻ Call Girls In Sector 18 Noida Escorts Delhi NCR
Enjoy ➥8448380779▻ Call Girls In Sector 18 Noida Escorts Delhi NCREnjoy ➥8448380779▻ Call Girls In Sector 18 Noida Escorts Delhi NCR
Enjoy ➥8448380779▻ Call Girls In Sector 18 Noida Escorts Delhi NCR
 
Marketing Management Business Plan_My Sweet Creations
Marketing Management Business Plan_My Sweet CreationsMarketing Management Business Plan_My Sweet Creations
Marketing Management Business Plan_My Sweet Creations
 
Call Girls Miyapur 7001305949 all area service COD available Any Time
Call Girls Miyapur 7001305949 all area service COD available Any TimeCall Girls Miyapur 7001305949 all area service COD available Any Time
Call Girls Miyapur 7001305949 all area service COD available Any Time
 
Intro to BCG's Carbon Emissions Benchmark_vF.pdf
Intro to BCG's Carbon Emissions Benchmark_vF.pdfIntro to BCG's Carbon Emissions Benchmark_vF.pdf
Intro to BCG's Carbon Emissions Benchmark_vF.pdf
 
Call Girls in Mehrauli Delhi 💯Call Us 🔝8264348440🔝
Call Girls in Mehrauli Delhi 💯Call Us 🔝8264348440🔝Call Girls in Mehrauli Delhi 💯Call Us 🔝8264348440🔝
Call Girls in Mehrauli Delhi 💯Call Us 🔝8264348440🔝
 
Call Girls In Sikandarpur Gurgaon ❤️8860477959_Russian 100% Genuine Escorts I...
Call Girls In Sikandarpur Gurgaon ❤️8860477959_Russian 100% Genuine Escorts I...Call Girls In Sikandarpur Gurgaon ❤️8860477959_Russian 100% Genuine Escorts I...
Call Girls In Sikandarpur Gurgaon ❤️8860477959_Russian 100% Genuine Escorts I...
 
2024 Numerator Consumer Study of Cannabis Usage
2024 Numerator Consumer Study of Cannabis Usage2024 Numerator Consumer Study of Cannabis Usage
2024 Numerator Consumer Study of Cannabis Usage
 
Call Girls In Connaught Place Delhi ❤️88604**77959_Russian 100% Genuine Escor...
Call Girls In Connaught Place Delhi ❤️88604**77959_Russian 100% Genuine Escor...Call Girls In Connaught Place Delhi ❤️88604**77959_Russian 100% Genuine Escor...
Call Girls In Connaught Place Delhi ❤️88604**77959_Russian 100% Genuine Escor...
 
(8264348440) 🔝 Call Girls In Hauz Khas 🔝 Delhi NCR
(8264348440) 🔝 Call Girls In Hauz Khas 🔝 Delhi NCR(8264348440) 🔝 Call Girls In Hauz Khas 🔝 Delhi NCR
(8264348440) 🔝 Call Girls In Hauz Khas 🔝 Delhi NCR
 
BEST Call Girls In Old Faridabad ✨ 9773824855 ✨ Escorts Service In Delhi Ncr,
BEST Call Girls In Old Faridabad ✨ 9773824855 ✨ Escorts Service In Delhi Ncr,BEST Call Girls In Old Faridabad ✨ 9773824855 ✨ Escorts Service In Delhi Ncr,
BEST Call Girls In Old Faridabad ✨ 9773824855 ✨ Escorts Service In Delhi Ncr,
 
Vip Female Escorts Noida 9711199171 Greater Noida Escorts Service
Vip Female Escorts Noida 9711199171 Greater Noida Escorts ServiceVip Female Escorts Noida 9711199171 Greater Noida Escorts Service
Vip Female Escorts Noida 9711199171 Greater Noida Escorts Service
 
Lowrate Call Girls In Laxmi Nagar Delhi ❤️8860477959 Escorts 100% Genuine Ser...
Lowrate Call Girls In Laxmi Nagar Delhi ❤️8860477959 Escorts 100% Genuine Ser...Lowrate Call Girls In Laxmi Nagar Delhi ❤️8860477959 Escorts 100% Genuine Ser...
Lowrate Call Girls In Laxmi Nagar Delhi ❤️8860477959 Escorts 100% Genuine Ser...
 
Lowrate Call Girls In Sector 18 Noida ❤️8860477959 Escorts 100% Genuine Servi...
Lowrate Call Girls In Sector 18 Noida ❤️8860477959 Escorts 100% Genuine Servi...Lowrate Call Girls In Sector 18 Noida ❤️8860477959 Escorts 100% Genuine Servi...
Lowrate Call Girls In Sector 18 Noida ❤️8860477959 Escorts 100% Genuine Servi...
 
VIP Call Girl Jamshedpur Aashi 8250192130 Independent Escort Service Jamshedpur
VIP Call Girl Jamshedpur Aashi 8250192130 Independent Escort Service JamshedpurVIP Call Girl Jamshedpur Aashi 8250192130 Independent Escort Service Jamshedpur
VIP Call Girl Jamshedpur Aashi 8250192130 Independent Escort Service Jamshedpur
 
Catalogue ONG NƯỚC uPVC - HDPE DE NHAT.pdf
Catalogue ONG NƯỚC uPVC - HDPE DE NHAT.pdfCatalogue ONG NƯỚC uPVC - HDPE DE NHAT.pdf
Catalogue ONG NƯỚC uPVC - HDPE DE NHAT.pdf
 
BEST Call Girls In BELLMONT HOTEL ✨ 9773824855 ✨ Escorts Service In Delhi Ncr,
BEST Call Girls In BELLMONT HOTEL ✨ 9773824855 ✨ Escorts Service In Delhi Ncr,BEST Call Girls In BELLMONT HOTEL ✨ 9773824855 ✨ Escorts Service In Delhi Ncr,
BEST Call Girls In BELLMONT HOTEL ✨ 9773824855 ✨ Escorts Service In Delhi Ncr,
 
Sales & Marketing Alignment: How to Synergize for Success
Sales & Marketing Alignment: How to Synergize for SuccessSales & Marketing Alignment: How to Synergize for Success
Sales & Marketing Alignment: How to Synergize for Success
 
VIP Kolkata Call Girl Howrah 👉 8250192130 Available With Room
VIP Kolkata Call Girl Howrah 👉 8250192130  Available With RoomVIP Kolkata Call Girl Howrah 👉 8250192130  Available With Room
VIP Kolkata Call Girl Howrah 👉 8250192130 Available With Room
 
Progress Report - Oracle Database Analyst Summit
Progress  Report - Oracle Database Analyst SummitProgress  Report - Oracle Database Analyst Summit
Progress Report - Oracle Database Analyst Summit
 

Bajaj Auto 4QFY2010 Result Update

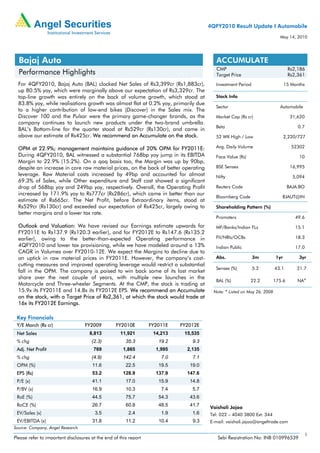
  • 1. 4QFY2010 Result Update I Automobile May 14, 2010 Bajaj Auto ACCUMULATE CMP Rs2,186 Performance Highlights Target Price Rs2,361 For 4QFY2010, Bajaj Auto (BAL) clocked Net Sales of Rs3,399cr (Rs1,883cr), Investment Period 15 Months up 80.5% yoy, which were marginally above our expectation of Rs3,329cr. The top-line growth was entirely on the back of volume growth, which stood at Stock Info 83.8% yoy, while realisations growth was almost flat at 0.2% yoy, primarily due Sector Automobile to a higher contribution of low-end bikes (Discover) in the Sales mix. The Discover 100 and the Pulsar were the primary game-changer brands, as the Market Cap (Rs cr) 31,620 company continues to launch new products under the two-brand umbrella. Beta 0.7 BAL’s Bottom-line for the quarter stood at Rs529cr (Rs130cr), and came in above our estimate of Rs425cr. We recommend an Accumulate on the stock. 52 WK High / Low 2,220/727 OPM at 22.9%; management maintains guidance of 20% OPM for FY2011E: Avg. Daily Volume 52302 During 4QFY2010, BAL witnessed a substantial 768bp yoy jump in its EBITDA Face Value (Rs) 10 Margin to 22.9% (15.2%). On a qoq basis too, the Margin was up by 90bp, despite an increase in core raw material prices, on the back of better operating BSE Sensex 16,995 leverage. Raw Material costs increased by 49bp and accounted for almost Nifty 5,094 69.3% of Sales, while Other expenditure and Staff cost showed a significant drop of 568bp yoy and 249bp yoy, respectively. Overall, the Operating Profit Reuters Code BAJA.BO increased by 171.9% yoy to Rs777cr (Rs286cr), which came in better than our Bloomberg Code BJAUT@IN estimate of Rs665cr. The Net Profit, before Extraordinary items, stood at Rs529cr (Rs130cr) and exceeded our expectation of Rs425cr, largely owing to Shareholding Pattern (%) better margins and a lower tax rate. Promoters 49.6 Outlook and Valuation: We have revised our Earnings estimate upwards for MF/Banks/Indian FLs 15.1 FY2011E to Rs137.9 (Rs120.3 earlier), and for FY2012E to Rs147.6 (Rs135.2 earlier), owing to the better-than-expected Operating performance in FII/NRIs/OCBs 18.3 4QFY2010 and lower tax provisioning, while we have modeled around a 13% Indian Public 17.0 CAGR in Volumes over FY2010-12E. We expect the Margins to decline due to an uptick in raw material prices in FY2011E. However, the company’s cost- Abs. 3m 1yr 3yr cutting measures and improved operating leverage would restrict a substantial Sensex (%) 5.2 43.1 21.7 fall in the OPM. The company is poised to win back some of its lost market share over the next couple of years, with multiple new launches in the BAL (%) 22.2 175.6 NA# Motorcycle and Three-wheeler Segments. At the CMP, the stock is trading at 15.9x its FY2011E and 14.8x its FY2012E EPS. We recommend an Accumulate Note: # Listed on May 26, 2008 on the stock, with a Target Price of Rs2,361, at which the stock would trade at 16x its FY2012E Earnings. Key Financials Y/E March (Rs cr) FY2009 FY2010E FY2011E FY2012E Net Sales 8,813 11,921 14,213 15,535 % chg (2.3) 35.3 19.2 9.3 Adj. Net Profit 769 1,865 1,995 2,135 % chg (4.9) 142.4 7.0 7.1 OPM (%) 11.6 22.5 19.5 19.0 EPS (Rs) 53.2 128.9 137.9 147.6 P/E (x) 41.1 17.0 15.9 14.8 P/BV (x) 16.9 10.3 7.4 5.7 RoE (%) 44.5 75.7 54.3 43.6 RoCE (%) 26.7 60.8 48.5 41.7 Vaishali Jajoo EV/Sales (x) 3.5 2.4 1.9 1.6 Tel: 022 – 4040 3800 Ext: 344 EV/EBITDA (x) 31.8 11.2 10.4 9.3 E-mail: vaishali.jajoo@angeltrade.com Source: Company, Angel Research 1 Please refer to important disclosures at the end of this report Sebi Registration No: INB 010996539
  • 2. Bajaj Auto I 4QFY2010 Result Update Exhibit 1: Financial Performance Update Y/E March (Rs cr) 4QFY10 4QFY09 % chg FY10 FY09 % chg Net Sales (include Other Op. Inc.) 3,399.5 1,883.4 80.5 11,920.9 8,813.0 35.3 Consumption of RM 2,236.7 1,241.7 80.1 7,650.6 6,089.1 25.6 (% of Sales) 65.8 65.9 64.2 69.1 Staff Costs 86.2 94.6 (8.9) 399.5 354.4 12.7 (% of Sales) 2.5 5.0 3.4 4.0 Purchases of TG 117.7 53.5 120.2 419.8 374.4 12.1 (% of Sales) 3.5 2.8 3.5 4.2 Other Expenses 181.8 207.8 (12.5) 858.5 792.9 8.3 (% of Sales) 5.3 11.0 7.2 9.0 Total Expenditure 2,622.4 1,597.6 64.1 9,328.4 7,610.7 22.6 Operating Profit 777.1 285.8 171.9 2,592.5 1,202.3 115.6 OPM 22.9 15.2 21.7 13.6 Interest (0.0) 5.2 (100.2) 6.0 21.0 (71.5) Depreciation 34.1 31.3 9.0 136.5 129.8 5.1 Other Income 42.5 22.9 85.5 122.5 111.7 9.7 PBT (excl. Extr. Items) 785.5 272.3 188.5 2,572.6 1,163.2 121.2 Extr. Income/(Expense) 49.4 82.9 - 165.0 207.1 - PBT (incl. Extr. Items) 736.2 189.3 288.8 2,407.6 956.1 151.8 (% of Sales) 21.7 10.1 20.2 10.8 Provision for Taxation 207.5 59.1 251.0 707.5 301.6 134.6 (% of PBT) 28.2 31.2 29.4 31.5 Reported PAT 528.7 130.2 306.0 1,700.1 654.5 159.8 PATM 15.6 6.9 14.3 7.4 Equity capital (cr) 144.7 144.7 101.2 101.2 EPS (Rs) 36.5 9.0 306.0 117.5 45.2 159.8 Source: Company, Angel Research Strong volume growth boosts top-line; Profit beats estimates: For 4QFY2010, Bajaj Auto (BAL) clocked Net Sales of Rs3,399cr (Rs1,883cr), up 80.5% yoy, which was marginally above our expectation of Rs3,329cr. The top-line growth was entirely on the back of volume growth, which stood at 83.8% yoy, while the realisations growth was almost flat at 0.2% yoy, primarily due to a higher contribution of low-end bikes (Discover) in the Sales mix. The Discover 100 and the Pulsar were the primary game- changer brands, as the company continues to launch new products under the two- brand umbrella. BAL’s Bottom-line for the quarter stood at Rs529cr (Rs130cr), and came in above our estimate of Rs425cr. Overall, a strong volume growth, a yoy decline in staff costs and effective operating cost management, have resulted in a substantial jump in the OPMs and the performance during the quarter. OPM at 22.9%; management maintains guidance of 20% OPM for FY2011E: During 4QFY2010, BAL witnessed a substantial 768bp yoy jump in its EBITDA Margin to 22.9% (15.2%). On a qoq basis too, the Margin was up by 90bp, despite an increase in core raw material prices, on the back of better operating leverage. Raw Material costs increased by 49bp and accounted for almost 69.3% of Sales, while Other expenditure and Staff cost showed a significant drop of 568bp yoy and 249bp yoy, respectively. Overall, the Operating Profit increased by 171.9% yoy to Rs777cr (Rs286cr), which came in better than our estimate of Rs665cr. The proposed increase in production at the Pantnagar plant, a focus on cost reductions and minimal sales promotion expenses contributed to BAL achieving better Margins. Net Profit up 306% yoy: The Net Profit, before Extraordinary items, stood at Rs529cr (Rs130cr) and exceeded our expectation of Rs425cr. BAL announced VRS for 2,331 workmen at its Akurdi plant, and decided to recognise expenditure amounting to Rs337cr over an appropriate period; for 4QFY2010, the company recognised Rs45.8cr. After deducting the Exceptional items amounting to Rs49.4cr (Rs82.9.cr), the Bottom-line grew by 306% yoy to Rs529cr (Rs130cr). The tax rate has declined by 304bp yoy, due to higher production at Uttarakhand. May 14, 2010 2
  • 3. Bajaj Auto I 4QFY2010 Result Update Conference Call – Key Highlights Volume guidance: The Management has guided for robust growth in total volumes during FY2011E, with expected sales of around 3.6-4mn units in FY2011E (2.85mn units in FY2010). This growth will primarily be on the back of robust volumes clocked by the three brands across segments: Discover, Pulsar (Two-Wheelers) and RE (Three-Wheelers). The two-wheeler segment is expected to grow by around 40% yoy in the Motorcycle segment in FY2011E, with the Three-Wheeler segment following at a yoy growth of around 18% yoy. This growth is expected to continue due to a slew of new launches under its primary brands in the next couple of quarters. Moreover, the company is also optimistic about export volumes, and is poised to achieve its target of 1.1mn vehicles for FY2011E. Additionally, it has guided for robust sales expected at a CAGR of 18%-20% over the next 2-3 years in the key markets of Africa, South-East Asia, Latin America and Sri-Lanka, with forays expected in other emerging markets. The BAL management believes that the elevated growth rates for the two wheeler industry in FY2010 at 24% were partially aided by the pent up demand of the previous years, and that growth rates will moderate in FY2011E to the trend levels of 12-14%. Exhibit 2: Motorcycle Segment volumes Units % Market Share (RHS) Volume (LHS) 800,000 100 700,000 80 600,000 60 500,000 40 400,000 20 300,000 0 200,000 (20) 100,000 (40) 0 (60) 1QFY2007 2QFY2007 3QFY2007 4QFY2007 1QFY2008 2QFY2008 3QFY2008 4QFY2008 1QFY2009 2QFY2009 3QFY2009 4QFY2009 1QFY2010 2QFY2010 3QFY2010 4QFY2010 Source: SIAM, Angel Research Exhibit 3: Three-Wheeler Segment volumes Units Market Share (RHS) Volume (LHS) % 100,000 80 90,000 60 80,000 40 70,000 20 60,000 0 50,000 (20) 40,000 (40) 30,000 (60) 1QFY2007 2QFY2007 3QFY2007 4QFY2007 1QFY2008 2QFY2008 3QFY2008 4QFY2008 1QFY2009 2QFY2009 3QFY2009 4QFY2009 1QFY2010 2QFY2010 3QFY2010 4QFY2010 Source: SIAM, Angel Research May 14, 2010 3
  • 4. Bajaj Auto I 4QFY2010 Result Update Target to achieve 34% market share in FY2011E: BAL maintained its market leadership in the 125cc-plus category, with a market share of around 46.7%. Its market share in the domestic Motorcycle Segment declined to around 21.9% in FY2009, which has improved to 24.3% in FY2010. The management believes that the full effect of new launches in 4QFY2010 helped the company to regain its market share. It expects to further increase its market share in the motorcycle segment to 34-35% in FY2011E. Operating Margins expected to be at around 20%: The company recorded robust margins in 4QFY2010 at 22.9%, higher on a qoq basis. The company had given a guidance of maintaining a healthy Margin level, at around 20% in FY2011, despite relatively higher Raw material costs, primarily on the back of cost-cutting efforts adopted at the operating level and better realisations in Exports, all of which it has realised in FY2010. Going ahead, the management has guided to maintain its margin above the 20% level for the next couple of quarters, despite an uptrend seen in input cost prices in the recent months. Also, the management is sanguine about maintaining the 18-20% margin range for FY2011E, on the back of better operating leverage on higher volumes, which is expected to offset the hike in raw material costs, to a certain extent. Further, a higher volume off-take from the Pantnagar plant (60,000 per month currently) will have a positive effect on the NPM. The management expects the production at the Pantnagar plant to increase to 70,000 per month in the June 2010 quarter, and to 1,20,000 per month in the later part of FY2011E. Capacity Expansion: Bajaj Auto has guided for capex of Rs250cr in FY2011E. It is scaling up production at its Uttarakhand plant to 1.2m units (from 0.6m units in FY2010). The company will incrementally produce the Discover range and the Pulsar 135cc bikes from there. The management also pointed that the capex over FY2012E would be determined by the roll out plans for the small car. Currency hedges: The company has hedged its entire FY2011E export exposure at Rs46.5/US$. May 14, 2010 4
  • 5. Bajaj Auto I 4QFY2010 Result Update Outlook and Valuation Overall, Two-wheeler sales improved in FY2010, owing to the various measures adopted by the government and positive developments on the macro-economic front. We believe that although the substantial ownership base of Two-wheelers results in reduced headroom for higher double-digit growth rates, the increased dependence on replacement demand is expected to sustain volumes. Moreover, the rural markets are expected to register better growth on account of the new demand arising from the relevant rural population, which is expected to help Two-wheeler companies in maintaining their growth momentum, registering an 8-9% CAGR in Volumes over the next few years. In the case of BAL, we have revised our Earnings estimate upwards for FY2011E to Rs137.9 (Rs120.3 earlier), and for FY2012E to Rs147.6 (Rs135.2 earlier), owing to its better-than-expected Operating performance in 4QFY2010 and lower tax provisioning, while we have modeled around a 13% CAGR in Volumes over FY2010-12E. We expect the Margins to decline on an uptick in raw material prices in FY2011E. However, the company’s cost-cutting measures and improved operating leverage would restrict a substantial fall in the OPM. The company is poised to win back some of its lost market share over the next couple of years, with multiple new launches in the Motorcycle and Three-wheeler Segments. At the CMP, the stock is trading at 15.9x its FY2011E and 14.8x its FY2012E EPS. We recommend an Accumulate on the stock, with a Target Price of Rs2,361, at which the stock would trade at 16x its FY2012E Earnings. Exhibit 4: One year forward P/E 60.0 50.0 40.0 30.0 20.0 10.0 - Aug-02 Aug-03 Aug-04 Aug-05 Aug-06 Aug-07 Aug-08 Aug-09 Dec-02 Dec-03 Dec-04 Dec-05 Dec-06 Dec-07 Dec-08 Dec-09 Apr-02 Apr-03 Apr-04 Apr-05 Apr-06 Apr-07 Apr-08 Apr-09 Apr-10 Absolute P/E 3 year Average P/E Source: C-line, Angel Research Exhibit 5: BAL - Premium/Discount to Sensex P/E 250% 200% 150% 100% 50% 0% -50% -100% Apr-02 Apr-03 Apr-04 Apr-05 Apr-06 Apr-07 Apr-08 Apr-09 Apr-10 Aug-02 Aug-03 Aug-04 Aug-05 Aug-06 Aug-07 Aug-08 Aug-09 Dec-02 Dec-03 Dec-04 Dec-05 Dec-06 Dec-07 Dec-08 Dec-09 Absolute Premium 3 year Average Premium Source: C-line, Angel Research May 14, 2010 5
  • 6. Bajaj Auto I 4QFY2010 Result Update Profit & Loss Statement (Rs cr) Y/E March FY2007 FY2008 FY2009 FY2010E FY2011E FY2012E Gross sales 10,639 9,690 9,050 12,118 15,126 16,832 Less: Excise duty 1,321.7 1,029.5 610.1 609.7 1,285.7 1,683.2 Net Sales 9,317 8,660 8,440 11,508 13,840 15,149 Other operating income 227.5 358.5 373.4 412.5 373.2 386.5 Total operating income 9,545 9,019 8,813 11,921 14,213 15,535 % chg - (5.5) (2.3) 35.3 19.2 9.3 Total Expenditure 8,146 7,855 7,831 9,328 11,515 12,664 Net Raw Materials 6,893 6,618 6,466 8,070 9,965 10,983 Other Mfg costs 249.1 216.4 192.2 - 207.6 227.2 Personnel 340.1 444.0 537.7 399.5 470.6 499.9 Other 663.7 576.8 635.2 858.5 871.9 954.4 EBITDA 1,399 1,164 982 2,592 2,698 2,871 % chg - (16.8) (15.7) 164.0 4.1 6.4 (% of Net Sales) 15.0 13.4 11.6 22.5 19.5 19.0 Depreciation& Amortisation 190.3 174.0 129.8 136.5 154.2 168.3 EBIT 1,209 990 852 2,456 2,544 2,703 % chg - (18.1) (14.0) 188.3 3.6 6.2 (% of Net Sales) 13.0 11.4 10.1 21.3 18.4 17.8 Interest & other Charges 5.3 5.2 21.0 6.0 19.6 19.6 Other Income 524.2 148.7 122.2 122.5 171.0 183.4 (% of PBT) 27.9 13.8 14.6 5.1 6.3 6.4 Recurring PBT 1,728 1,134 953 2,573 2,696 2,866 % chg - (34.4) (15.9) 169.9 4.8 6.3 Extraordinary (Expense)/Inc. 150.6 (52.8) (114.8) (165.0) - - PBT 1,878 1,081 838 2,408 2,696 2,866 Tax 489.6 378.0 298.7 707.5 700.8 730.9 (% of PBT) 26.1 35.0 35.6 29.4 26.0 25.5 PAT (reported) 1,238 756 655 1,700 1,995 2,135 ADJ. PAT 1,087 809 769 1,865 1,995 2,135 % chg - (25.6) (4.9) 142.4 7.0 7.1 (% of Net Sales) 11.7 9.3 9.1 16.2 14.4 14.1 Basic EPS (Rs) 107.5 55.9 53.2 128.9 137.9 147.6 Fully Diluted EPS (Rs) 107.5 55.9 53.2 128.9 137.9 147.6 % chg - (48.0) (4.9) 142.4 7.0 7.1 May 14, 2010 6
  • 7. Bajaj Auto I 4QFY2010 Result Update Balance Sheet (Rs cr) Y/E March FY2007 FY2008 FY2009 FY2010E FY2011E FY2012E SOURCES OF FUNDS Equity Share Capital 101.2 144.7 144.7 144.7 144.7 144.7 Preference Capital - - - - - - Reserves& Surplus 5,433 1,443 1,725 2,916 4,149 5,367 Shareholders Funds 5,534 1,588 1,870 3,060 4,293 5,512 Total Loans 1,625.4 1,334.3 1,570.0 1,570 1,570 1,570 Deferred Tax Liability 74.2 11.0 4.2 4.2 4.2 4.2 Total Liabilities 7,234 2,933 3,444 4,634 5,867 7,086 APPLICATION OF FUNDS Gross Block 3,179 2,984 3,334 3,596 3,954 4,208 Less: Acc. Depreciation 1,922 1,726 1,808 1,944 2,099 2,267 Net Block 1,256 1,258 1,526 1,652 1,856 1,941 Capital Work-in-Progress 26.9 34.7 22.1 36.0 39.5 42.1 Goodwill - - - - - - Investments 6,448 1,857 1,809 3,244 4,401 5,669 Current Assets 3,819 1,650 2,325 3,522 3,796 4,008 Cash 83.5 56.1 136.9 909.1 672.9 758.6 Loans & Advances 2,896 969 1,491 1,726 2,076 2,121 Other 840 625 697 887 1,048 1,129 Current liabilities 4,333 1,877 2,438 3,820 4,225 4,574 Net Current Assets (514.1) (227.6) (112.3) (298) (428.4) (566.0) Mis. Exp. not written off 17.5 10.5 199.6 - - - Total Assets 7,234 2,933 3,444 4,634 5,867 7,086 Cash Flow (Rs cr) Y/E March FY2007 FY2008 FY2009 FY2010E FY2011E FY2012E Profit before tax 1,878 1,081 838 2,408 2,696 2,866 Depreciation 190.3 174.0 129.8 136.5 154.2 168.3 Change in Working Capital 6.8 (203.6) 144.6 (176.0) 176.3 108.3 Less: Other income 903.9 193.2 403 (1,094) 458 134.7 Direct taxes paid 489.6 378.0 298.7 707.5 700.8 730.9 Cash Flow from Operations 681.7 480.2 411 2,754.9 1,867 2,277.3 (Inc.)/Dec. in Fixed Assets (287.1) 186.6 (337.1) (276) (361.5) (256.2) (Inc.)/Dec. in Investments (590.6) - 48.6 (1,435.6) (1,156.4) (1,268.3) (Inc.)/Dec. in loans and advances (93.7) (95.3) (141.4) 813.4 (366.4) 30.4 Other income 524.2 148.7 122.2 122.5 171.0 183.4 Cash Flow from Investing (447.1) 240.0 (307.7) (776) (1,713) (1,310.8) Issue of Equity - 43.5 - - - - Inc./(Dec.) in loans 158.3 (291.1) 235.7 - - - Dividend Paid (Incl. Tax) 461.5 473.5 338.6 372.4 677.1 761.7 Others (853.0) (973.5) (597.2) (1,579.0) (1,067.5) (1,642.6) Cash Flow from Financing (233.3) (747.6) (23.0) (1,207) (390.4) (880.8) Inc./(Dec.) in Cash 1.4 (27.4) 80.8 772.2 (236.2) 85.7 Opening Cash balances 82.1 83.5 56.1 136.9 909.1 672.9 Closing Cash balances 83.5 56.1 136.9 909.1 672.9 758.6 May 14, 2010 7
  • 8. Bajaj Auto I 4QFY2010 Result Update Key Ratios Y/E March FY2007 FY2008 FY2009 FY2010E FY2011E FY2012E Valuation Ratio (x) P/E (on FDEPS) 20.3 39.1 41.1 17.0 15.9 14.8 P/CEPS 15.5 34.0 40.3 15.8 14.7 13.7 P/BV 4.0 19.9 16.9 10.3 7.4 5.7 Dividend yield (%) 1.8 0.9 1.0 1.8 2.1 2.3 EV/Sales 2.5 3.2 3.5 2.4 1.9 1.6 EV/EBITDA 19.1 26.7 31.8 11.2 10.4 9.3 EV / Total Assets 3.7 10.6 9.1 6.3 4.8 3.8 Per Share Data (Rs) EPS (Basic) 107.5 55.9 53.2 128.9 137.9 147.6 EPS (fully diluted) 107.5 55.9 53.2 128.9 137.9 147.6 Cash EPS 141.2 64.3 54.2 138.3 148.5 159.2 DPS 40.0 20.0 22.0 40.0 45.0 50.0 Book Value 547.0 109.7 129.2 211.5 296.7 381.0 Dupont Analysis EBIT margin 13.0 11.4 10.1 21.3 18.4 17.8 Tax retention ratio 0.7 0.7 0.6 0.7 0.7 0.7 Asset turnover (x) 1.4 1.8 2.9 3.4 3.2 2.7 ROIC (Post-tax) 13.7 13.4 18.5 51.1 43.4 35.8 Cost of Debt (Post Tax) - - - - - - Leverage (x) - - - - - - Operating ROE 13.7 13.4 18.5 51.1 43.4 35.8 Returns (%) ROCE (Pre-tax) 17.8 19.5 26.7 60.8 48.5 41.7 Angel ROIC (Pre-tax) 16.9 34.4 25.8 65.9 49.0 42.7 ROE 21.1 22.7 44.5 75.7 54.3 43.6 Turnover ratios (x) Asset Turnover (Gross Block) 3.1 2.9 2.8 3.4 3.8 3.8 Inventory / Sales (days) 11.4 13.9 14.9 12.1 12.3 12.7 Receivables (days) 16.3 17.0 13.7 14.6 14.3 14.0 Payables (days) 53.4 53.6 48.8 39.4 38.0 41.1 WC cycle (ex-cash) (days) (22.9) (17.8) (11.0) (22.3) (29.6) (28.5) Solvency ratios (x) Net debt to equity (0.9) (0.4) (0.2) (0.8) (0.8) (0.9) Net debt to EBITDA (3.5) (0.5) (0.4) (1.0) (1.3) (1.7) Interest Coverage (EBIT / Int.) 226.3 191.9 40.6 410.7 129.6 137.7 May 14, 2010 8
  • 9. Bajaj Auto I 4QFY2010 Result Update Research Team Tel: 022-4040 3800 E-mail: research@angeltrade.com Website: www.angeltrade.com DISCLAIMER This document is solely for the personal information of the recipient, and must not be singularly used as the basis of any investment decision. Nothing in this document should be construed as investment or financial advice. Each recipient of this document should make such investigations as they deem necessary to arrive at an independent evaluation of an investment in the securities of the companies referred to in this document (including the merits and risks involved), and should consult their own advisors to determine the merits and risks of such an investment. Angel Securities Limited, its affiliates, directors, its proprietary trading and investment businesses may, from time to time, make investment decisions that are inconsistent with or contradictory to the recommendations expressed herein. The views contained in this document are those of the analyst, and the company may or may not subscribe to all the views expressed within. Reports based on technical and derivative analysis center on studying charts of a stock's price movement, outstanding positions and trading volume, as opposed to focusing on a company's fundamentals and, as such, may not match with a report on a company's fundamentals. The information in this document has been printed on the basis of publicly available information, internal data and other reliable sources believed to be true, and is for general guidance only. Angel Securities Limited has not independently verified all the information contained within this document. Accordingly, we cannot testify, nor make any representation or warranty, express or implied, to the accuracy, contents or data contained within this document. While Angel Securities Limited endeavours to update on a reasonable basis the information discussed in this material, there may be regulatory, compliance, or other reasons that prevent us from doing so. This document is being supplied to you solely for your information, and its contents, information or data may not be reproduced, redistributed or passed on, directly or indirectly. Angel Securities Limited and its affiliates may seek to provide or have engaged in providing corporate finance, investment banking or other advisory services in a merger or specific transaction to the companies referred to in this report, as on the date of this report or in the past. Neither Angel Securities Limited, nor its directors, employees or affiliates shall be liable for any loss or damage that may arise from or in connection with the use of this information. Note: Please refer to the important `Stock Holding Disclosure' report on the Angel website (Research Section). Disclosure of Interest Statement Bajaj Auto 1. Analyst ownership of the stock No 2. Angel and its Group companies ownership of the stock No 3. Angel and its Group companies’ Directors ownership of the stock No 4. Broking relationship with company covered No Note: We have not considered any Exposure below Rs 1 lakh for Angel and its Group companies Address: Acme Plaza, ‘A’ Wing, 3rd Floor, M.V. Road, Opp. Sangam Cinema, Andheri (E), Mumbai - 400 059. Tel : (022) 3952 4568 / 4040 3800 Angel Broking Ltd: BSE Sebi Regn No : INB 010996539 / CDSL Regn No: IN - DP - CDSL - 234 - 2004 / PMS Regn Code: PM/INP000001546 Angel Securities Ltd:BSE: INB010994639/INF010994639 NSE: INB230994635/INF230994635 Membership numbers: BSE 028/NSE:09946 Angel Capital & Debt Market Ltd: INB 231279838 / NSE FNO: INF 231279838 / NSE Member code -12798 Angel Commodities Broking (P) Ltd: MCX Member ID: 12685 / FMC Regn No: MCX / TCM / CORP / 0037 NCDEX : Member ID 00220 / FMC Regn No: NCDEX / TCM / CORP / 0302 May 14, 2010 9