call girls in Nand Nagri (DELHI) 🔝 >༒9953330565🔝 genuine Escort Service 🔝✔️✔️
Elecon
1. 1QFY2011 Result Update | Capital Goods
August 3, 2010
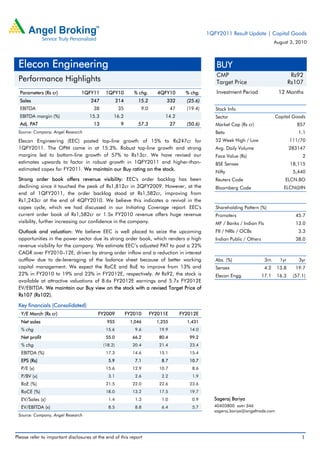
Elecon Engineering BUY
CMP Rs92
Performance Highlights Target Price Rs107
Parameters (Rs cr) 1QFY11 1QFY10 % chg. 4QFY10 % chg. Investment Period 12 Months
Sales 247 214 15.2 332 (25.6)
EBITDA 38 35 9.0 47 (19.4) Stock Info
EBITDA margin (%) 15.3 16.2 14.2 Sector Capital Goods
Adj. PAT 13 9 57.3 27 (50.6) Market Cap (Rs cr) 857
Source: Company, Angel Research Beta 1.1
Elecon Engineering (EEC) posted top-line growth of 15% to Rs247cr for 52 Week High / Low 111/70
1QFY2011. The OPM came in at 15.3%. Robust top-line growth and strong Avg. Daily Volume 283147
margins led to bottom-line growth of 57% to Rs13cr. We have revised our Face Value (Rs) 2
estimates upwards to factor in robust growth in 1QFY2011 and higher-than- BSE Sensex 18,115
estimated capex for FY2011. We maintain our Buy rating on the stock.
Nifty 5,440
Strong order book offers revenue visibility: EEC's order backlog has been Reuters Code ELCN.BO
declining since it touched the peak of Rs1,812cr in 3QFY2009. However, at the Bloomberg Code ELCN@IN
end of 1QFY2011, the order backlog stood at Rs1,582cr, improving from
Rs1,243cr at the end of 4QFY2010. We believe this indicates a revival in the
capex cycle, which we had discussed in our Initiating Coverage report. EEC's Shareholding Pattern (%)
current order book of Rs1,582cr or 1.5x FY2010 revenue offers huge revenue Promoters 45.7
visibility, further increasing our confidence in the company. MF / Banks / Indian Fls 13.0
Outlook and valuation: We believe EEC is well placed to seize the upcoming FII / NRIs / OCBs 3.3
opportunities in the power sector due its strong order book, which renders a high Indian Public / Others 38.0
revenue visibility for the company. We estimate EEC’s adjusted PAT to post a 22%
CAGR over FY2010–12E, driven by strong order inflow and a reduction in interest
outflow due to de-leveraging of the balance sheet because of better working Abs. (%) 3m 1yr 3yr
capital management. We expect the RoCE and RoE to improve from 13% and Sensex 4.2 13.8 19.7
22% in FY2010 to 19% and 23% in FY2012E, respectively. At Rs92, the stock is Elecon Engg. 17.1 16.3 (57.1)
available at attractive valuations of 8.6x FY2012E earnings and 5.7x FY2012E
EV/EBITDA. We maintain our Buy view on the stock with a revised Target Price of
Rs107 (Rs102).
Key financials (Consolidated)
Y/E March (Rs cr) FY2009 FY2010 FY2011E FY2012E
Net sales 955 1,046 1,255 1,431
% chg 15.6 9.6 19.9 14.0
Net profit 55.0 66.2 80.4 99.2
% chg (18.2) 20.4 21.4 23.4
EBITDA (%) 17.3 14.6 15.1 15.4
EPS (Rs) 5.9 7.1 8.7 10.7
P/E (x) 15.6 12.9 10.7 8.6
P/BV (x) 3.1 2.6 2.2 1.9
RoE (%) 21.5 22.0 22.6 23.6
RoCE (%) 18.0 13.2 17.5 19.7
EV/Sales (x) 1.4 1.3 1.0 0.9 Sageraj Bariya
EV/EBITDA (x) 8.5 8.8 6.4 5.7 40403800 extn 346
sageraj.bariya@angeltrade.com
Source: Company, Angel Research
Please refer to important disclosures at the end of this report 1
2. Elecon Engineering | 1QFY2011 Result Update
Exhibit 1: Quarterly performance
Y/E March (Rs cr) 1QFY2011 1QFY2010 % chg FY2010 FY2009 % chg
Total sales 246.0 212.3 1035.9 942.3
Other op. income 1.1 2.2 10.4 12.7
Net revenue 247.2 214.5 15.2 1046.4 955.1 9.6
Raw material cost 169.2 142.4 626.9 503.0
Gross profit 76.9 69.9 409.0 439.3
Gross margin 31.2 32.9 39.5 46.6
Employee expenses 12.0 8.9 43.5 43.8
As % of sales 4.8 4.2 4.2 4.6
Other expenditure 28.1 28.4 2168.9 2385.9
As % of sales 11.4 13.2 11.0 11.5
Total expenditure 209.3 179.7 895.1 792.5
Operating profit 37.9 34.8 9.0 151.2 162.6 (7.0)
OPM (%) 15.3 16.2 14.6 17.3
Depreciation 8.9 7.5 33.1 22.1
EBIT 29.0 27.3 6.2 118.1 140.4 (15.9)
EBIT (%) 11.7 12.7 11.4 14.9
Other income 0.1 0.0 24.8 9.6
Interest 9.8 14.4 52.6 61.9
PBT (excl of ext items) 19.2 12.9 49.2 90.3 88.1 2.5
Ext items 0.0 0.0 0.0 0.0
PBT (incl of ext items) 19.2 12.9 90.3 88.1
Tax 5.8 4.4 24.1 30.6
Reported PAT 13.4 8.5 66.2 57.5
Minority & other item 0.0 0.0 0.0 2.5
Adj PAT 13.4 8.5 57.3 66.2 55.0 20.4
Report EPS (Rs) 1.4 0.9 7.1 6.2
Adj EPS (Rs) 1.4 0.9 7.1 5.9
Source: Company, Angel Research
Sales momentum picking up
EEC reported robust 1QFY2011 revenue of Rs247cr (up 15% yoy), supported by
16% growth in the material handling division (MHE) and 11% growth in the gear
division. We believe sales momentum that picked up pace in 4QFY2010 is likely to
be maintained on account of strong order intake.
August 3, 2010 2
4. Elecon Engineering | 1QFY2011 Result Update
Robust order book
Order inflow for 1QFY2011 increased 657% yoy to Rs1,840cr. The order backlog
stood at Rs1,582cr (MHE: Rs1,253cr, Gears: Rs329cr). Strong order inflow was
driven by demand from core sectors such as power, cement, steel and mining. The
company booked new order worth nearly Rs600cr against Rs700cr booked in
FY2010. Given the ongoing live-enquiries worth Rs2,500cr, management
continues to expect better traction in orders from major industries including power
and steel.
Exhibit 5: Order inflow trend Exhibit 6: Order backlog
700 1,600 1,582
585
560 1,492
1,500
420 1,424
(Rs cr)
(Rs cr)
286 1,400 1,362
280 210
187 188
104 1,300
140 77 1,243
0 1,200
2QFY09
3QFY09
4QFY09
1QFY10
2QFY10
3QFY10
4QFY10
1QFY10
2QFY10
3QFY10
4QFY10
1QFY11
Source: Company, Angel Research Source: Company, Angel Research
Lower interest cost leads to higher PAT growth
Although EEC’s EBITDA margin for the quarter declined by 90bp to 15.3%, PAT
managed to grow by 57% to Rs13.4cr on account of lower interest outflow. Interest
outflow for the quarter decreased by 32% to Rs9.8cr (Rs14.4cr).
Exhibit 7: Declining interest outflow Exhibit 8: ...leads to higher PAT growth
16 30 80
14
13 25 60
11 12 20 40
12
(Rs cr)
10
(Rs cr)
15 20
(%)
10 0
8
5 (20)
0 (40)
4
1QFY10 2QFY10 3QFY10 4QFY10 1QFY11
1QFY10 2QFY10 3QFY10 4QFY10 1QFY11
PAT % YoY
Source: Company, Angel Research Source: Company, Angel Research
August 3, 2010 4
5. Elecon Engineering | 1QFY2011 Result Update
Investment arguments
Recovery augurs well for the MHE sector: The Rs5,700cr (FY2009) domestic MHE
industry has a strong correlation with industrial growth. According to the latest
data, IIP grew by an impressive 11.5% in May 2010, with the manufacturing sector
growing by 12.3%. Going ahead, we expect industrial capex to maintain its growth
path, with the economy reviving (indicated by the improvement in IIP), continued
government focus on infrastructure spends and pick-up in private capex.
Opportunity abound: The overall emerging opportunities in the MHE industry are
estimated to be around Rs32,500cr over FY2009–12E (Source: Crisil Research
Report). This augurs well for companies providing MHE solutions. Nonetheless,
near-term growth for MHE companies is expected to be driven by the high capex
likely to be incurred in the company’s key core sectors, such as power and coal.
Robust order book: EEC's current order book is pegged at Rs1,582cr (end of
1QFY2011), translating into 1.5x FY2010 revenue. The MHE segment is the
largest contributor to the company’s order book, with a share of Rs1,253cr,
followed by the gears segment, which accounts for Rs329cr of the order book.
We expect order inflows to gather pace in FY2011, which is evident from around
Rs600cr of order booking that the company registered in 1QFY2011. We estimate
EEC's order inflow to increase by a 40% CAGR over FY2010–12E.
Outlook and valuation
We have revised our estimates upwards to take into account the company’s robust
order book and higher-than-estimated capex for FY2011.
Exhibit 9: Change in estimates
Old New % chg
Parameters (Rs cr) FY11 FY12 FY11 FY12 FY11 FY12
Sales 1,201 1,358 1,255 1,431 5 5
EBITDA 179 208 188 219 5 5
EBITDA margin (%) 15 15 15 15
PAT 73 95 80 99 10 4
Source: Company, Angel Research
We believe an improving economic scenario (indicated by the revival in IIP),
continued government focus on infrastructure spends and pick-up in private capex
augur well for companies providing MHE solutions for the core sectors of the
economy. The government's strong focus on the power sector, through ’Power for
all by 2012’, is expected to result in an expansion of the sector’s generation
capacity, leading to higher opportunities for MHE players, while the mining and
port sectors would throw up combined opportunities worth around Rs7,000cr.
We believe EEC is well placed to seize the upcoming opportunities in the power
sector due its strong order book of Rs1,582cr at the end of 1QFY2011 (1.5x
FY2010 sales), which renders a high revenue visibility for the company.
August 3, 2010 5
6. Elecon Engineering | 1QFY2011 Result Update
We estimate the company's adjusted PAT to register a 22% CAGR over
FY2010–12E, driven by the stronger order inflow and a reduction in interest
outflow due to de-leveraging of the balance sheet on account of better working
capital management. We expect the RoCE and RoE to improve from 13% and 22%
in FY2010 to 19% and 23% in FY2012E, respectively.
At Rs92, the stock is available at attractive valuations of 8.6x FY2012E earnings
and 5.7x FY2012E EV/EBITDA. We maintain our Buy view on the stock with a
revised Target Price of Rs107 (Rs102).
Exhibit 10: Key assumption
Parameters (Rs cr) FY2011E FY2012E
Order backlog (Y/E) 1,171 1,321
Order inflow 1,172 1,569
% yoy 46 34
Sales 1,393 1,589
% yoy 26 14
Order book to sales (x) 0.8 0.8
Source: Company, Angel Research
Exhibit 11: One-year forward rolling P/E band
350
300
250
200
(Rs)
150
100
50
0
Apr-06
Jul-06
Apr-07
Jul-07
Apr-08
Jul-08
Apr-09
Jul-09
Apr-10
Jul-10
Oct-06
Oct-07
Oct-08
Oct-09
Jan-07
Jan-08
Jan-09
Jan-10
Price 5x 10x 15x 20x 25x
Source: C-line, Angel Research
August 3, 2010 6
11. Elecon Engineering | 1QFY2011 Result Update
Research Team Tel: 022 - 4040 3800 E-mail: research@angeltrade.com Website: www.angeltrade.com
DISCLAIMER
This document is solely for the personal information of the recipient, and must not be singularly used as the basis of any investment
decision. Nothing in this document should be construed as investment or financial advice. Each recipient of this document should make
such investigations as they deem necessary to arrive at an independent evaluation of an investment in the securities of the companies
referred to in this document (including the merits and risks involved), and should consult their own advisors to determine the merits and
risks of such an investment.
Angel Broking Limited, its affiliates, directors, its proprietary trading and investment businesses may, from time to time, make
investment decisions that are inconsistent with or contradictory to the recommendations expressed herein. The views contained in this
document are those of the analyst, and the company may or may not subscribe to all the views expressed within.
Reports based on technical and derivative analysis center on studying charts of a stock's price movement, outstanding positions and
trading volume, as opposed to focusing on a company's fundamentals and, as such, may not match with a report on a company's
fundamentals.
The information in this document has been printed on the basis of publicly available information, internal data and other reliable
sources believed to be true, but we do not represent that it is accurate or complete and it should not be relied on as such, as this
document is for general guidance only. Angel Broking Limited or any of its affiliates/ group companies shall not be in any way
responsible for any loss or damage that may arise to any person from any inadvertent error in the information contained in this report.
Angel Broking Limited has not independently verified all the information contained within this document. Accordingly, we cannot testify,
nor make any representation or warranty, express or implied, to the accuracy, contents or data contained within this document. While
Angel Broking Limited endeavours to update on a reasonable basis the information discussed in this material, there may be regulatory,
compliance, or other reasons that prevent us from doing so.
This document is being supplied to you solely for your information, and its contents, information or data may not be reproduced,
redistributed or passed on, directly or indirectly.
Angel Broking Limited and its affiliates may seek to provide or have engaged in providing corporate finance, investment banking or
other advisory services in a merger or specific transaction to the companies referred to in this report, as on the date of this report or in
the past.
Neither Angel Broking Limited, nor its directors, employees or affiliates shall be liable for any loss or damage that may arise from or in
connection with the use of this information.
Note: Please refer to the important `Stock Holding Disclosure' report on the Angel website (Research Section). Also, please
refer to the latest update on respective stocks for the disclosure status in respect of those stocks. Angel Broking Limited and
its affiliates may have investment positions in the stocks recommended in this report.
Disclosure of Interest Statement Elecon Engineering
1. Analyst ownership of the stock No
2. Angel and its Group companies ownership of the stock No
3. Angel and its Group companies' Directors ownership of the stock No
4. Broking relationship with company covered No
Note: We have not considered any Exposure below Rs 1 lakh for Angel, its Group companies and Directors.
Ratings (Returns) : Buy (> 15%) Accumulate (5% to 15%) Neutral (-5 to 5%)
Reduce (-5% to 15%) Sell (< -15%)
August 3, 2010 11