1. 4QFY2010 Result Update I Auto Ancillary
May 4, 2010
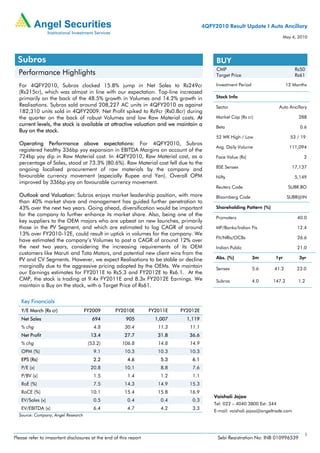
Subros BUY
CMP Rs50
Performance Highlights Target Price Rs61
For 4QFY2010, Subros clocked 15.8% jump in Net Sales to Rs249cr Investment Period 12 Months
(Rs215cr), which was almost in line with our expectation. Top-line increased
primarily on the back of the 48.5% growth in Volumes and 14.2% growth in Stock Info
Realisations. Subros sold around 208,227 AC units in 4QFY2010 as against Sector Auto Ancillary
182,310 units sold in 4QFY2009. Net Profit spiked to Rs9cr (Rs0.8cr) during
the quarter on the back of robust Volumes and low Raw Material costs. At Market Cap (Rs cr) 288
current levels, the stock is available at attractive valuation and we maintain a
Beta 0.6
Buy on the stock.
52 WK High / Low 53 / 19
Operating Performance above expectations: For 4QFY2010, Subros
Avg. Daily Volume 111,094
registered healthy 336bp yoy expansion in EBITDA Margins on account of the
724bp yoy dip in Raw Material cost. In 4QFY2010, Raw Material cost, as a Face Value (Rs) 2
percentage of Sales, stood at 73.3% (80.6%). Raw Material cost fell due to the
BSE Sensex 17,137
ongoing localised procurement of raw materials by the company and
favourable currency movement (especially Rupee and Yen). Overall OPM Nifty 5,149
improved by 336bp yoy on favourable currency movement.
Reuters Code SUBR.BO
Outlook and Valuation: Subros enjoys market leadership position, with more Bloomberg Code SUBR@IN
than 40% market share and management has guided further penetration to
43% over the next two years. Going ahead, diversification would be important Shareholding Pattern (%)
for the company to further enhance its market share. Also, being one of the
Promoters 40.0
key suppliers to the OEM majors who are upbeat on new launches, primarily
those in the PV Segment, and which are estimated to log CAGR of around MF/Banks/Indian FIs 12.4
13% over FY2010-12E, could result in uptick in volumes for the company. We
FII/NRIs/OCBs 26.6
have estimated the company’s Volumes to post a CAGR of around 12% over
the next two years, considering the increasing requirements of its OEM Indian Public 21.0
customers like Maruti and Tata Motors, and potential new client wins from the
PV and CV Segments. However, we expect Realisations to be stable or decline Abs. (%) 3m 1yr 3yr
marginally due to the aggressive pricing adopted by the OEMs. We maintain Sensex 5.6 41.2 23.0
our Earnings estimates for FY2011E to Rs5.3 and FY2012E to Rs6.1. At the
CMP, the stock is trading at 9.4x FY2011E and 8.3x FY2012E Earnings. We Subros 4.0 147.2 1.2
maintain a Buy on the stock, with a Target Price of Rs61.
Key Financials
Y/E March (Rs cr) FY2009 FY2010E FY2011E FY2012E
Net Sales 694 905 1,007 1,119
% chg 4.8 30.4 11.3 11.1
Net Profit 13.4 27.7 31.8 36.6
% chg (53.2) 106.8 14.8 14.9
OPM (%) 9.1 10.3 10.3 10.3
EPS (Rs) 2.2 4.6 5.3 6.1
P/E (x) 20.8 10.1 8.8 7.6
P/BV (x) 1.5 1.4 1.2 1.1
RoE (%) 7.5 14.3 14.9 15.3
RoCE (%) 10.1 15.4 15.8 16.9
Vaishali Jajoo
EV/Sales (x) 0.5 0.4 0.4 0.3
Tel: 022 – 4040 3800 Ext: 344
EV/EBITDA (x) 6.4 4.7 4.2 3.3
E-mail: vaishali.jajoo@angeltrade.com
Source: Company, Angel Research
1
Please refer to important disclosures at the end of this report Sebi Registration No: INB 010996539
2. Subros I 4QFY2010 Result Update
Performance above expectations: For 4QFY2010, Subros clocked 15.8% jump in
Net Sales to Rs249cr (Rs215cr), which was almost in line with our expectation.
Top-line increased primarily on the back of the 48.5% growth in Volumes and
14.2% growth in Realisations. Subros sold around 208,227 AC units in 4QFY2010
as against 182,310 units sold in 4QFY2009. Net Profit spiked to Rs9cr (Rs0.8cr) in
4QFY2010 on the back of robust Volumes and low Raw Material costs. Robust
performance of Maruti’s A-Star and Mahindra & Mahindra’s high-Volume Xylo
supported the company’s Volume growth during the quarter. The company’s
Bottom-line spiked by a substantial 1,056% yoy to Rs9cr (Rs0.8cr), which was above
our expectation of Rs7.8cr.
Margins expand by a healthy 336bp: For 4QFY2010, Subros registered healthy
336bp yoy expansion in EBITDA Margins on account of the 724bp yoy dip in Raw
Material costs. In 4QFY2010, Raw Material cost, as a percentage of Sales, stood at
73.3% (80.6%). Input costs registered a decline owing to the ongoing localised
procurement of raw materials by the company and favourable currency movement
(especially Rupee and Yen). Overall, the company improved its OPM by 336bp yoy
capturing benefits of favourable currency movement. Staff costs and Other
Expenditure however, increased by 234bp and 154bp yoy during the quarter,
respectively.
Net Profit jumps substantially on lower Raw Material cost: Net Profit spiked to Rs9cr
(Rs0.8cr) in 4QFY2010 on robust Volumes and lower Operating costs. Depreciation
and Interest costs fell 0.6% and 30% yoy respectively, also supported the jump in
NPM and Net Profit for the quarter.
Exhibit 1: 4QFY2010 Performance
Y/E Mar (Rs cr) 4QFY10 4QFY10 % chg FY10 FY09 % chg
Net Sales 249.4 215.4 15.8 905.5 694.5 30.4
Consumption of RM 183.0 173.6 5.4 671.9 516.4 30.1
(% of Sales) 73.3 80.6 74.2 74.4
Staff Costs 15.8 8.6 83.2 54.5 44.2 23.3
(% of Sales) 6.3 4.0 6.0 6.4
Other Expenses 24.5 17.9 37.3 86.2 70.8 21.7
(% of Sales) 9.8 8.3 9.5 10.2
Total Expenditure 223.3 200.1 11.6 812.5 631.3 28.7
Operating Profit 26.2 15.3 70.5 93.0 63.2 47.2
OPM 10.5 7.1 10.3 9.1
Interest 3.4 4.9 (30.0) 16.0 14.6 9.9
Depreciation 9.8 9.9 (0.6) 38.6 31.6 22.4
Other Income 0.3 0.7 (64.4) 1.1 1.6 (26.9)
PBT (excl. Extr. Items) 12.9 0.5 2,285.2 38.4 17.0 125.3
Extr. Income/(Expense) - - - - - -
PBT (incl. Extr. Items) 13.1 1.3 934.6 39.5 18.6 112.5
(% of Sales) 5.3 0.6 4.4 2.7
Provision for Taxation 4.1 0.5 740.8 11.8 5.2 127.5
(% of PBT) 1.7 0.2 1.3 0.7
Reported PAT 9.0 0.8 1,056.4 27.7 13.4 106.8
PATM (%) 3.6 0.4 3.1 1.9
Equity shares (cr) 12.0 12.0 12.0 12.0
EPS (Rs) 1.5 0.1 1,056.4 4.6 2.2 106.8
Source: Company, Angel Research
May 4, 2010 2
3. Subros I 4QFY2010 Result Update
Outlook and Valuation
A market leader and largest player in the domestic car AC market, Subros enjoys
more than 40% market share. The company has managed to garner high market
share on the back of its strong technological backed by Denso and Suzuki. Further,
in view of growing passenger vehicle (PV) volumes, the company has ramped up
capacity to 7,50,000 units per annum and proposed to further expand capacities to
1,000,000 million units per annum.
Currently, Subros has a narrow base in terms of clients (Maruti, M&M and TML),
segments (OEMs), markets (caters only to domestic demand) and type of automobile
(passenger vehicles). Despite this, Subros enjoys market leadership position, with
more than 40% market share and management has guided further penetration to
43% over the next two years. Going ahead, diversification would be important for
the company to further enhance its market share. Also, being one of the key
suppliers to the OEM majors who are upbeat on new launches, primarily those in
the PV Segment, which are estimated to log CAGR of around 13% over FY2010-
12E, could result in uptick in volumes for the company.
We have estimated the company’s Volumes to post a CAGR of around 12% over the
next two years, considering the increasing requirements of its OEM customers like
Maruti and Tata Motors, and potential new client wins from the PV and CV
Segments. However, we expect Realisations to be stable or decline marginally due to
the aggressive pricing adopted by the OEMs. We maintain our Earnings estimates
for FY2011E to Rs5.3 and FY2012E to Rs6.1. At the CMP, the stock is trading at
9.4x FY2011E and 8.3x FY2012E Earnings. We maintain a Buy on the stock, with a
Target Price of Rs61.
Exhibit 2: One year forward P/E band
80
70 13x
60
10x
50
40
7x
30
4x
20
10
0
Apr-02
Oct-02
Apr-03
Oct-03
Apr-04
Oct-04
Apr-05
Oct-05
Apr-06
Oct-06
Apr-07
Oct-07
Apr-08
Oct-08
Apr-09
Oct-09
Apr-10
Source: C-Line, Angel Research
May 4, 2010 3
7. Subros I 4QFY2010 Result Update
Research Team Tel: 022-4040 3800 E-mail: research@angeltrade.com Website: www.angeltrade.com
DISCLAIMER
This document is solely for the personal information of the recipient, and must not be singularly used as the basis of any investment decision. Nothing in this
document should be construed as investment or financial advice. Each recipient of this document should make such investigations as they deem necessary to
arrive at an independent evaluation of an investment in the securities of the companies referred to in this document (including the merits and risks involved),
and should consult their own advisors to determine the merits and risks of such an investment.
Angel Securities Limited, its affiliates, directors, its proprietary trading and investment businesses may, from time to time, make investment decisions that are
inconsistent with or contradictory to the recommendations expressed herein. The views contained in this document are those of the analyst, and the company
may or may not subscribe to all the views expressed within.
Reports based on technical and derivative analysis center on studying charts of a stock's price movement, outstanding positions and trading volume, as
opposed to focusing on a company's fundamentals and, as such, may not match with a report on a company's fundamentals.
The information in this document has been printed on the basis of publicly available information, internal data and other reliable sources believed to be true,
and are for general guidance only. Angel Securities Limited has not independently verified all the information contained within this document. Accordingly,
we cannot testify, nor make any representation or warranty, express or implied, to the accuracy, contents or data contained within this document. While
Angel Securities Limited endeavours to update on a reasonable basis the information discussed in this material, there may be regulatory, compliance, or
other reasons that prevent us from doing so.
This document is being supplied to you solely for your information, and its contents, information or data may not be reproduced, redistributed or passed on,
directly or indirectly.
Angel Securities Limited and its affiliates may seek to provide or have engaged in providing corporate finance, investment banking or other advisory services
in a merger or specific transaction to the companies referred to in this report, as on the date of this report or in the past.
Neither Angel Securities Limited nor its directors, employees and affiliates shall be liable for any loss or damage that may arise from or in connection with the
use of this information.
Note: Please refer to the important `Stock Holding Disclosure' report on the Angel website (Research Section).
Disclosure of Interest Statement Subros
1. Analyst ownership of the stock No
2. Angel and its Group companies ownership of the stock No
3. Angel and its Group companies’ Directors ownership of the stock No
4. Broking relationship with company covered No
Note: We have not considered any Exposure below Rs 1 lakh for Angel and its Group companies.
Address: Acme Plaza, ‘A’ Wing, 3rd Floor, M.V. Road, Opp. Sangam Cinema, Andheri (E), Mumbai - 400 059.
Tel : (022) 3952 4568 / 4040 3800
Angel Broking Ltd: BSE Sebi Regn No : INB 010996539 / CDSL Regn No: IN - DP - CDSL - 234 - 2004 / PMS Regn Code: PM/INP000001546 Angel Securities Ltd:BSE: INB010994639/INF010994639 NSE:
INB230994635/INF230994635 Membership numbers: BSE 028/NSE:09946
Angel Capital & Debt Market Ltd: INB 231279838 / NSE FNO: INF 231279838 / NSE Member code -12798 Angel Commodities Broking (P) Ltd: MCX Member ID: 12685 / FMC Regn No: MCX / TCM /
CORP / 0037 NCDEX : Member ID 00220 / FMC Regn No: NCDEX / TCM / CORP / 0302
May 4, 2010 7