1. 4QFY2010 Result Update I Consumer Durables
May 19, 2010
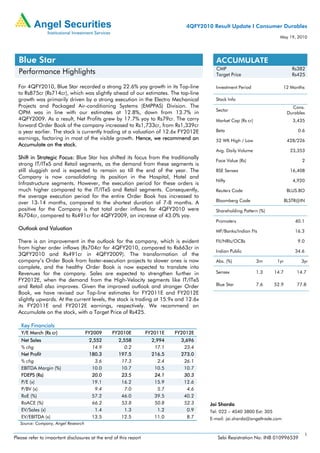
Blue Star ACCUMULATE
CMP Rs382
Performance Highlights Target Price Rs425
For 4QFY2010, Blue Star recorded a strong 22.6% yoy growth in its Top-line Investment Period 12 Months
to Rs875cr (Rs714cr), which was slightly ahead of our estimates. The top-line
growth was primarily driven by a strong execution in the Electro Mechanical Stock Info
Projects and Packaged Air-conditioning Systems (EMPPAS) Division. The Cons.
Sector
OPM was in line with our estimates at 12.8%, down from 13.7% in Durables
4QFY2009. As a result, Net Profits grew by 17.7% yoy to Rs79cr. The carry Market Cap (Rs cr) 3,435
forward Order Book of the company increased to Rs1,733cr, from Rs1,339cr
a year earlier. The stock is currently trading at a valuation of 12.6x FY2012E Beta 0.6
earnings, factoring in most of the visible growth. Hence, we recommend an 52 WK High / Low 428/226
Accumulate on the stock.
Avg. Daily Volume 23,353
Shift in Strategic Focus: Blue Star has shifted its focus from the traditionally
Face Value (Rs) 2
strong IT/ITeS and Retail segments, as the demand from these segments is
still sluggish and is expected to remain so till the end of the year. The BSE Sensex 16,408
Company is now consolidating its position in the Hospital, Hotel and
Nifty 4,920
Infrastructure segments. However, the execution period for these orders is
much higher compared to the IT/ITeS and Retail segments. Consequently, Reuters Code BLUS.BO
the average execution period for the entire Order Book has increased to
over 13-14 months, compared to the shortest duration of 7-8 months. A Bloomberg Code BLSTR@IN
positive for the Company is that total order inflows for 4QFY2010 were Shareholding Pattern (%)
Rs704cr, compared to Rs491cr for 4QFY2009, an increase of 43.0% yoy.
Promoters 40.1
Outlook and Valuation MF/Banks/Indian FIs 16.3
There is an improvement in the outlook for the company, which is evident FII/NRIs/OCBs 9.0
from higher order inflows (Rs704cr for 4QFY2010, compared to Rs663cr in
Indian Public 34.6
3QFY2010 and Rs491cr in 4QFY2009). The transformation of the
company’s Order Book from faster-execution projects to slower ones is now Abs. (%) 3m 1yr 3yr
complete, and the healthy Order Book is now expected to translate into
Revenues for the company. Sales are expected to strengthen further in Sensex 1.3 14.7 14.7
FY2012E, when the demand from the High-Velocity segments like IT/ITeS
and Retail also improves. Given the improved outlook and stronger Order Blue Star 7.6 52.9 77.8
Book, we have revised our Top-line estimates for FY2011E and FY2012E
slightly upwards. At the current levels, the stock is trading at 15.9x and 12.6x
its FY2011E and FY2012E earnings, respectively. We recommend an
Accumulate on the stock, with a Target Price of Rs425.
Key Financials
Y/E March (Rs cr) FY2009 FY2010E FY2011E FY2012E
Net Sales 2,552 2,558 2,994 3,696
% chg 14.9 0.2 17.1 23.4
Net Profit 180.3 197.5 216.5 273.0
% chg 3.6 17.3 2.4 26.1
EBITDA Margin (%) 10.0 10.7 10.5 10.7
FDEPS (Rs) 20.0 23.5 24.1 30.3
P/E (x) 19.1 16.2 15.9 12.6
P/BV (x) 9.4 7.0 5.7 4.6
RoE (%) 57.2 46.0 39.5 40.2
RoACE (%) 66.2 53.8 50.8 52.3 Jai Sharda
EV/Sales (x) 1.4 1.3 1.2 0.9 Tel: 022 – 4040 3800 Ext: 305
EV/EBITDA (x) 13.5 12.5 11.0 8.7 E-mail: jai.sharda@angeltrade.com
Source: Company, Angel Research
1
Please refer to important disclosures at the end of this report Sebi Registration No: INB 010996539
2. Blue Star I 4QFY2010 Result Update
Exhibit 1: 4QFY2010 Financial Performance
Y/E March (Rs cr) 4QFY10 3QFY10 % chg 4QFY09 % chg FY2010 FY2009 % chg
(qoq) (yoy)
Net Sales 874.7 595.6 46.9 713.7 22.6 2,549.4 2,519.4 1.2
Consumption of RM 644.2 457.4 40.8 510.8 26.1 1,882.1 1,874.3 0.4
(% of Sales) 73.6 76.8 71.6 73.8 74.4
Staff Costs 48.1 43.0 11.9 48.1 (0.1) 184.9 182.3 1.4
(% of Sales) 5.5 7.2 6.7 7.3 7.2
Other Expenses 70.5 38.9 81.6 57.0 23.8 183.3 186.5 (1.7)
(% of Sales) 8.1 6.5 8.0 7.2 7.4
Total Expenditure 762.8 539.2 41.5 615.9 23.9 2,250.3 2,243.0 0.3
Operating Profit 112.0 56.4 98.6 97.8 - 299.2 276.4 8.2
OPM 12.8 9.5 13.7 11.7 11.0
Interest 2.5 0.9 177.8 5.4 (53.4) 8.5 17.3 (51.0)
Depreciation 9.1 8.8 4.2 7.1 28.6 34.7 5.9 34.2
Other Income 2.7 0.3 786.7 2.2 19.8 6.7 4.9 35.2
PBT (excl. Extr. Items) 103.0 47.0 119.0 87.5 17.7 262.7 238.2 10.3
Extr.
- 8.7 - 14.0 -
Income/(Expense)
PBT (incl. Extr. Items) 103.0 55.8 84.8 87.5 17.7 276.6 238.2 16.1
(% of Sales) 11.8 9.4 12.3 10.9 9.5
Provision for
24.5 13.4 82.3 20.8 17.6 65.1 57.9 12.4
Taxation
(% of PBT) 23.8 24.1 23.8 23.5 24.3
Reported PAT 78.5 42.3 85.5 66.7 17.7 211.5 180.3 17.3
PATM 9.0 7.1 9.4 8.3 7.2
Equity shares (cr) 9.0 9.0 9.0 9.0 9.0
EPS (Rs) 8.7 4.7 85.5 7.4 17.7 23.5 20.0 17.3
Adjusted PAT 78.5 33.6 133.7 66.7 17.7 197.5 180.3 9.6
Source: Company, Angel Research
Segment-wise Performance
The Electro Mechanical Projects and Packaged Air-conditioning Systems (EMPPACS)
Division registered a strong 24.5% yoy increase in Sales for the quarter to Rs613cr
(Rs492cr). The EBIT of the Division stood at Rs79cr, implying an EBIT Margin of
12.9%.
Sales of the Cooling Products (CP) Division stood at Rs187cr (Rs160cr) for
4QFY2010, an increase of 16.5% yoy. The EBIT of the Division came in at Rs29cr,
while the EBIT Margin stood at 15.4% for 4QFY2010.
The Professional Electronics and Industrial Systems (PEIS) Division posted a decent
growth of 15.6% yoy to Rs55cr (Rs47cr). The EBIT of the Division came in at Rs20cr,
while the EBIT Margin stood at 36.2% for 4QFY2010.
May 19, 2010 2
3. Blue Star I 4QFY2010 Result Update
Exhibit 2: Segment Wise Performance
Y/E March 4QFY09 3QFY10 4QFY10 % chg % chg
(Rs cr) Rs cr Rs cr Rs cr qoq yoy
Total Revenue
A) EMPPACS 492.2 462.8 613.0 32.5 24.5
B) Cooling Products 160.4 95.4 186.9 95.9 16.5
C) PEIS 47.3 34.9 54.7 56.7 15.6
Total 699.9 593.1 854.6 44.1 22.1
Less: Inter-Segmental Revenue - - -
Net Sales 699.9 593.1 854.6 44.1 22.1
EBIT
A) EMPPACS 78.0 47.7 79.0 65.8 1.3
B) Cooling Products 23.0 9.0 28.7 219.5 25.0
C) PEIS 10.7 8.7 19.8 129.1 85.1
EBIT Margin (%)
A) EMPPACS 15.8 10.3 12.9 259bp (296)bp
B) Cooling Products 14.3 9.4 15.4 594bp 105bp
C) PEIS 22.6 24.8 36.2 1145bp 1360bp
Source: Company, Angel Research
Low-velocity projects to contribute more to incremental Revenues: Lower demand
from commercial office space catering to the IT/ITeS and Retail segments is expected
to continue till the end of 2010. On the other hand, strong demand from the
Hospitality, Healthcare, Power and Education segments has led to an increase in
their share of the order book. The company is witnessing acceptance in the Electrical
and Plumbing contracts space. Going forward, the company hopes to increase its
Market Share in this space to over 20% within the next three years. Notably, all these
segments have high execution periods. Sales in the High-Velocity commercial office
space are expected to increase in FY2012E.
Other developments
The Company has announced a final dividend of Rs8/share for FY2010 (400% of
the Face Value).
Outlook and Valuation
We have revised our estimates upwards for Sales in FY2011E and FY2012E, by 6.7%
and 10.3%, respectively. We have maintained our OPM estimates at 10.5% and
10.7% for FY2011E and FY2012E, respectively. As a result of the higher Sales
estimates, our EPS estimates now stand at Rs24.1 and Rs30.3 in FY2011E and
FY2012E, respectively.
Exhibit 3: Revised Estimates
Rs cr Old New % chg
FY2011E FY2012E FY2011E FY2012E FY2011E FY2012E
Sales 2,805 3,350 2,994 3,696 6.7 10.3
EBITDA 295 357 314 395 6.2 10.5
EBITDA % 10.5 10.7 10.5 10.7
PAT 202.1 250.8 217 273 7.2 8.9
EPS 22.5 27.9 24.1 30.3 7.2 8.9
Source: Company, Angel Research
The demand situation for FY2011E remains tentative for the company. However,
things are expected to continue improving through the year. We expect the situation
to improve considerably in FY2012E, with a revival in Sales in the office segment. At
the CMP, the stock is trading at 15.9x and 12.6x its FY2011E and FY2012E
Earnings, respectively. Given an improvement in the outlook, we recommend an
Accumulate on the stock, with a Target Price of Rs425.
May 19, 2010 3
4. Blue Star I 4QFY2010 Result Update
Exhibit 4: One year forward P/E band
600
500
400
300
(Rs)
200
100
0
Apr-04 Apr-05 Apr-06 Apr-07 Apr-08 Apr-09 Apr-10
Price 8x 11x 14x 17x 20x
Source: Company, Angel Research
May 19, 2010 4
5. Blue Star I 4QFY2010 Result Update
Profit & Loss Statement (Rs cr)
Y/E March FY2007 FY2008 FY2009 FY2010 FY2011E FY2012E
Gross sales 1,595 2,222 2,552 2,558 2,994 3,696
Less: Excise duty - - - - - -
Net Sales 1,595 2,222 2,552 2,558 2,994 3,696
Other operating income - - - - - -
Total operating income 1,595 2,222 2,552 2,558 2,994 3,696
% chg 36.2 39.3 14.9 0.2 17.1 23.4
Total Expenditure 1,484 1,999 2,296 2,283 2,680 3,301
Net Raw Materials 1,243 1,691 1,950 1,882 2,257 2,790
Other Mfg costs 49 68 68 - 93 115
Personnel 117 145 182 185 210 248
Other 75 95 97 216 120 148
EBITDA 110 223 256 275 314 395
% chg 33.2 102.4 14.8 7.3 14.2 25.8
(% of Net Sales) 6.9 10.0 10.0 10.7 10.5 10.7
Depreciation& Amortisation 21 22 26 35 30 35
EBIT 89 201 230 240 283 360
% chg 33.7 125.2 14.4 4.3 18.1 27.0
(% of Net Sales) 5.6 9.0 9.0 9.4 9.5 9.7
Interest & other Charges 10 8 14 8 2 1
Other Income 13 49 22 31 16 16
(% of PBT) 13.9 20.0 9.1 11.9 5.4 4.3
Recurring PBT 93 242 238 263 297 375
% chg 34.1 161.5 (1.5) 10.3 13.2 26.1
Extraordinary Expense/(Inc.) 1 25 - - - -
PBT (reported) 92 217 238 263 297 375
Tax 21 68 58 65 81 102
(% of PBT) 23.3 31.3 24.3 24.8 27.2 27.2
PAT (reported) 70 149 180 198 217 273
Add: Share of earnings of
- - - - - -
associate
Less: Minority interest (MI) - - - - - -
Prior period items - - - - - -
PAT after MI (reported) 70 149 180 198 217 273
ADJ. PAT 70 149 180 198 217 273
% chg 43.0 111.7 21.1 9.6 9.6 26.1
(% of Net Sales) 4.4 6.7 7.1 7.7 7.2 7.4
Basic EPS (Rs) 7.9 19.4 20.0 23.5 24.1 30.3
Fully Diluted EPS (Rs) 7.9 19.4 20.0 23.5 24.1 30.3
% chg 45.6 144.6 3.6 17.3 2.4 26.1
May 19, 2010 5
6. Blue Star I 4QFY2010 Result Update
Balance Sheet (Rs cr)
Y/E March FY2007 FY2008 FY2009 FY2010E FY2011E FY2012E
SOURCES OF FUNDS
Equity Share Capital 18 18 18 18 18 18
Preference Capital - - - - - -
Reserves& Surplus 195 246 349 474 588 734
Shareholders Funds 213 264 367 492 606 752
Minority Interest
Total Loans 89 37 24 9 9 9
Deferred Tax Liability (Net) 7 4 1 (1) - -
Total Liabilities 309 304 391 499 615 761
APPLICATION OF FUNDS
Gross Block 231 273 333 351 381 435
Less: Acc. Depreciation 117 135 145 180 210 245
Net Block 114 138 188 171 170 190
Capital Work-in-Progress 2 18 25 28 27 26
Goodwill - - - - - -
Investments 5 5 4 4 4 4
Current Assets 733 1,034 1,149 1,393 1,607 1,952
Cash 5 3 6 13 41 48
Loans & Advances 169 257 293 132 329 370
Inventories 209 290 207 258 315 397
Debtors 351 484 643 628 921 1,137
Other - - - 361 - -
Current liabilities 548 892 975 1,097 1,194 1,411
Net Current Assets 184 142 174 296 413 541
Mis. Exp. not written off 2 1 1 - - -
Total Assets 309 304 391 499 615 761
Cash Flow Statement (Rs cr)
Y/E March FY2007 FY2008 FY2009 FY2010E FY2011E FY2012E
Profit before tax 93 223 254 362 353 410
Depreciation 21 22 26 35 30 35
(Inc.)/ Dec. in Working Capital 37 129 6 (274) 107 (81)
Less: Other income 13 49 22 31 16 16
Direct taxes paid 21 68 58 65 81 102
Cash Flow from Operations 117 258 206 26 394 246
(Inc.)/ Dec. in Fixed Assets (24) (21) (165) (128) (157) (191)
(Inc.)/ Dec. in Investments (0) 1 0 0 - -
(Inc.)/ Dec. in loans and advances (78) (88) (35) 160 (197) (40)
Other income 13 49 22 31 16 16
Cash Flow from Investing (90) (60) (178) 64 (338) (215)
Issue of Equity - - - - - -
Inc./(Dec.) in loans 13 (53) (13) (15) - -
Dividend Paid (Incl. Tax) 31 74 74 84 105 126
Others (9) (74) 62 17 77 102
Cash Flow from Financing (27) (200) (25) (82) (28) (24)
Inc./(Dec.) in Cash - (2) 3 8 28 7
Opening Cash balances 5 5 3 6 13 41
Closing Cash balances 5 3 6 13 41 48
May 19, 2010 6
8. Blue Star I 4QFY2010 Result Update
Research Team Tel: 022-4040 3800 E-mail: research@angeltrade.com Website: www.angeltrade.com
DISCLAIMER
This document is solely for the personal information of the recipient, and must not be singularly used as the basis of any investment decision. Nothing in this
document should be construed as investment or financial advice. Each recipient of this document should make such investigations as they deem necessary to
arrive at an independent evaluation of an investment in the securities of the companies referred to in this document (including the merits and risks involved),
and should consult their own advisors to determine the merits and risks of such an investment.
Angel Securities Limited, its affiliates, directors, its proprietary trading and investment businesses may, from time to time, make investment decisions that are
inconsistent with or contradictory to the recommendations expressed herein. The views contained in this document are those of the analyst, and the company
may or may not subscribe to all the views expressed within.
Reports based on technical and derivative analysis center on studying charts of a stock's price movement, outstanding positions and trading volume, as
opposed to focusing on a company's fundamentals and, as such, may not match with a report on a company's fundamentals.
The information in this document has been printed on the basis of publicly available information, internal data and other reliable sources believed to be true,
and is for general guidance only. Angel Securities Limited has not independently verified all the information contained within this document. Accordingly, we
cannot testify, nor make any representation or warranty, express or implied, to the accuracy, contents or data contained within this document. While Angel
Securities Limited endeavours to update on a reasonable basis the information discussed in this material, there may be regulatory, compliance, or other
reasons that prevent us from doing so.
This document is being supplied to you solely for your information, and its contents, information or data may not be reproduced, redistributed or passed on,
directly or indirectly.
Angel Securities Limited and its affiliates may seek to provide or have engaged in providing corporate finance, investment banking or other advisory services
in a merger or specific transaction to the companies referred to in this report, as on the date of this report or in the past.
Neither Angel Securities Limited, nor its directors, employees or affiliates shall be liable for any loss or damage that may arise from or in connection with the
use of this information.
Note: Please refer to the important `Stock Holding Disclosure' report on the Angel website (Research Section).
Disclosure of Interest Statement Blue Star
1. Analyst ownership of the stock No
2. Angel and its Group companies ownership of the stock No
3. Angel and its Group companies’ Directors ownership of the stock No
4. Broking relationship with company covered No
Note: We have not considered any Exposure below Rs 1 lakh for Angel and its Group companies.
.
Address: Acme Plaza, ‘A’ Wing, 3rd Floor, M.V. Road, Opp. Sangam Cinema, Andheri (E), Mumbai - 400 059.
Tel : (022) 3952 4568 / 4040 3800
Angel Broking Ltd: BSE Sebi Regn No : INB 010996539 / CDSL Regn No: IN - DP - CDSL - 234 - 2004 / PMS Regn Code: PM/INP000001546 Angel Securities Ltd:BSE: INB010994639/INF010994639 NSE:
INB230994635/INF230994635 Membership numbers: BSE 028/NSE:09946
Angel Capital & Debt Market Ltd: INB 231279838 / NSE FNO: INF 231279838 / NSE Member code -12798 Angel Commodities Broking (P) Ltd: MCX Member ID: 12685 / FMC Regn No: MCX / TCM /
CORP / 0037 NCDEX : Member ID 00220 / FMC Regn No: NCDEX / TCM / CORP / 0302
May 19, 2010 8