Pratibha ind Result Update 4 qfy2010-110510
•
0 likes•148 views

Pratibha Industries reported financial results for the fourth quarter of fiscal year 2010 that were in line with expectations. Operating margins improved significantly due to a reduction in raw material costs, boosting the bottom line. However, the company paid taxes at the marginal rate rather than claiming tax benefits. While the results were decent, the analyst maintains a neutral outlook on the stock given that positives are already reflected in the price.

Recommended
More Related Content
What's hot
What's hot (20)
Viewers also liked
Viewers also liked (20)
Similar to Pratibha ind Result Update 4 qfy2010-110510
Similar to Pratibha ind Result Update 4 qfy2010-110510 (20)
More from Angel Broking
More from Angel Broking (20)
Pratibha ind Result Update 4 qfy2010-110510
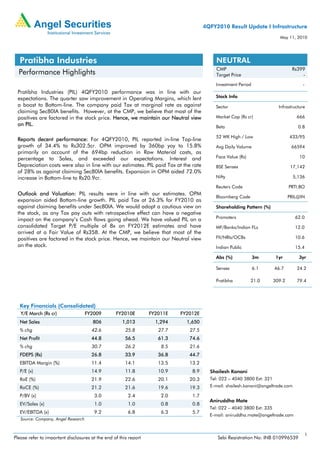
- 1. 4QFY2010 Result Update I Infrastructure May 11, 2010 Pratibha Industries NEUTRAL CMP Rs399 Performance Highlights Target Price - Investment Period - Pratibha Industries (PIL) 4QFY2010 performance was in line with our expectations. The quarter saw improvement in Operating Margins, which lent Stock Info a boost to Bottom-line. The company paid Tax at marginal rate as against Sector Infrastructure claiming Sec80IA benefits. However, at the CMP, we believe that most of the positives are factored in the stock price. Hence, we maintain our Neutral view Market Cap (Rs cr) 666 on PIL. Beta 0.8 52 WK High / Low 433/95 Reports decent performance: For 4QFY2010, PIL reported in-line Top-line growth of 34.4% to Rs302.5cr. OPM improved by 360bp yoy to 15.8% Avg Daily Valume 66594 primarily on account of the 694bp reduction in Raw Material costs, as percentage to Sales, and exceeded our expectations. Interest and Face Value (Rs) 10 Depreciation costs were also in line with our estimates. PIL paid Tax at the rate BSE Sensex 17,142 of 28% as against claiming Sec80IA benefits. Expansion in OPM aided 72.0% increase in Bottom-line to Rs20.9cr. Nifty 5,136 Reuters Code PRTI.BO Outlook and Valuation: PIL results were in line with our estimates. OPM Bloomberg Code PRIL@IN expansion aided Bottom-line growth. PIL paid Tax at 26.3% for FY2010 as against claiming benefits under Sec80IA. We would adopt a cautious view on Shareholding Pattern (%) the stock, as any Tax pay outs with retrospective effect can have a negative Promoters 62.0 impact on the company’s Cash flows going ahead. We have valued PIL on a consolidated Target P/E multiple of 8x on FY2012E estimates and have MF/Banks/Indian FLs 12.0 arrived at a Fair Value of Rs358. At the CMP, we believe that most of the positives are factored in the stock price. Hence, we maintain our Neutral view FII/NRIs/OCBs 10.6 on the stock. Indian Public 15.4 Abs (%) 3m 1yr 3yr Sensex 6.1 46.7 24.2 Pratibha 21.0 309.2 79.4 Key Financials (Consolidated) Y/E March (Rs cr) FY2009 FY2010E FY2011E FY2012E Net Sales 806 1,013 1,294 1,650 % chg 42.6 25.8 27.7 27.5 Net Profit 44.8 56.5 61.3 74.6 % chg 30.7 26.2 8.5 21.6 FDEPS (Rs) 26.8 33.9 36.8 44.7 EBITDA Margin (%) 11.4 14.1 13.5 13.2 P/E (x) 14.9 11.8 10.9 8.9 Shailesh Kanani RoE (%) 21.9 22.6 20.1 20.3 Tel: 022 – 4040 3800 Ext: 321 RoCE (%) 21.2 21.6 19.6 19.3 E-mail: shailesh.kanani@angeltrade.com P/BV (x) 3.0 2.4 2.0 1.7 Aniruddha Mate EV/Sales (x) 1.0 1.0 0.8 0.8 Tel: 022 – 4040 3800 Ext: 335 EV/EBITDA (x) 9.2 6.8 6.3 5.7 E-mail: aniruddha.mate@angeltrade.com Source: Company, Angel Research 1 Please refer to important disclosures at the end of this report Sebi Registration No: INB 010996539
- 2. Pratibha Industries I 4QFY2010 Result Update Exhibit 1: 4QFY2010 Performance (Consolidated) Y/E March (Rs cr) 4QFY10 4QFY09 % chg FY2010 FY2009 % chg Net Sales 302.5 225.1 34.4 1013.4 807.3 25.5 Total Expenditure 254.8 197.7 28.9 870.5 714.1 21.9 Operating Profit 47.7 27.4 74.1 142.9 93.2 53.3 OPM (%) 15.8 12.2 360bp 14.1 11.5 260bp Interest 14.7 7.0 109.3 52.2 34.1 53.4 Depreciation 3.9 3.0 32.1 14.0 7.1 97.1 Non Operating Income - 0.0 - 0.0 3.4 - Non recurring items - - - - - - Profit Before Tax 29.0 17.4 66.9 76.6 55.4 38.2 Tax 8.1 5.2 54.8 20.1 10.7 - Reported PAT 20.9 12.2 72.0 56.5 44.7 26.3 PAT (%) 6.9 5.4 150bp 5.6 5.5 10bp EPS (Rs) 12.5 7.3 72.0 33.9 26.8 26.3 Source: Company, Angel Research Retrospective Tax Payments – A Concern PIL’s Tax payments have being varying between 12.2% (1QFY2009) to 30.1% (4QFY2009) reverting back to 20.0% (3QFY2010) levels, as the company claims Section 80IA benefits. For FY2010, PIL paid tax at 26.3% as against 19.3% in FY2009. We believe that PIL claiming Tax benefits under Section 80IA will be a dampener going ahead, as it may have to pay Tax at the marginal tax rate, with retrospective effect thereby affecting cash flows. Exhibit 2: PIL – Lowest Tax payers among peers 40.0 30.1 35.0 27.9 26.9 30.0 20.0 19.6 25.0 20.0 12.4 12.2 15.0 10.0 5.0 - 1QFY09 2QFY09 3QFY09 4QFY09 1QFY10 2QFY10 3QFY10 Pratibha Industries Patel Engineering IVRCL Infra Nagarjuna Const. Source: Company, Angel Research May 11, 2010 2
- 3. Pratibha Industries I 4QFY2010 Result Update Strong Order Book PIL has an outstanding Order Book position of around Rs3,600cr or 3.5x FY2010E Revenues. The Order Book is spread across the verticals of Water, Urban Infrastructure and Road Segments Outlook and Valuation Infrastructure development is top priority with the Government of India. Hence, the government in the Eleventh Five-Year Plan has allocated US $500bn towards the sector. Irrigation, Water Supply and Sanitation together account for almost 20% of this projected outlay. State governments like Andhra Pradesh have also been focusing on developing Irrigation facilities. PIL stands to gain from the government’s focus on the Infrastructure Sector particularly, Water related segments. PIL is primarily focused on Water Supply related infrastructure projects. At Rs399, the stock trades at 8.9x FY2012E Earnings and 1.7x FY2012E P/BV. We have valued PIL at a Target P/E multiple of 8x on FY2012E consolidated numbers and have arrived at a Fair Value of Rs358. We believe that the current price discounts most of the positives. Our talks with management indicates that PIL is in the midst of a fund raising exercise and any further developments on this front could pose an upside risk to our estimates. We maintain our Neutral view on the stock. May 11, 2010 3
- 4. Pratibha Industries I 4QFY2010 Result Update Profit & Loss Statement (Consolidated) (Rs cr) Y/E March FY2007 FY2008 FY2009 FY2010E FY2011E FY2012E Net Sales 300.8 565.1 805.8 1,013.4 1,294.0 1,649.8 Other operating income - - - - - - Total operating income 300.8 565.1 805.8 1,013.4 1,294.0 1,649.8 % chg 72.5 87.9 42.6 25.8 27.7 27.5 Total Expenditure 263.8 499.1 714.1 870.5 1,119.3 1,432.8 Net Raw Materials 238.3 445.0 615.3 771.2 980.9 1,255.5 Other Mfg costs - - - - - - Personnel 8.3 17.3 34.6 38.5 50.5 64.3 Other 17.2 36.8 64.3 68.3 88.0 112.7 EBITDA 36.9 66.0 91.7 142.9 174.7 217.1 % chg 78.1 78.6 38.9 55.9 22.2 24.3 (% of Net Sales) 12.3 11.7 11.4 14.1 13.5 13.2 Depreciation& Amortisation 1.1 3.6 7.1 14.0 15.1 17.8 EBIT 35.8 62.4 84.6 128.9 159.6 199.3 % chg 78.3 74.2 35.5 52.4 23.8 24.9 (% of Net Sales) 11.9 11.0 10.5 12.7 12.3 12.1 Interest & other Charges 12.3 22.3 34.1 52.2 73.6 94.5 Other Income - 0.1 5.0 - 5.5 6.6 (% of PBT) - 0.1 9.0 - 6.1 5.9 Share in profit of Associates - - - - - - Recurring PBT 23.5 40.2 55.5 76.6 91.5 111.3 % chg 72.5 71.1 38.1 38.1 19.4 21.6 Extraordinary Expense/(Inc.) - - - - - - PBT (reported) 23.5 40.2 55.5 76.6 91.5 111.3 Tax 3.1 5.9 10.7 20.1 30.2 36.7 (% of PBT) 13.3 14.7 19.3 26.3 33.0 33.0 PAT (reported) 20.4 34.3 44.8 56.5 61.3 74.6 Add: Share of earnings of associate - - - - - - Less: Minority interest (MI) - - - - - - Prior period items - - - - - - PAT after MI (reported) 20.4 34.3 44.8 56.5 61.3 74.6 ADJ. PAT 20.4 34.3 44.8 56.5 61.3 74.6 % chg 62.3 68.3 30.7 26.2 8.5 21.6 (% of Net Sales) 6.8 6.1 5.6 5.6 4.7 4.5 Basic EPS (Rs) 12.2 20.5 26.8 33.9 36.8 44.7 Fully Diluted EPS (Rs) 12.2 20.5 26.8 33.9 36.8 44.7 % chg 62.5 68.3 30.7 26.2 8.5 21.6 May 11, 2010 4
- 5. Pratibha Industries I 4QFY2010 Result Update Balance Sheet (Consolidated) (Rs cr) Y/E March FY2007 FY2008 FY2009 FY2010E FY2011E FY2012E SOURCES OF FUNDS Equity Share Capital 14.3 16.7 16.7 16.7 16.7 16.7 Preference Capital - - - - - - Reserves& Surplus 80.6 167.2 208.1 259.6 316.1 385.7 Shareholders Funds 94.9 183.9 224.8 276.3 332.7 402.4 Minority Interest - - - - - - Total Loans 132.8 132.8 248.4 433.4 572.6 747.3 Deferred Tax Liability 0.5 1.8 6.2 6.2 6.2 6.2 Total Liabilities 228.2 318.5 479.4 715.9 911.5 1,155.9 APPLICATION OF FUNDS Gross Block 24.5 99.0 168.3 267.6 335.6 403.1 Less: Acc. Depreciation 3.3 6.9 13.9 28.0 43.1 60.9 Net Block 21.3 92.1 154.4 239.6 292.5 342.2 Capital Work-in-Progress 28.0 31.5 60.7 35.0 20.0 20.0 Goodwill - - - - - - Investments 11.9 85.3 0.1 0.1 0.1 0.1 Current Assets 238.3 437.8 561.8 771.8 1,059.3 1,374.3 Cash 39.6 56.8 72.1 126.7 139.1 169.4 Loans & Advances 23.2 120.2 138.5 192.6 245.9 297.0 Other 175.5 260.8 351.1 452.6 674.3 907.9 Current liabilities 71.3 328.3 297.7 330.6 460.3 580.7 Net Current Assets 167.0 109.5 264.1 441.2 599.0 793.6 Misc. Exp. not written off 0.1 0.1 0.3 - - - Total Assets 228.2 318.5 479.4 715.9 911.5 1,155.9 Cash Flow Statement (Consolidated) (Rs cr) Y/E March FY2007 FY2008 FY2009 FY2010E FY2011E FY2012E Profit Before Tax 23.5 40.2 55.5 76.6 91.5 111.3 Depreciation 1.1 3.6 7.1 14.0 15.1 17.8 Change in Working Capital 45.3 (74.7) 139.3 122.5 145.4 164.4 Less: Other income - 0.1 5.0 - 5.5 6.6 Direct taxes paid 2.8 4.6 6.3 20.1 30.2 36.7 Cash Flow from Operations (23.4) 113.8 (88.0) (52.0) (74.5) (78.6) (Inc.)/ Dec. in Fixed Assets (36.8) (78.0) (98.6) (73.5) (53.0) (67.5) (Inc.)/ Dec. in Investments 17.6 (73.4) 85.2 - - - (Inc.)/ Dec. in loans and advances - - - - - - Other income - 0.1 5.0 - 5.5 6.6 Cash Flow from Investing (19.3) (151.3) (8.4) (73.5) (47.5) (60.9) Issue of Equity (4.5) 58.8 - - - - Inc./(Dec.) in loans 82.5 (0.0) 115.6 184.9 139.2 174.7 Dividend Paid (Incl. Tax) 3.2 3.9 3.9 5.0 4.9 4.9 Others 4.2 (0.2) - - - - Cash Flow from Financing 79.1 54.7 111.7 180.0 134.3 169.8 Inc./(Dec.) in Cash 36.3 17.2 15.4 54.5 12.4 30.3 Opening Cash balances 3.3 39.6 56.8 72.2 126.7 139.1 Closing Cash balances 39.6 56.8 72.2 126.7 139.1 169.4 May 11, 2010 5
- 6. Pratibha Industries I 4QFY2010 Result Update Key Ratios Y/E March FY2007 FY2008 FY2009 FY2010E FY2011E FY2012E Valuation Ratio (x) P/E (on FDEPS) 32.7 19.4 14.9 11.8 10.9 8.9 P/CEPS 26.6 17.6 12.8 9.4 8.7 7.2 P/BV 6.0 3.6 3.0 2.4 2.0 1.7 Dividend yield (%) 0.5 0.5 0.5 0.8 0.8 0.8 EV/Sales 2.8 1.3 1.0 1.0 0.8 0.8 EV/EBITDA 22.6 11.2 9.2 6.8 6.3 5.7 EV / Total Assets 36.6 23.3 17.6 13.6 12.1 10.8 Per Share Data (Rs) EPS (Basic) 12.2 20.5 26.8 33.9 36.8 44.7 EPS (fully diluted) 12.2 20.5 26.8 33.9 36.8 44.7 Cash EPS 15.0 22.7 31.1 42.3 45.8 55.4 DPS 2.0 2.0 2.0 3.0 3.0 3.0 Book Value 66.4 110.2 134.7 165.6 199.4 241.2 Dupont Analysis EBIT margin 11.9 11.0 10.5 12.7 12.3 12.1 Tax retention ratio 86.7 85.3 80.7 73.7 67.0 67.0 Asset turnover (x) 1.3 2.1 2.0 1.7 1.6 1.6 ROIC (Post-tax) 13.6 19.5 17.1 15.9 13.1 12.9 Cost of Debt (Post Tax) 8.1 14.3 14.4 11.3 9.8 9.6 Leverage (x) 1.0 0.5 0.6 0.9 1.1 1.3 Operating ROE 19.1 21.8 18.6 19.9 16.9 17.1 Returns (%) ROCE (Pre-tax) 15.7 22.8 21.2 21.6 19.6 19.3 Angel ROIC (Pre-tax) 20.3 35.4 29.0 25.9 23.4 22.7 ROE 21.5 24.6 21.9 22.6 20.1 20.3 Turnover ratios (x) Asset Turnover (Gross Block) 12.3 9.2 6.0 4.6 4.3 4.5 Inventory / Sales (days) 26.3 66.2 89.1 74.3 63.7 62.0 Receivables (days) 187 75 49 70 95 113 Payables (days) 84 134 147 120 118 122 Working capital, ex-cash (days) 203 89 85 127 147 154 Solvency ratios (x) Net debt to equity 1.0 0.4 0.8 1.1 1.3 1.4 Net debt to EBITDA 2.5 1.2 1.9 2.1 2.5 2.7 Interest Coverage (EBIT / Interest) 2.9 2.8 2.5 2.5 2.2 2.1 May 11, 2010 6
- 7. Pratibha Industries I 4QFY2010 Result Update Research Team Tel: 022-4040 3800 E-mail: research@angeltrade.com Website: www.angeltrade.com DISCLAIMER This document is solely for the personal information of the recipient, and must not be singularly used as the basis of any investment decision. Nothing in this document should be construed as investment or financial advice. Each recipient of this document should make such investigations as they deem necessary to arrive at an independent evaluation of an investment in the securities of the companies referred to in this document (including the merits and risks involved), and should consult their own advisors to determine the merits and risks of such an investment. Angel Securities Limited, its affiliates, directors, its proprietary trading and investment businesses may, from time to time, make investment decisions that are inconsistent with or contradictory to the recommendations expressed herein. The views contained in this document are those of the analyst, and the company may or may not subscribe to all the views expressed within. Reports based on technical and derivative analysis center on studying charts of a stock's price movement, outstanding positions and trading volume, as opposed to focusing on a company's fundamentals and, as such, may not match with a report on a company's fundamentals. The information in this document has been printed on the basis of publicly available information, internal data and other reliable sources believed to be true, and are for general guidance only. Angel Securities Limited has not independently verified all the information contained within this document. Accordingly, we cannot testify, nor make any representation or warranty, express or implied, to the accuracy, contents or data contained within this document. While Angel Securities Limited endeavours to update on a reasonable basis the information discussed in this material, there may be regulatory, compliance, or other reasons that prevent us from doing so. This document is being supplied to you solely for your information, and its contents, information or data may not be reproduced, redistributed or passed on, directly or indirectly. Angel Securities Limited and its affiliates may seek to provide or have engaged in providing corporate finance, investment banking or other advisory services in a merger or specific transaction to the companies referred to in this report, as on the date of this report or in the past. Neither Angel Securities Limited nor its directors, employees and affiliates shall be liable for any loss or damage that may arise from or in connection with the use of this information. Note: Please refer to the important `Stock Holding Disclosure' report on the Angel website (Research Section). Disclosure of Interest Statement Pratibha Industries 1. Analyst ownership of the stock No 2. Angel and its Group companies ownership of the stock No 3. Angel and its Group companies’ Directors ownership of the stock No 4. Broking relationship with company covered No Note: We have not considered any Exposure below Rs 1 lakh for Angel and its Group companies. Address: Acme Plaza, ‘A’ Wing, 3rd Floor, M.V. Road, Opp. Sangam Cinema, Andheri (E), Mumbai - 400 059. Tel : (022) 3952 4568 / 4040 3800 Angel Broking Ltd: BSE Sebi Regn No : INB 010996539 / CDSL Regn No: IN - DP - CDSL - 234 - 2004 / PMS Regn Code: PM/INP000001546 Angel Securities Ltd:BSE: INB010994639/INF010994639 NSE: INB230994635/INF230994635 Membership numbers: BSE 028/NSE:09946 Angel Capital & Debt Market Ltd: INB 231279838 / NSE FNO: INF 231279838 / NSE Member code -12798 Angel Commodities Broking (P) Ltd: MCX Member ID: 12685 / FMC Regn No: MCX / TCM / CORP / 0037 NCDEX : Member ID 00220 / FMC Regn No: NCDEX / TCM / CORP / 0302 May 11, 2010 7