BPPG response - Options for Defined Benefit schemes - 19Apr24.pdf
Bharat Forge
1. 1QFY2011 Result Update| Auto Ancillary
July 27 2010
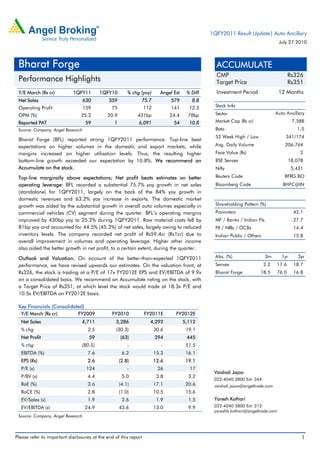
Bharat Forge ACCUMULATE
CMP Rs326
Performance Highlights Target Price Rs351
Y/E March (Rs cr) 1QFY11 1QFY10 % chg (yoy) Angel Est % Diff Investment Period 12 Months
Net Sales 630 359 75.7 579 8.8
Operating Profit 159 75 112 141 12.3 Stock Info
OPM (%) 25.2 20.9 431bp 24.4 78bp Sector Auto Ancillary
Reported PAT 59 1 6,091 54 10.8 Market Cap (Rs cr) 7,588
Source: Company, Angel Research Beta 1.5
52 Week High / Low 341/174
Bharat Forge (BFL) reported strong 1QFY2011 performance. Top-line beat
expectations on higher volumes in the domestic and export markets, while Avg. Daily Volume 206,764
margins increased on higher utilisation levels. Thus, the resulting higher bottom- Face Value (Rs) 2
line growth exceeded our expectation by 10.8%. We recommend an Accumulate BSE Sensex 18,078
on the stock. Nifty 5,431
Top-line marginally above expectations; Net profit beats estimates on better Reuters Code BFRG.BO
operating leverage: BFL recorded a substantial 75.7% yoy growth in net sales Bloomberg Code BHFC@IN
(standalone) for 1QFY2011, largely on the back of the 84% yoy growth in
domestic revenues and 63.2% yoy increase in exports. The domestic market
growth was aided by the substantial growth in overall auto volumes especially in Shareholding Pattern (%)
commercial vehicles (CV) segment during the quarter. BFL’s operating margins Promoters 42.1
improved by 430bp yoy to 25.2% during 1QFY2011. Raw material costs fell by MF / Banks / Indian Fls 27.7
81bp yoy and accounted for 44.5% (45.3%) of net sales, largely owing to reduced FII / NRIs / OCBs 14.4
inventory levels. The company recorded net profit of Rs59.4cr (Rs1cr) due to Indian Public / Others 15.8
overall improvement in volumes and operating leverage. Higher other income
also aided the better growth in net profit, to a certain extent, during the quarter.
Outlook and Valuation: On account of the better-than-expected 1QFY2011 Abs. (%) 3m 1yr 3yr
performance, we have revised upwards our estimates. On the valuation front, at Sensex 2.2 17.6 18.7
Rs326, the stock is trading at a P/E of 17x FY2012E EPS and EV/EBITDA of 9.9x Bharat Forge 18.5 76.0 16.8
on a consolidated basis. We recommend an Accumulate rating on the stock, with
a Target Price of Rs351, at which level the stock would trade at 18.3x P/E and
10.5x EV/EBITDA on FY2012E basis.
Key Financials (Consolidated)
Y/E March (Rs cr) FY2009 FY2010 FY2011E FY2012E
Net Sales 4,711 3,286 4,292 5,112
% chg 2.5 (30.3) 30.6 19.1
Net Profit 59 (63) 294 445
% chg (80.5) (207.7) (564.3) 51.5
EBITDA (%) 7.6 6.2 15.3 16.1
EPS (Rs) 2.6 (2.8) 12.6 19.1
P/E (x) 124 (115) 26 17
Vaishali Jajoo
P/BV (x) 4.4 5.0 3.8 3.2
022-4040 3800 Ext: 344
RoE (%) 3.6 (4.1) 17.1 20.6 vaishali.jajoo@angeltrade.com
RoCE (%) 2.8 (1.0) 10.5 15.6
EV/Sales (x) 1.9 2.6 1.9 1.5 Yaresh Kothari
EV/EBITDA (x) 24.9 43.6 13.0 9.9 022-4040 3800 Ext: 313
yareshb.kothari@angeltrade.com
Source: Company, Angel Research
Please refer to important disclosures at the end of this report 1
3. Bharat Forge | 1QFY2011 Result Update
Top-line marginally above expectations; exceeds estimates by 8.8%: BFL recorded
a substantial 75.7% yoy growth in net sales (standalone) during 1QFY2011,
largely on the back of the 84% yoy growth in domestic revenues and 63.2% yoy
increase in exports. The domestic market growth was aided by the substantial
growth in overall auto volumes especially in the CV segment during the quarter.
On the exports front, as per management, volumes particularly in the US,
recorded an improvement in 4QFY2010, which continued in 1QFY2011. At
present, the company is operating at optimum utilization levels, which is expected
to improve going forward. Production volumes, in tonnage terms, have steadily
improved from a low of 22,837 tonnes in 1QFY2010 to 42,643 tonnes in
1QFY2011.
Exhibit 3: Domestic revenues up 84% Exhibit 4: Reviving exports growth, up 63% yoy
(Rs cr) (%) (Rs cr) (%)
500 150 300 100
63.2
98.9 82.8
375 100 225 50
84.0
250 47.6 50 150 0
(18.2)
(52.0)
125 0 75 (50)
(36.5) (56.3)
(16.9)
0 (50) 0 (100)
1QFY10 2QFY10 3QFY10 4QFY10 1QFY11 1QFY10 2QFY10 3QFY10 4QFY10 1QFY11
Domestic Revenue yoy change (RHS) Exports Revenue yoy change (RHS)
Source: Company, Angel Research Source: Company, Angel Research
Exhibit 5: Increasing volumes and utilisation levels Exhibit 6: Geographical break up of revenue
(%) (%)
50,000 60 75
51
46
40,000 42 65
45 61 61 63
36 60
50
30,000
26 30
20,000
25
15 26
10,000 22 20 22
17 19
13 15 16
12
0 0 0
1QFY10 2QFY10 3QFY10 4QFY10 1QFY11 1QFY10 2QFY10 3QFY10 4QFY10 1QFY11
Volume (tonnage) Capacity Utilisation (RHS) India US Europe Others
Source: Company, Angel Research Source: Company, Angel Research
Lower raw material costs, higher operating leverage helps improve margins: BFL’s
operating margins improved by 430bp yoy to 25.2% during 1QFY2011. Raw
material costs fell by 81bp yoy and accounted for 44.5% (45.3%) of net sales,
largely owing to reduced inventory levels. The company achieved significant
operating leverage following the reduction in staff costs and other expenditure to
the extent of 277bp and 194bp, respectively. Thus, overall the company recorded
112% yoy jump in operating profit to Rs159cr on a standalone basis.
July 27 2010 3
4. Bharat Forge | 1QFY2011 Result Update
Exhibit 7: EBITDA margins up 430bp Exhibit 8: Net profit beats estimates
(%) (Rs cr) (%)
60 80 15
46.3 44.9 45.4 45.0 46.1
45 60 10.7
10
7.3 9.3
30 24.0 23.4 25.0 25.2 6.2
20.9 40
5
15 20
0.3
0
0 0
1QFY10 2QFY10 3QFY10 4QFY10 1QFY11
1QFY10 2QFY10 3QFY10 4QFY10 1QFY11
EBITDA Margin RM Cost/Net sales (excl. other opr. Inc.) Net Profit (LHS) Net Profit Margin (RHS)
Source: Company, Angel Research Source: Company, Angel Research
Net profit at Rs59.4cr, beats estimates: The company recorded net profit of
Rs59.4cr (Rs1cr) due to overall improvement in volumes and operating leverage.
Higher other income also aided the better growth in net profit, to a certain extent,
during the quarter. However, interest cost and depreciation costs increased by 18%
yoy and 22% yoy respectively, for the quarter.
Consolidated performance exceeds expectation: Consolidated performance was
marginally above our expectations with top-line growth of 66% yoy to Rs1,013cr
(Rs609cr). Bottom-line stood at Rs62cr (net loss of Rs46cr in 1QFY2010), largely
on account of the sharp turnaround in the overseas operations. In 1QFY2011,
BFL’s OPM, on a consolidated basis, improved by almost 860bp yoy to 18.2%
(9.6%). Overall, turnaround of the overseas subsidiaries supported the strong
recovery at consolidated levels.
Exhibit 9: Quarterly performance - Consolidated
Y/E Mar (Rs cr) 1QFY11 1QFY10 4QFY10 % yoy chg % qoq chg
Revenue 1,012.6 609.0 924.0 66.3 9.6
Operating Profit 184.7 58.7 161.5 214.5 14.4
PBT & EOI 90.6 (20.3) 73.2 - 23.7
PAT after EOI 62.1 (46.1) 56.0 (234.5) 10.8
EPS (Rs) 2.8 (2.1) 2.5 (234.5) 11.5
Source: Company, Angel Research
July 27 2010 4
5. Bharat Forge | 1QFY2011 Result Update
Exhibit 10: Top-line growth at 66% Exhibit 11: Improving EBITDA margins, profitability
(Rs cr) (%) (Rs cr) (%)
1,200 100 200 25
66.3
47.3
17.5 18.2 20
900 50 125 15.5
12.1 15
600 0 50 9.6
(15.4) 10
(54.0)
300 (50) (25)
5
(63.2)
0 (100) (100) 0
1QFY10 2QFY10 3QFY10 4QFY10 1QFY11 1QFY10 2QFY10 3QFY10 4QFY10 1QFY11
Total Revenue yoy change (LHS) EBITDA PAT EBITDA Margin (LHS)
Source: Company, Angel Research Source: Company, Angel Research
Conference Call - Key Highlights
International operations: The company’s international operations, which
contributed ~37% of total revenues during 1QFY2011 continues to show
improvement in performance and management remains quite optimistic of the
turnaround and profitability. The US and Europe contributed 19% and 16% to
total revenues respectively, during 1QFY2011. The restructuring exercise that
the company carried out in CY2009 at a cost of Rs85cr to lower the breakeven
levels has started to positively impact its financial performance. The utilisation
levels on the international front are currently ~40-45%, which management is
targeting to raise to ~50-55%. The company is seeing uptick in volume off-
take in the US M&HCV segment after three continuous years of significant
volume reduction. However, the Europe scenario remains bleak and it is
expected to show signs of revival in the second half of FY2011E. On the back
of improvement in operating leverage, the company expects expansion in
margins going ahead.
China JV: BFL’s JV in China has turned profitable for the first time since the
commencement of operations in April 2006. As per management, the first
quarter performance of the current fiscal has surpassed the performance of
last fiscal. Utilisation levels are currently at 50% and management is targeting
a marginal increase in the same to 55-60%.
Non-auto business: The company’s non-auto business revenues during
1QFY2011 stood at around ~Rs200cr, up from Rs140cr during 4QFY2010.
The non-auto business exports during the quarter stood at ~Rs80cr.
Profitability of this segment remains higher than the auto segment. Utilisation
levels, however remains weak at ~30%. Management intends to ramp it up to
50% levels by the end of FY2011. Management has indicated that the
company has won its maiden EPC contract and is also technically qualified to
bid for NTPC’s bulk tender. The company remains optimistic on the power
side of the business and its joint venture (JV) with Alstom is expected to start
operations during 2QFY2011E.
July 27 2010 5
6. Bharat Forge | 1QFY2011 Result Update
The company intends to incur capital expenditure of Rs100cr during FY2011E
for its Indian operations and has no plans to incur any capital expenditure
overseas. As of June 2011, the company had net debt of ~Rs1,000cr.
During 1QFY2011, the company incurred higher labour costs on account of
restoration of salary cuts taken during FY2010 and due to the higher outgo on
account of the annual incentives to employees.
Investment Arguments
Strong rebound in domestic operations continue on healthy growth in CV
demand: BFL, being a market leader in the CV space for products like
crankshaft, axle beams, connecting rods, etc. with almost 90% market share,
has been able to clock robust growth sequentially. Over the last few quarters,
following the overall recovery in the economic and industrial activity, CV
volumes have also been showing good recovery. We estimate the domestic
heavy CV segment to record CAGR of around 13% over FY2010-12E. Thus,
BFL is expected to be one of the biggest beneficiaries on anticipated higher
off-take by the CV segment over the next couple of years.
Rebound in global economy to help turnaround of overseas operations: The
company experienced tough times in the overseas market, especially in USA
and Europe in the last two years. BFL had adopted various measures to
counter the effects of the downturn, such as rightsizing its operations globally
to adjust to the lower demand levels. Other actions taken included reduction
of manpower, rationalisation of production, salary cuts and reducing
administrative overheads, increased focus on working capital reduction and
conservation of cash and capex holiday in FY2010. The company was
focusing on improving its operational efficiencies like yield, scrap reduction,
energy cost and outsourcing reduction.
All these measures have helped the company in bringing down its breakeven
levels to almost 50% utilisation (60-65% earlier). We believe that most of these
markets are now showing signs of recovery, which would help the company to
improve its consolidated performance over FY2010-12E.
Non-auto diversification: The company has been diversifying its product
portfolio in the non-auto segment. Though the company has order traction in
this segment (oil and gas, power-thermal and nuclear, and rail), lower level of
business of its clients in various industries has affected potential ramp up of
utilisation levels of new capacities created especially for the segment. Around
60% of the segment revenues come from exports, while the balance comes
from the domestic market. The company expects to generate around 40% of
its revenue from its this segment in FY2011E on total incurred capex of around
Rs500cr. BFL is confident of growing its non-auto business faster, which would
act as a buffer to the prevailing difficult macro environment for its auto
business.
July 27 2010 6
7. Bharat Forge | 1QFY2011 Result Update
Further, BFL has entered into a JV with Alstom and NTPC to manufacture
state-of-the-art supercritical power plant equipment in India. The JV will
design, engineer, manufacture and deliver turbine generator islands of 600-
800MW supercritical range, with total installed capacity of 5,000MW per
annum. Alstom and BFL have agreed to explore the manufacture of turbines
and generators in the subcritical range, as well as for gas and nuclear
applications. The manufacturing infrastructure will include plants for
manufacturing turbines, generators and all the auxiliaries that go into turbine
generator islands. The JV entails an investment of Rs1,500cr from both the
partners. BFL is expected to invest around Rs300-350cr in the Alstom JV over
the next three years. The capacity is set to be commissioned in 2012. BFL’s
equity contribution in the NTPC JV would be Rs50cr over the next two years.
The company has also bagged its maiden order worth Rs2,000cr in the capital
goods space for EPC contract. This JV will help the companies show healthy
performance at consolidated levels.
Outlook and Valuation
A substantial portion of BFL’s revenues come from the CV segment, where full
recovery has been recorded in the last few quarters. Moreover, a major portion of
the company’s consolidated revenues come from the US, which was in
recessionary mode, and is expected to come out of it in 2010. BFL’s non-auto
business is also expected to start contributing more from FY2011E and mitigate the
effects of the slowdown in the auto segment. On account of the better-than-
expected 1QFY2011 performance, we have revised estimates upwards.
Exhibit 12 : Change in estimates
Y/E March (Rs cr) Earlier Estimates Revised Estimates % chg
FY11E FY12E FY11E FY12E FY11E FY12E
Net Sales 4,227 5,017 4,292 5,112 1.5 1.9
OPM (%) 14.1 15.0 15.3 16.1 120bp 105bp
EPS (Rs) 12.0 17.2 12.6 19.1 5.1 11.2
Source: Company, Angel Research
On the valuation front, at Rs326 the stock is trading at a P/E of 17x FY2012E EPS
and EV/EBITDA of 9.9x on a consolidated basis. We recommend an Accumulate
rating on the stock, with a Target Price of Rs351, at which level the stock would
trade at 18.3x P/E and 10.5x EV/EBITDA on FY2012E basis.
July 27 2010 7
13. Bharat Forge | 1QFY2011 Result Update
Research Team Tel: 022 - 4040 3800 E-mail: research@angeltrade.com Website: www.angeltrade.com
DISCLAIMER
This document is solely for the personal information of the recipient, and must not be singularly used as the basis of any investment
decision. Nothing in this document should be construed as investment or financial advice. Each recipient of this document should make
such investigations as they deem necessary to arrive at an independent evaluation of an investment in the securities of the companies
referred to in this document (including the merits and risks involved), and should consult their own advisors to determine the merits and
risks of such an investment.
Angel Broking Limited, its affiliates, directors, its proprietary trading and investment businesses may, from time to time, make
investment decisions that are inconsistent with or contradictory to the recommendations expressed herein. The views contained in this
document are those of the analyst, and the company may or may not subscribe to all the views expressed within.
Reports based on technical and derivative analysis center on studying charts of a stock's price movement, outstanding positions and
trading volume, as opposed to focusing on a company's fundamentals and, as such, may not match with a report on a company's
fundamentals.
The information in this document has been printed on the basis of publicly available information, internal data and other reliable
sources believed to be true, but we do not represent that it is accurate or complete and it should not be relied on as such, as this
document is for general guidance only. Angel Broking Limited or any of its affiliates/ group companies shall not be in any way
responsible for any loss or damage that may arise to any person from any inadvertent error in the information contained in this report.
Angel Broking Limited has not independently verified all the information contained within this document. Accordingly, we cannot testify,
nor make any representation or warranty, express or implied, to the accuracy, contents or data contained within this document. While
Angel Broking Limited endeavours to update on a reasonable basis the information discussed in this material, there may be regulatory,
compliance, or other reasons that prevent us from doing so.
This document is being supplied to you solely for your information, and its contents, information or data may not be reproduced,
redistributed or passed on, directly or indirectly.
Angel Broking Limited and its affiliates may seek to provide or have engaged in providing corporate finance, investment banking or
other advisory services in a merger or specific transaction to the companies referred to in this report, as on the date of this report or in
the past.
Neither Angel Broking Limited, nor its directors, employees or affiliates shall be liable for any loss or damage that may arise from or in
connection with the use of this information.
Note: Please refer to the important `Stock Holding Disclosure' report on the Angel website (Research Section). Also, please
refer to the latest update on respective stocks for the disclosure status in respect of those stocks. Angel Broking Limited and
its affiliates may have investment positions in the stocks recommended in this report.
Disclosure of Interest Statement Bharat Forge
1. Analyst ownership of the stock Yes
2. Angel and its Group companies ownership of the stock Yes
3. Angel and its Group companies' Directors ownership of the stock No
4. Broking relationship with company covered No
Note: We have not considered any Exposure below Rs 1 lakh for Angel, its Group companies and Directors.
Ratings (Returns) : Buy (> 15%) Accumulate (5% to 15%) Neutral (-5 to 5%)
Reduce (-5% to 15%) Sell (< -15%)
July 27 2010 13