Lundin Gold April 2024 Corporate Presentation v4.pdf
Bajaj electricals ru2 qfy2011-271010
1. Please refer to important disclosures at the end of this report 1
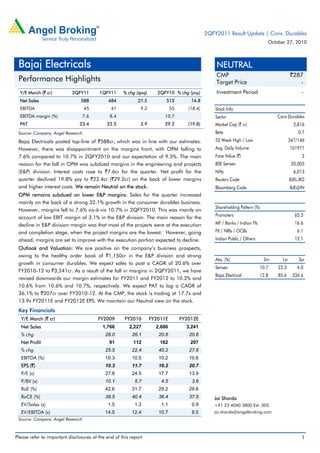
Y/E March (` cr) 2QFY11 1QFY11 % chg (qoq) 2QFY10 % chg (yoy)
Net Sales 588 484 21.5 512 14.8
EBITDA 45 41 9.2 55 (18.4)
EBITDA margin (%) 7.6 8.4 10.7
PAT 23.4 22.5 3.9 29.2 (19.8)
Source: Company, Angel Research
Bajaj Electricals posted top-line of `588cr, which was in line with our estimates.
However, there was disappointment on the margins front, with OPM falling to
7.6% compared to 10.7% in 2QFY2010 and our expectation of 9.5%. The main
reason for the fall in OPM was subdued margins in the engineering and projects
(E&P) division. Interest costs rose to `7.6cr for the quarter. Net profit for the
quarter declined 19.8% yoy to `23.4cr (`29.2cr) on the back of lower margins
and higher interest costs. We remain Neutral on the stock.
OPM remains subdued on lower E&P margins: Sales for the quarter increased
mainly on the back of a strong 32.1% growth in the consumer durables business.
However, margins fell to 7.6% vis-à-vis 10.7% in 2QFY2010. This was mainly on
account of low EBIT margin of 3.1% in the E&P division. The main reason for the
decline in E&P division margin was that most of the projects were at the execution
and completion stage, when the project margins are the lowest. However, going
ahead, margins are set to improve with the execution portion expected to decline.
Outlook and Valuation: We are positive on the company’s business prospects,
owing to the healthy order book of `1,150cr in the E&P division and strong
growth in consumer durables. We expect sales to post a CAGR of 20.6% over
FY2010-12 to `3,241cr. As a result of the fall in margins in 2QFY2011, we have
revised downwards our margin estimates for FY2011 and FY2012 to 10.2% and
10.6% from 10.6% and 10.7%, respectively. We expect PAT to log a CAGR of
36.1% to `207cr over FY2010-12. At the CMP, the stock is trading at 17.7x and
13.9x FY2011E and FY2012E EPS. We maintain our Neutral view on the stock.
Key Financials
Y/E March (` cr) FY2009 FY2010 FY2011E FY2012E
Net Sales 1,766 2,227 2,686 3,241
% chg 28.0 26.1 20.6 20.6
Net Profit 91 112 162 207
% chg 25.5 22.4 45.2 27.6
EBITDA (%) 10.3 10.5 10.2 10.6
EPS (`) 10.3 11.7 16.2 20.7
P/E (x) 27.8 24.5 17.7 13.9
P/BV (x) 10.1 5.7 4.5 3.6
RoE (%) 42.6 31.7 29.2 29.6
RoCE (%) 39.5 40.4 36.4 37.5
EV/Sales (x) 1.5 1.3 1.1 0.9
EV/EBITDA (x) 14.5 12.4 10.7 8.5
Source: Company, Angel Research
NEUTRAL
CMP `287
Target Price -
Investment Period -
Stock Info
Sector
Bloomberg Code BJE@IN
Shareholding Pattern (%)
Promoters 65.3
MF / Banks / Indian Fls 16.6
FII / NRIs / OCBs 6.1
Indian Public / Others 12.1
Abs. (%) 3m 1yr 3yr
Sensex 10.7 22.3 4.0
Bajaj Electrical 12.8 85.6 334.6
2
20,005
6,013
BJEL.BO
2,816
0.7
347/146
101971
Cons Durables
Avg. Daily Volume
Market Cap (` cr)
Beta
52 Week High / Low
Face Value (`)
BSE Sensex
Nifty
Reuters Code
Jai Sharda
+91 22 4040 3800 Ext: 305
jai.sharda@angelbroking.com
Bajaj Electricals
Performance Highlights
2QFY2011 Result Update | Cons. Durables
October 27, 2010
2. Bajaj Electrical | 2QFY2011 Result Update
October 27, 2010 2
Exhibit 1: 2QFY2011 Performance
Y/E March (` cr) 2QFY11 1QFY11 % chg (qoq) 2QFY10 % chg (yoy) FY2010 FY2009 % chg
Net Sales 587.8 483.9 21.5 512.1 14.8 2,228.6 1,765.7 26.2
Consumption of RM 444.4 369.9 20.1 365.2 21.7 1,652.4 1,314.9 25.7
(% of Sales) 75.6 76.5 71.3 74.1 74.5
Staff Costs 37.5 23.9 57.3 30.6 22.7 97.2 77.1 26.0
(% of Sales) 6.4 4.9 6.0 4.4 4.4
Other Expenses 61.3 49.3 24.4 61.8 (0.7) 235.7 193.8 21.6
(% of Sales) 10.4 10.2 12.1 10.6 11.0
Total Expenditure 543.2 443.1 22.6 457.5 18.7 1,985.2 1,585.9 25.2
Operating Profit 44.6 40.8 9.2 54.7 (18.4) 243.4 179.8 35.3
OPM (%) 7.6 8.4 10.7 10.9 10.2
Interest 7.6 5.7 33.7 8.5 (10.6) 31.5 37.0 (14.9)
Depreciation 2.3 2.4 (0.4) 2.4 (1.3) 9.2 8.6 7.6
Other Income 1.5 1.2 21.8 0.7 125.4 2.9 5.7 (49.8)
PBT (excl. Extr. Items) 36.1 34.0 6.3 44.4 (18.7) 205.6 140.0 46.9
Extr. Income/(Expense) - - - 5.0 -
PBT (incl. Extr. Items) 36.1 34.0 6.3 44.4 (18.7) 200.6 140.0 43.3
(% of Sales) 6.1 7.0 8.7 9.0 7.9
Provision for Taxation 12.8 11.5 11.0 15.3 (16.4) 75.4 50.7 48.7
(% of PBT) 35.3 33.8 34.3 37.6 36.2
Reported PAT 23.4 22.5 3.9 29.2 (19.8) 125.3 89.4 40.2
Prior Period Items 0.1 0.0 - 8.2 (0.0)
PATM (%) 4.0 4.7 5.7 5.6 5.1
Equity shares (cr) 9.8 9.8 8.7 9.8 9.8
EPS (`) 2.4 2.3 3.5 3.3 (28.8) 12.8 9.2 40.2
Adjusted PAT 23.2 22.5 3.3 29.2 (20.3) 117.1 89.4 31.0
Source: Company, Angel Research
Segment wise performance
The lighting segment sales grew by 10.1% during the quarter to `151.4cr
(`137.5cr). Margins came in at a low 4.5% for the division on the back of
fluctuating raw material prices. The division reported EBIT of `6.8cr.
The consumer durables segment led the growth of the company during the
quarter, registering sales of `279.8cr (`211.8cr), which was 32.1% higher yoy.
Margins for this business also fell yoy, but were strong qoq at 11.3%, with EBIT of
`31.7cr.
Sales of the E&P segment remained flat at `156.0cr (`155.6cr) yoy primarily on a
high base. The segment registered yoy growth of 75.8% in 2QFY2010. However,
the main highlight was the suppressed EBIT margin, which came in at a mere
3.1%. Margin was muted as most of the contracts during the quarter were at
completion stage, which is the least margin accretive stage of the projects. Going
ahead though, margins of the division are expected to bounce back.
3. Bajaj Electrical | 2QFY2011 Result Update
October 27, 2010 3
Exhibit 2: Segment-wise performance
Y/E Mar (` cr) 2QFY11 1QFY11 1QFY10 % chg (qoq) % chg (yoy)
Total Revenue
A) Lighting 151.4 110.0 137.5 37.6 10.1
B) Cons Durables 279.8 263.0 211.8 6.4 32.1
C) E&P 156.0 110.7 155.6 40.9 0.3
D) Others 0.6 0.2 0.7 238.9 (17.6)
Total 587.8 483.9 505.7 21.5 16.2
Less: Inter-Segment - - -
Net Sales 587.8 483.9 505.7 21.5 16.2
EBIT Margin (%)
A) Lighting 4.5 2.0 7.3 247bp (287bp)
B) Cons Durables 11.3 9.5 11.8 181bp (45bp)
C) E&P 3.1 10.2 11.2 (717bp) (813bp)
D) Others 59.0 (5.6) 89.2 6,457bp (3,017bp)
Source: Company, Angel Research
Sales growth comes in at 14.8% during the quarter
Over the past few quarters, the company has consistently reported strong sales
growth. However, sales growth was a relatively low in 2QFY2011 owing to flat
sales in the E&P segment, which however came on a high base. Going ahead, we
expect the company’s sales to strengthen following the boom in the consumer
durables and strong order book in the E&P segment.
Exhibit 3: Sales trend
Source: Company, Angel Research
OPM declines on low E&P division margins
OPM for 2QFY2011 declined to 7.6%, compared to 10.7% in 2QFY2010 owing to
low margins reported by the E&P division. However, the company’s margins being
seasonal in nature we expect them to improve as the projects in the E&P division hit
the high margin part of their cycle.
0.0
5.0
10.0
15.0
20.0
25.0
30.0
35.0
40.0
45.0
50.0
0
100
200
300
400
500
600
700
800
900
3QFY09
4QFY09
1QFY10
2QFY10
3QFY10
4QFY10
1QFY11
2QFY11
(%)
(`cr)
Sales (LHS) yoy Growth (RHS)
4. Bajaj Electrical | 2QFY2011 Result Update
October 27, 2010 4
Exhibit 4: OPM trend
Source: Company, Angel Research
PAT declines on lower margins
PAT declined 19.9% yoy in 2QFY2011 to `23.4cr (`29.2cr) owing to the 309bp
contraction in OPM. In the corresponding quarter of last year, PAT had jumped
137.4% yoy.
Exhibit 5: PAT trend
Source: Company, Angel Research
Management call - Key takeaways
The E&P business order book stands at `1,150cr currently. Of this, special
projects and rural electrification business is `370cr, high mast and street
furniture is `110cr and the transmission line towers is about `670cr.
Margins in 2QFY2011 were subdued due to more erection and
commissioning in the E&P division and fluctuations in the commodity prices.
However, OPM is expected to improve from 3QFY2011 as the pressure on
margins in the E&P division is expected ease and benefits from some pricing
decisions that the company has recently taken starts kicking in.
0.0
2.0
4.0
6.0
8.0
10.0
12.0
14.0
0
10
20
30
40
50
60
70
80
90
100
3QFY09
4QFY09
1QFY10
2QFY10
3QFY10
4QFY10
1QFY11
2QFY11
(%)
(`cr)
EBITDA (LHS) OPM (RHS)
(40)
(20)
0
20
40
60
80
100
120
140
160
0
5
10
15
20
25
30
35
40
45
50
3QFY09
4QFY09
1QFY10
2QFY10
3QFY10
4QFY10
1QFY11
2QFY11
(%)
(`cr)
PAT (LHS) PAT growth (RHS)
5. Bajaj Electrical | 2QFY2011 Result Update
October 27, 2010 5
Revenues during the quarter were mainly driven by volume growth. Value
growth contributed only 3-4% of top-line growth, while the balance 11-12%
growth came due to the increase in volumes.
The working capital cycle has increased mainly because of the E&P division
where working capital has increased, but sales have remained flat yoy.
The company is looking at the water purification business and building
management systems as possible avenues for growth in future.
Investment Arguments
Leveraging on strong Brands and substantial Market share: BEL has strong brand
positioning and well-spread distribution network. As per the company's internal
estimates, it is the fastest growing player in the Domestic Appliances market, which
is growing at 20% pa. In the Small Appliances market, BEL enjoys a market share
of over 15-30% across products.
Focus on high-Margin E&P Division: Post the shift in revenue mix, BEL has been
focusing on the high-margin E&P division. The division enjoys high margins of
12-13% compared to overall margins of 8%. In FY2005, E&P contributed 14.8%
(`99.5cr) of BEL's gross sales, which grew to 33.6% (`756cr) in FY2010. By
FY2012E, we expect E&P to contribute 36.7% (`1208cr) of gross sales. We expect
EBDITA margins to sustain at current levels with a positive bias.
Future growth drivers - Rural markets, acquisitions, newer verticals: BEL plans to
capitalise on the growth in the rural markets. BEL has also identified 7-8 potential
acquisition candidates across businesses. Management expects around 15% of
sales in future to come from the acquired businesses. The company also plans to
foray into newer verticals like water management, which is an underpenetrated
and rapidly growing market.
Outlook and Valuations
We maintain our positive stance on the company given its comfortable order book
position, robust demand in the consumer durables segment and good monsoons
this year. We expect sales to register a CAGR of 20.6% over FY2010-12. However,
we have revised downwards our OPM estimates to 10.2% from 10.6% in FY2011E
and 10.6% from 10.7% in FY2012E on the back of lower reported margins in
2QFY2011. Overall, we expect PAT to post a CAGR of 36.1% over FY2010-12 to
`207cr.
At the CMP, the stock is trading at 17.7x and 13.9x FY2011E and FY2012E EPS,
factoring in most of the positives of the business. We maintain our Neutral
recommendation on the stock.
6. Bajaj Electrical | 2QFY2011 Result Update
October 27, 2010 6
Exhibit 6: 2QFY2011 results: Actual v/s estimated
Actual Estimated Difference (%)
Sales (` cr) 587.8 599.9 (2.0)
EBITDA (` cr) 44.6 57.0 (21.8)
OPM (%) 7.6 9.5 (192bp)
PAT (` cr) 23.4 33.1 (29.4)
Source: Company, Angel Research
Exhibit 7: Change in estimates
(` cr) Old New % chg
FY2011E FY2012E FY2011E FY2012E FY2011E FY2012E
Sales 2,686 3,241 2,686 3,241 - -
EBITDA 284 345 273 342 (3.8) (0.9)
EBITDA margin (%) 10.6 10.7 10.2 10.6
PAT 169 209 162 207 (4.1) (1.0)
EPS (`) 16.9 20.9 16.2 20.7 (4.1) (1.0)
Source: Angel Research
Exhibit 8: Key assumptions
FY2011E FY2012E Remarks
E&P Contribution to Sales 35.0 36.7 Strong Order Book to lead Sales
Cons Durables Contribution to Sales 42.7 42.3 Consumer demand expected to remain robust
Lighting Contribution to Sales 22.3 20.9
OPM (%) 10.2 10.6 OPM revised downwards owing to disappointing 2QFY2011 performance
Tax Rate (%) 34.4 34.4
Source: Angel Research
Exhibit 9: One year forward P/E
Source: Company, Bloomberg, Angel Research
0
50
100
150
200
250
300
350
Apr-04 Apr-05 Apr-06 Apr-07 Apr-08 Apr-09 Apr-10
Shareprice(`)
CMP 6x 8x 10x 13x 16x
11. Bajaj Electrical | 2QFY2011 Result Update
October 27, 2010 11
Research Team Tel: 022 - 4040 3800 E-mail: research@angeltrade.com Website: www.angeltrade.com
DISCLAIMER
This document is solely for the personal information of the recipient, and must not be singularly used as the basis of any investment
decision. Nothing in this document should be construed as investment or financial advice. Each recipient of this document should make
such investigations as they deem necessary to arrive at an independent evaluation of an investment in the securities of the companies
referred to in this document (including the merits and risks involved), and should consult their own advisors to determine the merits and
risks of such an investment.
Angel Broking Limited, its affiliates, directors, its proprietary trading and investment businesses may, from time to time, make
investment decisions that are inconsistent with or contradictory to the recommendations expressed herein. The views contained in this
document are those of the analyst, and the company may or may not subscribe to all the views expressed within.
Reports based on technical and derivative analysis center on studying charts of a stock's price movement, outstanding positions and
trading volume, as opposed to focusing on a company's fundamentals and, as such, may not match with a report on a company's
fundamentals.
The information in this document has been printed on the basis of publicly available information, internal data and other reliable
sources believed to be true, but we do not represent that it is accurate or complete and it should not be relied on as such, as this
document is for general guidance only. Angel Broking Limited or any of its affiliates/ group companies shall not be in any way
responsible for any loss or damage that may arise to any person from any inadvertent error in the information contained in this report.
Angel Broking Limited has not independently verified all the information contained within this document. Accordingly, we cannot testify,
nor make any representation or warranty, express or implied, to the accuracy, contents or data contained within this document. While
Angel Broking Limited endeavours to update on a reasonable basis the information discussed in this material, there may be regulatory,
compliance, or other reasons that prevent us from doing so.
This document is being supplied to you solely for your information, and its contents, information or data may not be reproduced,
redistributed or passed on, directly or indirectly.
Angel Broking Limited and its affiliates may seek to provide or have engaged in providing corporate finance, investment banking or
other advisory services in a merger or specific transaction to the companies referred to in this report, as on the date of this report or in
the past.
Neither Angel Broking Limited, nor its directors, employees or affiliates shall be liable for any loss or damage that may arise from or in
connection with the use of this information.
Note: Please refer to the important `Stock Holding Disclosure' report on the Angel website (Research Section). Also, please
refer to the latest update on respective stocks for the disclosure status in respect of those stocks. Angel Broking Limited and
its affiliates may have investment positions in the stocks recommended in this report.
Disclosure of Interest Statement Bajaj Electricals
1. Analyst ownership of the stock No
2. Angel and its Group companies ownership of the stock No
3. Angel and its Group companies' Directors ownership of the stock No
4. Broking relationship with company covered No
Ratings (Returns): Buy (> 15%) Accumulate (5% to 15%) Neutral (-5 to 5%)
Reduce (-5% to 15%) Sell (< -15%)
Note: We have not considered any Exposure below `1 lakh for Angel, its Group companies and Directors