1. 4QFY2010 Result Update I Automobile
April 21, 2010
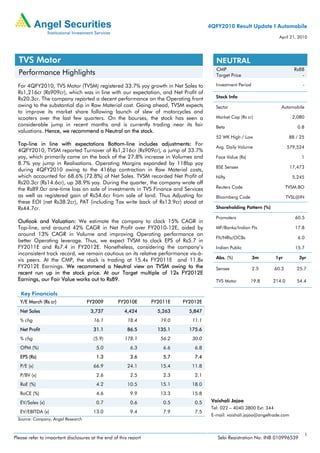
TVS Motor NEUTRAL
CMP Rs88
Performance Highlights Target Price -
For 4QFY2010, TVS Motor (TVSM) registered 33.7% yoy growth in Net Sales to Investment Period -
Rs1,216cr (Rs909cr), which was in line with our expectation, and Net Profit of
Rs20.3cr. The company reported a decent performance on the Operating front Stock Info
owing to the substantial dip in Raw Material cost. Going ahead, TVSM expects Sector Automobile
to improve its market share following launch of slew of motorcycles and
scooters over the last few quarters. On the bourses, the stock has seen a Market Cap (Rs cr) 2,080
considerable jump in recent months and is currently trading near its fair Beta 0.8
valuations. Hence, we recommend a Neutral on the stock.
52 WK High / Low 88 / 25
Top-line in line with expectations Bottom-line includes adjustments: For
Avg. Daily Volume 579,524
4QFY2010, TVSM reported Turnover of Rs1,216cr (Rs909cr), a jump of 33.7%
yoy, which primarily came on the back of the 27.8% increase in Volumes and Face Value (Rs) 1
8.7% yoy jump in Realisations. Operating Margins expanded by 118bp yoy
BSE Sensex 17,473
during 4QFY2010 owing to the 416bp contraction in Raw Material costs,
which accounted for 68.6% (72.8%) of Net Sales. TVSM recorded Net Profit of Nifty 5,245
Rs20.3cr (Rs14.6cr), up 38.9% yoy. During the quarter, the company wrote off
the Rs89.0cr one-time loss on sale of investments in TVS Finance and Services Reuters Code TVSM.BO
as well as registered gain of Rs54.6cr from sale of land. Thus Adjusting for Bloomberg Code TVSL@IN
these EOI (net Rs38.2cr), PAT (including Tax write back of Rs13.9cr) stood at
Rs44.7cr. Shareholding Pattern (%)
Promoters 60.5
Outlook and Valuation: We estimate the company to clock 15% CAGR in
Top-line, and around 42% CAGR in Net Profit over FY2010-12E, aided by MF/Banks/Indian FIs 17.8
around 13% CAGR in Volume and improving Operating performance on
FII/NRIs/OCBs 6.0
better Operating leverage. Thus, we expect TVSM to clock EPS of Rs5.7 in
FY2011E and Rs7.4 in FY2012E. Nonetheless, considering the company’s Indian Public 15.7
inconsistent track record, we remain cautious on its relative performance vis-à-
Abs. (%) 3m 1yr 3yr
vis peers. At the CMP, the stock is trading at 15.4x FY2011E and 11.8x
FY2012E Earnings. We recommend a Neutral view on TVSM owing to the Sensex 2.5 60.3 25.7
recent run up in the stock price. At our Target multiple of 12x FY2012E
Earnings, our Fair Value works out to Rs89. TVS Motor 19.8 214.0 54.4
Key Financials
Y/E March (Rs cr) FY2009 FY2010E FY2011E FY2012E
Net Sales 3,737 4,424 5,263 5,847
% chg 16.1 18.4 19.0 11.1
Net Profit 31.1 86.5 135.1 175.6
% chg (5.9) 178.1 56.2 30.0
OPM (%) 5.0 6.3 6.6 6.8
EPS (Rs) 1.3 3.6 5.7 7.4
P/E (x) 66.9 24.1 15.4 11.8
P/BV (x) 2.6 2.5 2.3 2.1
RoE (%) 4.2 10.5 15.1 18.0
RoCE (%) 4.6 9.9 13.3 15.8
EV/Sales (x) 0.7 0.6 0.5 0.5 Vaishali Jajoo
Tel: 022 – 4040 3800 Ext: 344
EV/EBITDA (x) 13.0 9.4 7.9 7.5
E-mail: vaishali.jajoo@angeltrade.com
Source: Company, Angel Research
1
Please refer to important disclosures at the end of this report Sebi Registration No: INB 010996539
2. TVS Motor I 4QFY2010 Result Update
Top-line in line with expectations: For 4QFY2010, TVSM reported Turnover of
Rs1,216cr (Rs909cr), a jump of 33.7% yoy, which primarily came on the back of the
27.8% increase in Volumes and 8.7% yoy jump in Realisations. The company’s
Motorcycle, Scooter and Moped Sales grew 22%, 35.4% and 31.5% yoy respectively,
in 4QFY2010. During the quarter, the company exported 55,282 (46,923) two
wheelers, increase of 17.8% yoy.
OPM expands by 118bp, Raw material cost dips: TVSM’s Operating Margin
expanded by 118bp during 4QFY2010 on account of the 416bp contraction in Raw
Material costs, which accounted for 68.6% (72.8%) of Net Sales. Staff Costs during
the quarter increased by 167bp yoy, owing to the Rs7.3cr VRS expenses. Thus, OPM
expansion was restricted by the increase in Staff cost and Other expenditure by
132bp (includes amortisation of moulds and dies), and new product launches to the
extent of Rs15.5cr (Rs14.4cr) in 4QFY2010.
Bottom-line at Rs20.3cr: TVSM recorded Net Profit of Rs20.3cr (Rs14.6cr). The
company wrote off the Rs89cr one-time loss on sale of investments in TVS Finance
and Services during 4QFY2010, and registered a gain of Rs54.6cr on sale of land.
Adjusting for these EOI (net Rs38.2cr), PAT (including Tax write back of Rs13.9cr)
stood at Rs44.7cr, which is better than our expectation of Rs35cr. This was primarily
due to the better Operational performance including the 11.4% yoy dip in Interest
costs, and 71.4% yoy increase in Other Income. Management is quite optimistic
about the company’s future outlook owing to the good performance registered by
the Scooters and Moped Segments. In FY2011E, Volumes are expected to be
generated from TVS-Flame, TVS Jive and TVS Wego.
Exhibit 1: Sales Volume
Product 4QFY2010 4QFY2009 % chg FY2010 FY2009 % chg
Motorcycles 182,212 149,403 22.0 640,960 635,905 0.8
Scooters 81,030 59,851 35.4 309,501 255,364 21.2
Mopeds 149,616 113,764 31.5 571,563 438,438 30.4
Total 412,858 323,018 27.8 1,522,024 1,329,707 14.463
Exports (out
55,282 46,923 17.8 167,651 193,398 (13.3)
of above)
Source: Company, Angel Research
Exhibit 2: Motorcycle Segment Volume
Units %
Market Share (RHS) Scooter-Volume (LHS) % yoy growth (RHS)
80,000 40
30
70,000
20
60,000 10
50,000 0
(10)
40,000
(20)
30,000 (30)
1QFY2007
2QFY2007
3QFY2007
4QFY2007
1QFY2008
2QFY2008
3QFY2008
4QFY2008
1QFY2009
2QFY2009
3QFY2009
4QFY2009
1QFY2010
2QFY2010
3QFY2010
4QFY2010
Source: SIAM, Angel Research
April 21, 2010 2
4. TVS Motor I 4QFY2010 Result Update
Outlook and Valuation
Going ahead, TVSM will have to counter intensive competitive pressures, particularly
from Bajaj Auto, Hero Honda and HMSI, which are launching new bikes and
reducing prices in their bid to boost Volumes. Moreover, TVSM’s inconsistent
performance on the Volume and Margin fronts is a key concern, as it has not been
able to tackle the pricing pressures in the last couple of years. However, recent
launch of the 125cc Flame, Jive, Wego and three-wheelers would provide some
respite on the Margin front, going ahead, which is also reflected in the company’s
FY2010 performance. However, we believe that the overall scenario will remain
challenging for the company in terms of price competition. It has also been losing
market share in the domestic market in the Motorcycle and Scooter Segments since
the last two years. The only relief has been the Export growth. However, Exports also
registered a decline in FY2010 due to the overall economic downturn.
We estimate the company to clock 15% CAGR in Top-line, and around 42% CAGR
in Net Profit over FY2010-12E, aided by around 13% CAGR in Volume and
improving Operating performance on better Operating leverage. Thus, we expect
TVSM to clock EPS of Rs5.7 in FY2011E and Rs7.4 in FY2012E. Nonetheless,
considering the company’s inconsistent track record, we remain cautious on its
relative performance vis-à-vis peers. At the CMP, the stock is trading at 15.4x
FY2011E and 11.8x FY2012E Earnings. We recommend a Neutral (Accumulate
earlier) view on TVSM owing to run up in the stock price in recent months. At our
Target multiple of 12x FY2012E Earnings, our Fair Value works out to Rs89.
Exhibit 5: P/E Band
180
150
24x
120
Share Price (Rs)
18x
90
12x
60
6x
30
0
Aug-02
Aug-03
Aug-04
Aug-05
Aug-06
Aug-07
Aug-08
Aug-09
Dec-02
Dec-03
Dec-04
Dec-05
Dec-06
Dec-07
Dec-08
Dec-09
Apr-02
Apr-03
Apr-04
Apr-05
Apr-06
Apr-07
Apr-08
Apr-09
Apr-10
Source: C-Line, Angel Research
Exhibit 6: Relative Performance
300
200
100
0
Aug-08
Aug-09
Jun-08
Jun-09
May-08
Jul-08
Dec-08
Jan-09
May-09
Jul-09
Dec-09
Jan-10
Apr-08
Apr-09
Apr-10
Mar-08
Oct-08
Feb-09
Mar-09
Oct-09
Feb-10
Mar-10
Sep-08
Sep-09
Nov-08
Nov-09
TVS HH BAL Sensex
Source: C-Line, Angel Research
April 21, 2010 4
7. TVS Motor I 4QFY2010 Result Update
Research Team Tel: 4040 3800 E-mail: research@angeltrade.com Website: www.angeltrade.com
DISCLAIMER
This document is solely for the personal information of the recipient, and must not be singularly used as the basis of any investment decision. Nothing in this
document should be construed as investment or financial advice. Each recipient of this document should make such investigations as they deem necessary to
arrive at an independent evaluation of an investment in the securities of the companies referred to in this document (including the merits and risks involved),
and should consult their own advisors to determine the merits and risks of such an investment.
Angel Securities Limited, its affiliates, directors, its proprietary trading and investment businesses may, from time to time, make investment decisions that are
inconsistent with or contradictory to the recommendations expressed herein. The views contained in this document are those of the analyst, and the company
may or may not subscribe to all the views expressed within.
Reports based on technical and derivative analysis center on studying charts of a stock's price movement, outstanding positions and trading volume, as
opposed to focusing on a company's fundamentals and, as such, may not match with a report on a company's fundamentals.
The information in this document has been printed on the basis of publicly available information, internal data and other reliable sources believed to be true,
and is for general guidance only. Angel Securities Limited has not independently verified all the information contained within this document. Accordingly, we
cannot testify, nor make any representation or warranty, express or implied, to the accuracy, contents or data contained within this document. While Angel
Securities Limited endeavours to update on a reasonable basis the information discussed in this material, there may be regulatory, compliance, or other
reasons that prevent us from doing so.
This document is being supplied to you solely for your information, and its contents, information or data may not be reproduced, redistributed or passed on,
directly or indirectly.
Angel Securities Limited and its affiliates may seek to provide or have engaged in providing corporate finance, investment banking or other advisory services
in a merger or specific transaction to the companies referred to in this report, as on the date of this report or in the past.
Neither Angel Securities Limited, nor its directors, employees or affiliates shall be liable for any loss or damage that may arise from or in connection with the
use of this information.
Note: Please refer to the important `Stock Holding Disclosure' report on the Angel website (Research Section).
Disclosure of Interest Statement TVS Motor
1. Analyst ownership of the stock No
2. Angel and its Group companies ownership of the stock No
3. Angel and its Group companies’ Directors ownership of the stock No
4. Broking relationship with company covered No
Note: We have not considered any Exposure below Rs 1 lakh for Angel and its Group companies.
Address: Acme Plaza, ‘A’ Wing, 3rd Floor, M.V. Road, Opp. Sangam Cinema, Andheri (E), Mumbai - 400 059.
Tel : (022) 3952 4568 / 4040 3800
Angel Broking Ltd: BSE Sebi Regn No : INB 010996539 / CDSL Regn No: IN - DP - CDSL - 234 - 2004 / PMS Regn Code: PM/INP000001546 Angel Securities Ltd:BSE: INB010994639/INF010994639 NSE:
INB230994635/INF230994635 Membership numbers: BSE 028/NSE:09946
Angel Capital & Debt Market Ltd: INB 231279838 / NSE FNO: INF 231279838 / NSE Member code -12798 Angel Commodities Broking (P) Ltd: MCX Member ID: 12685 / FMC Regn No: MCX / TCM /
CORP / 0037 NCDEX : Member ID 00220 / FMC Regn No: NCDEX / TCM / CORP / 0302
April 21, 2010 7