1. 4QFY2010 Result Update I Infrastructure
May 10, 2010
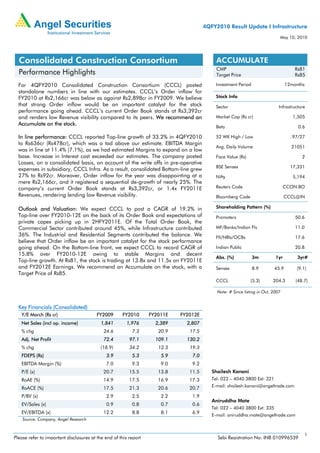
Consolidated Construction Consortium ACCUMULATE
CMP Rs81
Performance Highlights Target Price Rs85
For 4QFY2010 Consolidated Construction Consortium (CCCL) posted Investment Period 12months
standalone numbers in line with our estimates. CCCL’s Order inflow for
FY2010 at Rs2,166cr was below as against Rs2,898cr in FY2009. We believe Stock Info
that strong Order inflow would be an important catalyst for the stock Sector Infrastructure
performance going ahead. CCCL’s current Order Book stands at Rs3,392cr
and renders low Revenue visibility compared to its peers. We recommend an Market Cap (Rs cr) 1,505
Accumulate on the stock.
Beta 0.6
In line performance: CCCL reported Top-line growth of 33.2% in 4QFY2010 52 WK High / Low 97/27
to Rs636cr (Rs478cr), which was a tad above our estimate. EBITDA Margin
Avg. Daily Volume 21051
was in line at 11.4% (7.1%), as we had estimated Margins to expand on a low
base. Increase in Interest cost exceeded our estimates. The company posted Face Value (Rs) 2
Losses, on a consolidated basis, on account of the write offs in pre-operative
BSE Sensex 17,331
expenses in subsidiary, CCCL Infra. As a result, consolidated Bottom-line grew
27% to Rs92cr. Moreover, Order inflow for the year was disappointing at a Nifty 5,194
mere Rs2,166cr, and it registered a sequential de-growth of nearly 25%. The
company’s current Order Book stands at Rs3,392cr, or 1.4x FY2011E Reuters Code CCON.BO
Revenues, rendering lending low Revenue visibility. Bloomberg Code CCCL@IN
Outlook and Valuation: We expect CCCL to post a CAGR of 19.2% in Shareholding Pattern (%)
Top-line over FY2010-12E on the back of its Order Book and expectations of Promoters 50.6
private capex picking up in 2HFY2011E. Of the Total Order Book, the
Commercial Sector contributed around 45%, while Infrastructure contributed MF/Banks/Indian FIs 11.0
36%. The Industrial and Residential Segments contributed the balance. We FII/NRIs/OCBs 17.6
believe that Order inflow be an important catalyst for the stock performance
going ahead. On the Bottom-line front, we expect CCCL to record CAGR of Indian Public 20.8
15.8% over FY2010-12E owing to stable Margins and decent
Abs. (%) 3m 1yr 3yr#
Top-line growth. At Rs81, the stock is trading at 13.8x and 11.5x on FY2011E
and FY2012E Earnings. We recommend an Accumulate on the stock, with a Sensex 8.9 45.9 (9.1)
Target Price of Rs85.
CCCL (5.3) 204.3 (48.7)
Note: # Since listing in Oct, 2007
Key Financials (Consolidated)
Y/E March (Rs cr) FY2009 FY2010 FY2011E FY2012E
Net Sales (incl op. income) 1,841 1,976 2,389 2,807
% chg 24.6 7.3 20.9 17.5
Adj. Net Profit 72.4 97.1 109.1 130.2
% chg (18.9) 34.2 12.3 19.3
FDEPS (Rs) 3.9 5.3 5.9 7.0
EBITDA Margin (%) 7.0 9.3 9.0 9.2
P/E (x) 20.7 15.5 13.8 11.5 Shailesh Kanani
RoAE (%) 14.9 17.5 16.9 17.3 Tel: 022 – 4040 3800 Ext: 321
RoACE (%) 17.5 21.3 20.6 20.7 E-mail: shailesh.kanani@angeltrade.com
P/BV (x) 2.9 2.5 2.2 1.9
Aniruddha Mate
EV/Sales (x) 0.9 0.8 0.7 0.6
Tel: 022 – 4040 3800 Ext: 335
EV/EBITDA (x) 12.2 8.8 8.1 6.9
E-mail: aniruddha.mate@angeltrade.com
Source: Company, Angel Research
1
Please refer to important disclosures at the end of this report Sebi Registration No: INB 010996539
2. CCCL I 4QFY2010 Result Update
Exhibit 1: 4QFY2010 Performance (Standalone)
Y/E March (Rs cr) 4QFY10 4QFY09 % chg FY10 FY09 % chg
Net Sales 636.3 477.6 33.2 1950.0 1755.9 11.1
Total Expenditure 563.9 443.9 27.0 1767.0 1640.5 7.7
Operating Profit 72.3 33.7 114.5 183.0 115.3 58.7
OPM (%) 11.4 7.1 9.4 6.6
Interest 14.6 3.4 330.4 31.3 11.2 178.3
Depreciation 2.9 2.4 19.8 10.0 8.2 21.1
Non Operating Income 2.4 3.6 - 6.3 9.1 (31.0)
Nonrecurring items 0.0 0.0 0.0 0.0 0.0 0.0
Profit Before Tax 57.2 31.5 81.9 148.0 104.9 41.1
Tax 18.2 10.9 66.6 49.1 36.0 36.5
Reported PAT 39.1 20.6 90.0 98.9 69.0 43.4
PAT (%) 6.1 4.3 5.1 3.9
Adjusted PAT 39.1 20.6 90.0 98.9 69.0 43.4
Adj. PAT (%) 6.1 4.3 5.1 3.9
FDEPS 2.1 1.1 90.0 5.4 3.7 43.4
Source: Company, Angel Research
Order Book remains subdued
Over the last 12 months, CCCL registered orders much below its peers at Rs2,166cr,
or 1x FY2010 Revenues. Since inception, CCCL’s top management (ex-L&T
employees) have been focusing on building a strong process driven organisation.
Compared to peers, the company has better control systems for bidding and
monitoring projects. The company follows a rigorous RoCE-based bidding process
resulting in quality Order Book. However, this has resulted in low Revenue visibility
for CCCL compared to its peers.
Exhibit 2: Order Book chart
1,600 2.5
1,400 2.0
1.9 1.8 1.9 1.8
1.7 2.0
1,200
1.5
1.5
1,000 1.5
(Rs cr)
(x)
800
600 1.0
400
0.5
200
0 -
1QFY09
2QFY09
3QFY09
4QFY09
1QFY10
2QFY10
3QFY10
4QFY10
Revenue Order Inflow Order Book/sales
Source: Company, Angel Research
Outlook and Valuation
We have valued CCCL on P/E basis to capture long-term value creation from the
construction opportunity and growing infra spends, particularly for
the sub-contractors. Considering CCCL’s small size of operations compared to peers
IVRCL Infrastructure, Simplex Infrastructure, Nagarjuna Construction and Hindustan
Construction, we have assigned 10-15% discount to its Target P/E multiple. At Rs81,
the stock is trading at 13.8x and 11.5x on FY2011E and FY2012E Earnings. At our
Target P/E of 12x FY2012E EPS, we have arrived at a Fair Value of Rs85 for the
stock. On P/BV basis, the stock is trading at 1.9x FY2012E Book Value.
We recommend an Accumulate on the stock, with a Target Price of Rs85.
May 10, 2010 2
3. CCCL I 4QFY2010 Result Update
Profit & Loss Statement (Consolidated) (Rs cr)
Y/E March FY2007 FY2008 FY2009 FY2010 FY2011E FY2012E
Net Sales 868 1,477 1,841 1,976 2,389 2,807
Other operating income - - - - - -
Total operating income 868 1,477 1,841 1,976 2,389 2,807
% chg 103.6 70.1 24.6 7.3 20.9 17.5
Total Expenditure 794 1,308 1,712 1,791 2,175 2,550
Net Raw Materials 713 959 1,439 1,395 1,705 1,993
Other Mfg costs - 217 47 144 188 222
Personnel 40 71 106 114 139 163
Other 40 61 120 138 143 171
EBITDA 75 169 128 185 214 258
% chg 113.4 126.8 (24.1) 43.8 15.8 20.5
(% of Net Sales) 8.6 11.5 7.0 9.3 9.0 9.2
Depreciation& Amortisation 4 6 9 11 15 19
EBIT 71 164 120 174 199 239
% chg 114.6 130.6 (27.0) 45.3 14.5 20.0
(% of Net Sales) 8.2 11.1 6.5 8.8 8.3 8.5
Interest & other Charges 7 12 18 33 43 52
Other Income (incl pft from Ass/JV) - 8 9 6 10 10
(% of PBT) - 4.9 8.5 4.3 5.8 5.3
Recurring PBT 64 160 111 147 165 197
% chg 120.9 149.5 (31.0) 33.4 12.0 19.3
Extraordinary Expense/(Inc.) - 0 - 5 - -
PBT (reported) 64 160 111 142 165 197
Tax 16 45 38 50 56 67
(% of PBT) 25.7 28.3 34.5 35.5 34.0 34.0
PAT (reported) 48 115 72 92 109 130
Add: Share of earnings of associate
Less: Minority interest (MI) - - - - - -
Prior period items - - - - - -
PAT after MI (reported) 48 115 72 92 109 130
ADJ. PAT 48 89 72 97 109 130
% chg 147.1 87.2 (18.9) 34.2 12.3 19.3
(% of Net Sales) 5.5 6.0 3.9 4.9 4.6 4.6
Basic EPS (Rs) (Reported) 7.2 6.2 3.9 5.0 5.9 7.0
Fully Diluted EPS (Rs) (Diluted) 2.6 4.8 3.9 5.3 5.9 7.0
% chg 87.2 (18.9) 34.2 12.3 19.3
May 10, 2010 3
6. CCCL I 4QFY2010 Result Update
Research Team Tel: 022-4040 3800 E-mail: research@angeltrade.com Website: www.angeltrade.com
DISCLAIMER
This document is solely for the personal information of the recipient, and must not be singularly used as the basis of any investment decision. Nothing in this
document should be construed as investment or financial advice. Each recipient of this document should make such investigations as they deem necessary to
arrive at an independent evaluation of an investment in the securities of the companies referred to in this document (including the merits and risks involved),
and should consult their own advisors to determine the merits and risks of such an investment.
Angel Securities Limited, its affiliates, directors, its proprietary trading and investment businesses may, from time to time, make investment decisions that are
inconsistent with or contradictory to the recommendations expressed herein. The views contained in this document are those of the analyst, and the company
may or may not subscribe to all the views expressed within.
Reports based on technical and derivative analysis center on studying charts of a stock's price movement, outstanding positions and trading volume, as
opposed to focusing on a company's fundamentals and, as such, may not match with a report on a company's fundamentals.
The information in this document has been printed on the basis of publicly available information, internal data and other reliable sources believed to be true,
and are for general guidance only. Angel Securities Limited has not independently verified all the information contained within this document. Accordingly,
we cannot testify, nor make any representation or warranty, express or implied, to the accuracy, contents or data contained within this document. While Angel
Securities Limited endeavours to update on a reasonable basis the information discussed in this material, there may be regulatory, compliance, or other
reasons that prevent us from doing so.
This document is being supplied to you solely for your information, and its contents, information or data may not be reproduced, redistributed or passed on,
directly or indirectly.
Angel Securities Limited and its affiliates may seek to provide or have engaged in providing corporate finance, investment banking or other advisory services
in a merger or specific transaction to the companies referred to in this report, as on the date of this report or in the past.
Neither Angel Securities Limited nor its directors, employees and affiliates shall be liable for any loss or damage that may arise from or in connection with the
use of this information.
Note: Please refer to the important `Stock Holding Disclosure' report on the Angel website (Research Section).
Disclosure of Interest Statement CCCL
1. Analyst ownership of the stock No
2. Angel and its Group companies ownership of the stock No
3. Angel and its Group companies’ Directors ownership of the stock No
4. Broking relationship with company covered No
Note: We have not considered any Exposure below Rs 1 lakh for Angel and its Group companies.
Address: Acme Plaza, ‘A’ Wing, 3rd Floor, M.V. Road, Opp. Sangam Cinema, Andheri (E), Mumbai - 400 059.
Tel : (022) 3952 4568 / 4040 3800
Angel Broking Ltd: BSE Sebi Regn No : INB 010996539 / CDSL Regn No: IN - DP - CDSL - 234 - 2004 / PMS Regn Code: PM/INP000001546 Angel Securities Ltd:BSE: INB010994639/INF010994639 NSE:
INB230994635/INF230994635 Membership numbers: BSE 028/NSE:09946
Angel Capital & Debt Market Ltd: INB 231279838 / NSE FNO: INF 231279838 / NSE Member code -12798 Angel Commodities Broking (P) Ltd: MCX Member ID: 12685 / FMC Regn No: MCX / TCM /
CORP / 0037 NCDEX : Member ID 00220 / FMC Regn No: NCDEX / TCM / CORP / 0302
May 10, 2010 6