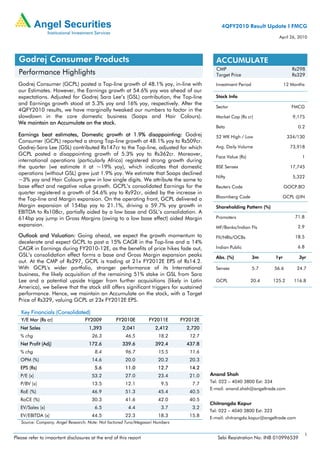
SlideShare a Scribd company logo
1 of 9
Download to read offline
4QFY2010 Result Update I FMCG
                                                                                                                           April 26, 2010


  Godrej Consumer Products                                                                  ACCUMULATE
                                                                                            CMP                                    Rs298
  Performance Highlights                                                                    Target Price                           Rs329
  Godrej Consumer (GCPL) posted a Top-line growth of 48.1% yoy, in-line with               Investment Period                    12 Months
  our Estimates. However, the Earnings growth at 54.6% yoy was ahead of our
  expectations. Adjusted for Godrej Sara Lee’s (GSL) contribution, the Top-line            Stock Info
  and Earnings growth stood at 5.3% yoy and 16% yoy, respectively. After the
                                                                                           Sector                                  FMCG
  4QFY2010 results, we have marginally tweaked our numbers to factor in the
  slowdown in the core domestic business (Soaps and Hair Colours).                         Market Cap (Rs cr)                      9,175
  We maintain an Accumulate on the stock.
                                                                                           Beta                                       0.2
  Earnings beat estimates, Domestic growth at 1.9% disappointing: Godrej                   52 WK High / Low                      334/130
  Consumer (GCPL) reported a strong Top-line growth at 48.1% yoy to Rs509cr.
  Godrej-Sara Lee (GSL) contributed Rs147cr to the Top-line, adjusted for which            Avg. Daily Volume                      73,918
  GCPL posted a disappointing growth of 5.3% yoy to Rs362cr. Moreover,
                                                                                           Face Value (Rs)                             1
  international operations (particularly Africa) registered strong growth during
  the quarter (we estimate it at ~19% yoy), which indicates that domestic                  BSE Sensex                             17,745
  operations (without GSL) grew just 1.9% yoy. We estimate that Soaps declined
                                                                                           Nifty                                   5,322
  ~3% yoy and Hair Colours grew in low single digits. We attribute the same to
  base effect and negative value growth. GCPL’s consolidated Earnings for the              Reuters Code                         GOCP.BO
  quarter registered a growth of 54.6% yoy to Rs92cr, aided by the increase in
                                                                                           Bloomberg Code                       GCPL @IN
  the Top-line and Margin expansion. On the operating front, GCPL delivered a
  Margin expansion of 154bp yoy to 21.1%, driving a 59.7% yoy growth in                    Shareholding Pattern (%)
  EBITDA to Rs108cr, partially aided by a low base and GSL’s consolidation. A
  614bp yoy jump in Gross Margins (owing to a low base effect) aided Margin                Promoters                                 71.8
  expansion.                                                                               MF/Banks/Indian FIs                        2.9
  Outlook and Valuation: Going ahead, we expect the growth momentum to                     FII/NRIs/OCBs                             18.5
  decelerate and expect GCPL to post a 15% CAGR in the Top-line and a 14%
  CAGR in Earnings during FY2010-12E, as the benefits of price hikes fade out,             Indian Public                              6.8
  GSL’s consolidation effect forms a base and Gross Margin expansion peaks                 Abs. (%)            3m         1yr         3yr
  out. At the CMP of Rs297, GCPL is trading at 21x FY2012E EPS of Rs14.2.
  With GCPL's wider portfolio, stronger performance of its International                   Sensex              5.7       56.6        24.7
  business, the likely acquisition of the remaining 51% stake in GSL from Sara
  Lee and a potential upside trigger from further acquisitions (likely in Latin            GCPL              20.4        125.2      116.8
  America), we believe that the stock still offers significant triggers for sustained
  performance. Hence, we maintain an Accumulate on the stock, with a Target
  Price of Rs329, valuing GCPL at 23x FY2012E EPS.

   Key Financials (Consolidated)
   Y/E Mar (Rs cr)                 FY2009         FY2010E         FY2011E      FY2012E
   Net Sales                         1,393           2,041          2,412        2,720
   % chg                              26.3             46.5           18.2        12.7
   Net Profit (Adj)                  172.6           339.6          392.4        437.8
   % chg                                8.4            96.7           15.5        11.6
   OPM (%)                            14.6             20.0           20.2        20.3
   EPS (Rs)                             5.6            11.0           12.7        14.2
   P/E (x)                            53.2             27.0           23.4        21.0   Anand Shah
   P/BV (x)                           13.5             12.1            9.5         7.7   Tel: 022 – 4040 3800 Ext: 334
                                                                                         E-mail: anand.shah@angeltrade.com
   RoE (%)                            46.9             51.3           45.4        40.5
   RoCE (%)                           30.3             41.6           42.0        40.5
                                                                                         Chitrangda Kapur
   EV/Sales (x)                         6.5             4.4            3.7         3.2
                                                                                         Tel: 022 – 4040 3800 Ext: 323
   EV/EBITDA (x)                      44.5             22.3           18.3        15.8   E-mail: chitrangda.kapur@angeltrade.com
   Source: Company, Angel Research; Note: Not factored Tura/Megasari Numbers

                                                                                                                                            1
Please refer to important disclosures at the end of this report                             Sebi Registration No: INB 010996539
GCPL I 4QFY2010 Result Update


                 Exhibit 1: Quarterly Performance Update (Consolidated)
                  Y/E March (Rs cr)                4QFY10    4QFY09    % chg   FY2010    FY2009    % chg
                  Net Sales                          509.2     343.9    48.1   2,041.2   1,393.0    46.5
                  Consumption of RM                  226.8     174.3    30.1    946.3     769.5     23.0
                  (% of Sales)                        44.5      50.7              46.4      55.2
                  Staff Cost                          32.7      24.2    34.9    187.7      87.6    114.4
                  (% of Sales)                         6.4       7.0               9.2       6.3
                  Advertising                         34.5      15.3   125.2    172.1      99.7     72.5
                  (% of Sales)                         6.8       4.5               8.4       7.2
                  Other Expenses                     107.7      62.8    71.6    327.8     232.4     41.0
                  (% of Sales)                        21.2      18.3              16.1      16.7
                  Total Expenditure                  401.7    276.6     45.2   1,633.9   1,189.3    37.4
                  Operating Profit                   107.5      67.3    59.7    407.3     203.7     99.9
                  OPM (%)                             21.1      19.6              20.0      14.6
                  Interest                             2.7       4.8             11.1      20.1
                  Depreciation/Amortisation            6.1       4.0    50.0     23.6      19.2     22.7
                  Other Income                        12.2      10.3    18.4     47.3      44.8      5.6
                  PBT (excl Ext. Items)              111.0      68.8    61.3    419.9     209.2    100.7
                  Ext Income/(Expenses)                0.0       0.0               0.0       0.0
                  PBT (incl Ext. Items)              111.0      68.8    61.3    419.9     209.2    100.7
                  (% of Sales)                        21.8      20.0              20.6      15.0
                  Prov. for Taxation                  19.2       9.4   103.8     80.3      36.0    123.4
                  (% of PBT)                          17.3      13.7              19.1      17.2
                  Recurring PAT                       91.8      59.4    54.6    339.6     173.3     96.0
                  PATM (%)                            18.0      17.3              16.6      12.4
                  Reported PAT                        91.8      59.4    54.6    339.6     173.3     96.0
                  Equity Shares (cr)                  30.8      25.7             30.8      25.7
                  EPS (Rs)                             3.0       2.3    28.9     11.0        6.7    63.4
                 Source: Company, Angel Research


                 Godrej Sara Lee drives Top-line growth; adjusted growth at 5.3% yoy
                 disappointing

                 Godrej Consumer (GCPL) reported strong Top-line growth at 48.1% yoy to Rs509cr
                 (Rs344cr), in-line with our expectations of a 51% yoy growth to Rs519cr.
                 Godrej-Sara Lee (GSL) contributed Rs147cr to the Top-line for the quarter. However,
                 adjusted for GSL’s revenue, GCPL posted a growth of 5.3% yoy to Rs362cr which
                 was below our expectation. Moreover, international operations (particularly Africa)
                 registered strong growth during the quarter (we estimate it at ~19% yoy) which
                 indicates that domestic operations (without GSL) grew just 1.9% yoy. While our talks
                 with the management indicate pressure on volumes but no significant decline in
                 Soaps or Hair Colour, the muted growth in domestic business (we had modeled in
                 moderation) has come as a negative surprise to us. We attribute the same to base
                 effect and negative value growth.

                 Margin expansion boosts Earnings, which grow 54.6% yoy

                 GCPL’s consolidated Earnings for the quarter registered a growth of 54.6% yoy to
                 Rs92cr (Rs59cr), ahead of our estimates of a 37% yoy growth to Rs81cr. In terms of
                 Earnings, GSL’s consolidation contributed Rs23cr during the quarter, adjusted for
                 which the growth in Bottom-line stood at 16% yoy to Rs69cr. The robust growth in
                 the Top-line and Margin expansion boosted Earnings. However, in terms of EPS
                 (adjusted for dilution of share swap to acquire GSL), GCPL registered a growth of
                 28.9% yoy to Rs3 (Rs2.3).


April 26, 2010                                                                                             2
GCPL I 4QFY2010 Result Update


                 OPM expands 154bp, aided by 614bp Gross Margin expansion

                 At the operating front, GCPL delivered a Margin expansion of 154bp yoy to 21.1%
                 (19.6%), driving a 59.7% yoy growth in EBITDA to Rs108cr (Rs67cr), partially aided
                 by a low base and GSL’s consolidation. A 614bp yoy jump in Gross Margins (owing
                 to a low base effect) and a decrease of 62bp yoy in Staff costs were the key drivers
                 behind the Margin expansion. However, higher Other expenditure (up 290bp yoy)
                 and a jump in Advertising spends (up 232bp yoy) kept Margins under check. Going
                 ahead, we expect input costs for GCPL to rise, as palm oil prices have hardened
                 during the quarter and as the benefits of inventory/price covers fade away. We have
                 modeled in a 200bp contraction in Gross Margins during FY2010-12E.

                 Soaps Revenue declines ~3%; Hair Colour growth moderates to low
                 single digits

                 GCPL’s Soaps business registered a decline of ~3%, largely owing to a high base
                 effect (4QFY2009 saw soaps clocking a 46% yoy growth) and negative value
                 growth. Our talks with the management indicate pressure on volume growth, but no
                 significant decline. Near-term growth in Soaps is likely to be driven by an increasing
                 focus on smaller packs (to drive rural penetration) and the successful launch of new
                 variants. The company continued to be the second-largest toilet soaps player in
                 India, increasing its market share to 10.5% from 9.4% in March 2009 (increased
                 sequentially, as well, by 20bp). Godrej No1 was re-launched in April 2010, with a
                 new shape, packaging and natural oils, and Cinthol Regular was launched in small
                 packs, priced at Rs6. Going ahead, we expect GCPL to witness increased competitive
                 pressures, owing to higher investments, and aggression from HUL and ITC.
                 Moreover, higher food inflation and the fading effect of price hikes, coupled with
                 higher competitive intensity, are likely to lead to a moderation in the revenue of this
                 segment.

                 GCPL’s Hair Colour business witnessed a moderation in growth to mid single digits,
                 owing to negative value growth and pressure on the volume front. GCPL maintained
                 its marketshare in the category on a sequential basis at 33.3%.

                 International Business on a strong footing; Keyline witnesses a slow-down

                 The performance of the International business registered yet another quarter of
                 steady gains, registering an overall growth of ~19% yoy, largely aided by significant
                 revenue traction in the Rapidol and Kinky businesses. For the full year FY2010,
                 Keyline Brands (UK), registered a muted growth of 9% yoy. However, African
                 operations, namely Rapidol (South Africa) and Kinky, posted a robust growth of 42%
                 yoy and 41% yoy, respectively, in INR terms. However, the Profitability of the
                 international operations came under pressure during the quarter (due to currency
                 volatility), and registered a decline of 18% to Rs2.5cr (Rs3.1cr).

                  Exhibit 2: Key Subsidiaries Performance (Consolidated)
                  Y/E Mar (Rs cr)                  4QFY10   4QFY09     % chg   FY2010   FY2009   % chg
                  Sales (Rs cr)
                  Keyline Brands                     45.5     43.5        4     218.6    200.6       9
                  Rapidol                            17.6     11.0       60      69.4     48.8      42
                  Kinky Group                        13.9     10.7       30      72.3     51.4      41
                  GGME                                4.5      3.0       50      17.7     12.2      45
                  Total Sales - Subsidiaries         81.4     68.2       19     378.0    313.1      21
                 Source: Company, Angel Research


April 26, 2010                                                                                        3
GCPL I 4QFY2010 Result Update


                 Outlook and Valuation

                 After the 4QFY2010 results, we have marginally tweaked our numbers to factor in a
                 slowdown in the core domestic business (Soaps and Hair Colours). However, owing
                 to the strong growth in the insecticides business (Godrej Sara Lee) and the steady
                 performance of the International business (particularly Africa), our Top-line estimate
                 is largely unchanged. We have revised our Operating Margin marginally upwards to
                 factor in a higher Gross Margin (despite modeling almost a 200bp contraction over
                 FY2010-12E). However, inability to take price hikes (due to competitive pressures),
                 the impact of currency volatility on international operations and higher-than-
                 anticipated advertising spends carry downside risks to our estimates.

                 Exhibit 3: Revision in Estimates
                                                                     Old Estimate                                                                                    New Estimate                                                                                   % chg
                 (Rs cr)                                           FY11E      FY12E                                                                                FY11E       FY12E                                                                            FY11E     FY12E
                 Revenue                                           2,420      2,742                                                                                2,412       2,720                                                                             (0.3)     (0.8)
                 OPM (%)                                                 19.9                                       20.2                                                  20.2                                          20.3                                         25bp                                     5bp
                 EPS                                                     12.6                                       14.3                                                  12.7                                          14.2                                          1.0                                    (0.7)
                 Source: Angel Research

                 FY2010E has been a year of strong growth for GCPL, driven by significant Gross
                 Margin expansion, improved traction in the international business and consolidation
                 of GSL’s business. However, going ahead, we expect the growth momentum to
                 decelerate, and expect GCPL to post a 15% CAGR in the Top-line and a 14% CAGR
                 in Earnings during FY2010-12E, as the benefits of price hikes fade out, GSL’s
                 consolidation effect forms a base and the Gross Margin expansion peaks out.

                 At the CMP of Rs297, GCPL is trading at 21x FY2012E EPS of Rs14.2. While we have
                 not factored the Tura and Megasari deals into our numbers, owing to a lack of
                 details, particularly in terms of deal size, our preliminary analysis indicates that both
                 the deals are likely to be EPS accretive. Moreover, with GCPL's wider portfolio, a
                 stronger performance of its International business, the likely acquisition of the
                 remaining 51% stake in GSL from Sara Lee and a potential upside trigger from
                 further acquisitions (likely in Latin America), we believe that the stock still offers
                 significant triggers for sustained performance. Hence, we maintain an Accumulate
                 on the stock, with a Target Price of Rs329, valuing GCPL at 23x FY2012E EPS.


                 Exhibit 4: 1-year forward P/E band
                                      350                                                         14x                                                     18x                                                          22x                                                     26x

                                      300

                                      250
                   Share Price (Rs)


                                      200

                                      150

                                      100

                                      50

                                       -
                                                                                Dec-05


                                                                                                                                      Dec-06


                                                                                                                                                                                            Dec-07


                                                                                                                                                                                                                                                  Dec-08


                                                                                                                                                                                                                                                                                                        Dec-09
                                            Apr-05


                                                                                                  Apr-06


                                                                                                                                                        Apr-07


                                                                                                                                                                                                              Apr-08


                                                                                                                                                                                                                                                                    Apr-09


                                                                                                                                                                                                                                                                                                                          Apr-10
                                                                       Oct-05


                                                                                                                             Oct-06


                                                                                                                                                                                   Oct-07


                                                                                                                                                                                                                                         Oct-08


                                                                                                                                                                                                                                                                                               Oct-09
                                                              Aug-05


                                                                                         Feb-06


                                                                                                                    Aug-06


                                                                                                                                               Feb-07


                                                                                                                                                                          Aug-07


                                                                                                                                                                                                     Feb-08


                                                                                                                                                                                                                                Aug-08


                                                                                                                                                                                                                                                           Feb-09


                                                                                                                                                                                                                                                                                      Aug-09


                                                                                                                                                                                                                                                                                                                 Feb-10
                                                     Jun-05


                                                                                                           Jun-06


                                                                                                                                                                 Jun-07


                                                                                                                                                                                                                       Jun-08


                                                                                                                                                                                                                                                                             Jun-09


                 Source: Bloomberg, Angel Research


April 26, 2010                                                                                                                                                                                                                                                                                                               4
GCPL I 4QFY2010 Result Update

                 Exhibit 5: 1-year forward P/E Chart
                  35.0


                  30.0


                  25.0


                  20.0


                  15.0


                  10.0


                    5.0


                     -


                            Apr-02


                                                 Dec-02
                                                           Apr-03


                                                                               Dec-03
                                                                                         Apr-04


                                                                                                             Dec-04
                                                                                                                       Apr-05


                                                                                                                                           Dec-05
                                                                                                                                                     Apr-06


                                                                                                                                                                       Dec-06
                                                                                                                                                                                Apr-07


                                                                                                                                                                                                  Dec-07
                                                                                                                                                                                                           Apr-08


                                                                                                                                                                                                                             Dec-08
                                                                                                                                                                                                                                      Apr-09


                                                                                                                                                                                                                                                        Dec-09
                                                                                                                                                                                                                                                                 Apr-10
                                       Aug-02


                                                                     Aug-03


                                                                                                   Aug-04


                                                                                                                                 Aug-05


                                                                                                                                                              Aug-06


                                                                                                                                                                                         Aug-07


                                                                                                                                                                                                                    Aug-08


                                                                                                                                                                                                                                               Aug-09
                 Source: Bloomberg, Angel Research; Note: Red-line indicates 5-year average


                 Exhibit 6: 1-year forward Premium to Sensex Chart
                  100%

                   80%

                   60%

                   40%

                   20%

                    0%

                  -20%

                  -40%

                  -60%
                                                Dec-02


                                                                              Dec-03


                                                                                                            Dec-04


                                                                                                                                          Dec-05


                                                                                                                                                                       Dec-06


                                                                                                                                                                                                  Dec-07


                                                                                                                                                                                                                             Dec-08


                                                                                                                                                                                                                                                        Dec-09
                          Apr-02


                                                          Apr-03


                                                                                        Apr-04


                                                                                                                      Apr-05


                                                                                                                                                    Apr-06


                                                                                                                                                                                Apr-07


                                                                                                                                                                                                           Apr-08


                                                                                                                                                                                                                                      Apr-09


                                                                                                                                                                                                                                                                 Apr-10
                                     Aug-02


                                                                    Aug-03


                                                                                                  Aug-04


                                                                                                                                Aug-05


                                                                                                                                                              Aug-06


                                                                                                                                                                                         Aug-07


                                                                                                                                                                                                                    Aug-08


                                                                                                                                                                                                                                               Aug-09
                 Source: Bloomberg, Angel Research; Note: Red-line indicates 5-year average


April 26, 2010                                                                                                                                                                                                                                                     5
GCPL I 4QFY2010 Result Update


                 Profit & Loss Statement (Consolidated)                                             Rs crore
                 Y/E Mar                         FY2007   FY2008   FY2009      FY2010E    FY2011E   FY2012E
                 Gross sales                       990     1,133    1,435         2,082     2,456     2,768
                 Less: Excise duty                  38       30        42           41        43         49
                 Net Sales                         952     1,103    1,393         2,041     2,412     2,720
                 Other operating income              -         1        4             4         8         9
                 Total operating income            952     1,104    1,397         2,045     2,420     2,729
                  % chg                            36.0     16.0     26.5          46.4      18.3      12.8
                 Total Expenditure                 772      888     1,189         1,634     1,926     2,169
                 Cost of Materials                 462      518      770           946      1,148     1,314
                 Advertising Exp                    77       92        97          172       200        223
                 Personnel                          54       73        87          188       220        245
                 Others                            178      206      237           328       358        388
                 EBITDA                            180      214      204           407       486        551
                  % chg                            27.2     19.4     (5.0)        100.0      19.3      13.3
                  (% of Net Sales)                 18.9     19.5     14.6          20.0      20.2      20.3
                 Depreciation& Amortisation         14       18        19           24        28         32
                 EBIT                              165      196      184           384       458        519
                  % chg                            27.5     18.6     (6.0)        108.0      19.3      13.4
                  (% of Net Sales)                 17.4     17.8     13.2          18.8      19.0      19.1
                 Interest & other Charges           10       15        19           11        10          9
                 Other Income                        3        5        40           43        39         37
                  (% of PBT)                        1.7      2.4     19.1          10.3       7.9        6.7
                 Share in profit of Associates        -        -        -             -         -          -
                 Recurring PBT                     159      187      209           420       494        556
                  % chg                            20.0     18.3     11.6         100.7      17.5      12.6
                 Extraordinary Expense/(Inc.)      (10)        -      (1)             -         -         -
                 PBT (reported)                    168      187      210           420       494        556
                 Tax                                24       28        37           80       101        118
                 (% of PBT)                        15.4     15.1     17.5          19.1      20.5      21.3
                 PAT (reported)                    144      159      173           340       392        438
                 Add: Share of associates            -        -        -             -         -          -
                 Less: Minority interest (MI)         -        -         -            -         -          -
                 PAT after MI (reported)           144      159      173           340       392        438
                 ADJ. PAT                          134      159      173           340       392        438
                 % chg                             11.1     18.7      8.4          96.7      15.5      11.6
                 (% of Net Sales)                  14.1     14.4     12.4          16.6      16.3      16.1
                 Basic EPS (Rs)                     5.9      7.1      6.7          11.0      12.7      14.2
                 Fully Diluted EPS (Rs)             4.4      5.2      5.6          11.0      12.7      14.2
                  % chg                            11.1     18.7      8.4          96.7      15.5      11.6


April 26, 2010                                                                                            6
GCPL I 4QFY2010 Result Update


                 Balance Sheet (Consolidated)                                                               Rs crore
                 Y/E Mar                        FY2007           FY2008     FY2009      FY2010E FY2011E     FY2012E
                 SOURCES OF FUNDS
                 Equity Share Capital                 23            23         26           31       31         31
                 Preference Capital                    -              -          -            -        -          -
                 Reserves& Surplus                    99           149        541          727      940       1,161
                 Shareholders Funds               122              172        567          758      970       1,192
                 Minority Interest                     -              -          -            -        -          -
                 Total Loans                      174              187        278          233      208        183
                 Deferred Tax Liability                8             9          4            4        4          4
                 Total Liabilities                304              368        849          995     1,182      1,379
                 APPLICATION OF FUNDS
                 Gross Block                      270              294        337          486      568        632
                 Less: Acc. Depreciation          111              125        110          133      162        193
                 Net Block                        159              168        227          353      406        439
                 Capital Work-in-Progress             40            72          2           15       23         25
                 Goodwill                             89            96        209          209      209        209
                 Investments                           0             0          8            8        8          8
                 Current Assets                   278              352        733          820     1,013      1,229
                    Cash                              47            43        378          339      471        657
                    Loans & Advances                  46            67        127          153      169        177
                    Other                         184              243        228          328      373        396
                 Current liabilities              262              323        330          409      475        531
                 Net Current Assets                   16            29        403          412      538        698
                 Mis. Exp. not written off             -             3           -            -        -          -
                 Total Assets                     304              368        849          995     1,182      1,379


                 Cash Flow Statement (Consolidated)                                                         Rs crore
                 Y/E Mar                          FY2007          FY2008     FY2009 FY2010E FY2011E FY2012E
                 Profit before tax                     159           187        209         420      494       556
                 Depreciation                              14         18          19         24       28        32
                 Change in Working Capital             (12)          (22)       (45)        (47)       5        24
                 Interest / Dividend (Net)                 10         13        (17)        (25)     (20)      (18)
                 Direct taxes paid                         24         28          37         80      101       118
                 Others                                     5         (2)         (5)        (1)       1          1
                 Cash Flow from Operations             151           165        125         290      407       477
                 Inc./ (Dec.) in Fixed Assets         (129)          (63)      (156)       (161)     (90)      (67)
                 Inc./ (Dec.) in Investments             1              -         (8)          -        -         -
                 Cash Flow from Investing             (128)          (63)      (164)       (161)     (90)      (67)
                 Issue of Equity                          -             -       396           5         -         -
                 Inc./(Dec.) in loans                  105            13          90        (45)     (25)      (25)
                 Dividend Paid (Incl. Tax)                 97        109        120         153      180       216
                 Interest / Dividend (Net)                 10         13          (8)       (25)     (20)      (18)
                 Cash Flow from Financing                  (2)      (108)       375        (168)    (186)     (223)
                 Inc./(Dec.) in Cash                       21         (5)       336         (39)     132       186
                 Opening Cash balances                     26         47         43         378      339       471
                 Closing Cash balances                     47         43        378         339      471       657


April 26, 2010                                                                                                    7
GCPL I 4QFY2010 Result Update


                 Key Ratios
                  Y/E Mar                        FY2007   FY2008   FY2009 FY2010E FY2011E FY2012E
                  Valuation Ratio (x)
                  P/E (on FDEPS)                   68.4     57.6     53.2    27.0    23.4     21.0
                  P/CEPS                           45.3     37.9     39.9    25.3    21.8     19.5
                  P/BV                             55.1     39.2     13.5    12.1     9.5      7.7
                  Dividend yield (%)                1.3      1.4      1.3     1.4     1.7      2.0
                  EV/Sales                          9.8      8.5      6.5     4.4     3.7      3.2
                  EV/EBITDA                        51.8     43.4     44.5    22.3    18.3     15.8
                  EV / Total Assets                30.6     25.4     10.7     9.1     7.5      6.3
                  Per Share Data (Rs)
                  EPS (Basic)                       5.9      7.1      6.7    11.0    12.7     14.2
                  EPS (fully diluted)               4.4      5.2      5.6    11.0    12.7     14.2
                  Cash EPS                          6.6      7.9      7.5    11.8    13.7     15.2
                  DPS                               3.8      4.1      4.0     4.3     5.0      6.0
                  Book Value                        5.4      7.6     22.1    24.6    31.5     38.7
                  Returns (%)
                  RoCE (Pre-tax)                   72.3     58.5     30.3    41.6    42.0     40.5
                  Angel RoIC (Pre-tax)            158.4     98.9     76.3   110.6    97.9    103.7
                  RoE                             143.5    108.5     46.9    51.3    45.4     40.5
                  Turnover ratios (x)
                  Asset Turnover (Gross Block)      3.5      3.8      4.1     4.2     4.3      4.3
                  Inventory / Sales (days)         51.9     63.4     43.9    42.4    39.5     36.5
                  Receivables (days)               18.5     16.9     15.8    16.2    17.0     16.6
                  Payables (days)                  96.7     96.2     76.5    65.9    65.0     64.6


April 26, 2010                                                                                  8
GCPL I 4QFY2010 Result Update


Research Team Tel: 4040 3800                                       E-mail: research@angeltrade.com                                       Website: www.angeltrade.com


DISCLAIMER

This document is solely for the personal information of the recipient, and must not be singularly used as the basis of any investment decision. Nothing in this
document should be construed as investment or financial advice. Each recipient of this document should make such investigations as they deem necessary to
arrive at an independent evaluation of an investment in the securities of the companies referred to in this document (including the merits and risks involved),
and should consult their own advisors to determine the merits and risks of such an investment.

Angel Securities Limited, its affiliates, directors, its proprietary trading and investment businesses may, from time to time, make investment decisions that are
inconsistent with or contradictory to the recommendations expressed herein. The views contained in this document are those of the analyst, and the company
may or may not subscribe to all the views expressed within.

Reports based on technical and derivative analysis center on studying charts of a stock's price movement, outstanding positions and trading volume, as
opposed to focusing on a company's fundamentals and, as such, may not match with a report on a company's fundamentals.

The information in this document has been printed on the basis of publicly available information, internal data and other reliable source believed to be true,
and is for general guidance only. Angel Securities Limited has not independently verified all the information contained within this document. Accordingly, we
cannot testify, nor make any representation or warranty, express or implied, to the accuracy, contents or data contained within this document. While Angel
Securities Limited endeavours to update on a reasonable basis the information discussed in this material, there may be regulatory, compliance, or other
reasons that prevent us from doing so.

This document is being supplied to you solely for your information, and its contents, information or data may not be reproduced, redistributed or passed on,
directly or indirectly.

Angel Securities Limited and its affiliates may seek to provide or have engaged in providing corporate finance, investment banking or other advisory services
in a merger or specific transaction to the companies referred to in this report, as on the date of this report or in the past.

Neither Angel Securities Limited, nor its directors, employees or affiliates shall be liable for any loss or damage that may arise from or in connection with the
use of this information.
Note: Please refer to the important `Stock Holding Disclosure' report on the Angel website (Research Section).


 Disclosure of Interest Statement                                                             GCPL
 1.    Analyst ownership of the stock                                                           No
 2.    Angel and its Group companies ownership of the stock                                     No
 3.    Angel and its Group companies’ Directors ownership of the stock                          No
 4. Broking relationship with company covered                                No
 Note: We have not considered any Exposure below Rs 1 lakh for Angel and its Group companies.


                                Address: Acme Plaza, ‘A’ Wing, 3rd Floor, M.V. Road, Opp. Sangam Cinema, Andheri (E), Mumbai - 400 059.
                                                                    Tel : (022) 3952 4568 / 4040 3800


    Angel Broking Ltd: BSE Sebi Regn No : INB 010996539 / CDSL Regn No: IN - DP - CDSL - 234 - 2004 / PMS Regn Code: PM/INP000001546 Angel Securities Ltd:BSE: INB010994639/INF010994639 NSE:
    INB230994635/INF230994635 Membership numbers: BSE 028/NSE:09946
    Angel Capital & Debt Market Ltd: INB 231279838 / NSE FNO: INF 231279838 / NSE Member code -12798 Angel Commodities Broking (P) Ltd: MCX Member ID: 12685 / FMC Regn No: MCX / TCM /
    CORP / 0037 NCDEX : Member ID 00220 / FMC Regn No: NCDEX / TCM / CORP / 0302


April 26, 2010                                                                                                                                                                              9

More Related Content

What's hot

McNally Result Update 4qfy2010-180510
McNally Result Update 4qfy2010-180510McNally Result Update 4qfy2010-180510
McNally Result Update 4qfy2010-180510Angel Broking
 
Blue star ru4 qfy2010-190510
Blue star ru4 qfy2010-190510Blue star ru4 qfy2010-190510
Blue star ru4 qfy2010-190510Angel Broking
 
Graphite india ru4 qfy2010-140510
Graphite india ru4 qfy2010-140510Graphite india ru4 qfy2010-140510
Graphite india ru4 qfy2010-140510Angel Broking
 
Cadila ru4 qfy2010-300410
Cadila ru4 qfy2010-300410Cadila ru4 qfy2010-300410
Cadila ru4 qfy2010-300410Angel Broking
 
Bajaj auto ru4 qfy2010-140510
Bajaj auto ru4 qfy2010-140510Bajaj auto ru4 qfy2010-140510
Bajaj auto ru4 qfy2010-140510Angel Broking
 
Shoppers stop result update 4 qfy2010 040510
Shoppers stop result update 4 qfy2010 040510Shoppers stop result update 4 qfy2010 040510
Shoppers stop result update 4 qfy2010 040510Angel Broking
 
Bharat forge ru4 qfy2010-210510
Bharat forge ru4 qfy2010-210510Bharat forge ru4 qfy2010-210510
Bharat forge ru4 qfy2010-210510Angel Broking
 
Gail ru4 qfy2010-18-05-10
Gail ru4 qfy2010-18-05-10Gail ru4 qfy2010-18-05-10
Gail ru4 qfy2010-18-05-10Angel Broking
 
Hindalco Result Update 4 qfy2010-110510
Hindalco Result Update 4 qfy2010-110510Hindalco Result Update 4 qfy2010-110510
Hindalco Result Update 4 qfy2010-110510Angel Broking
 
HUL ru4 qfy2010-250510
HUL ru4 qfy2010-250510HUL ru4 qfy2010-250510
HUL ru4 qfy2010-250510Angel Broking
 
JISL Result Update 4 qfy2010-120510
JISL Result Update 4 qfy2010-120510JISL Result Update 4 qfy2010-120510
JISL Result Update 4 qfy2010-120510Angel Broking
 
Pantaloon Retail Result Update
Pantaloon Retail Result UpdatePantaloon Retail Result Update
Pantaloon Retail Result UpdateAngel Broking
 
Dishman ru4 qfy2010-310510
Dishman ru4 qfy2010-310510Dishman ru4 qfy2010-310510
Dishman ru4 qfy2010-310510Angel Broking
 

What's hot (20)

McNally Result Update 4qfy2010-180510
McNally Result Update 4qfy2010-180510McNally Result Update 4qfy2010-180510
McNally Result Update 4qfy2010-180510
 
Blue star ru4 qfy2010-190510
Blue star ru4 qfy2010-190510Blue star ru4 qfy2010-190510
Blue star ru4 qfy2010-190510
 
GCPL
GCPLGCPL
GCPL
 
Graphite india ru4 qfy2010-140510
Graphite india ru4 qfy2010-140510Graphite india ru4 qfy2010-140510
Graphite india ru4 qfy2010-140510
 
Hindalco
Hindalco Hindalco
Hindalco
 
Cadila ru4 qfy2010-300410
Cadila ru4 qfy2010-300410Cadila ru4 qfy2010-300410
Cadila ru4 qfy2010-300410
 
Bajaj auto ru4 qfy2010-140510
Bajaj auto ru4 qfy2010-140510Bajaj auto ru4 qfy2010-140510
Bajaj auto ru4 qfy2010-140510
 
Shoppers stop result update 4 qfy2010 040510
Shoppers stop result update 4 qfy2010 040510Shoppers stop result update 4 qfy2010 040510
Shoppers stop result update 4 qfy2010 040510
 
Bharat forge ru4 qfy2010-210510
Bharat forge ru4 qfy2010-210510Bharat forge ru4 qfy2010-210510
Bharat forge ru4 qfy2010-210510
 
Dabur
Dabur Dabur
Dabur
 
Gail ru4 qfy2010-18-05-10
Gail ru4 qfy2010-18-05-10Gail ru4 qfy2010-18-05-10
Gail ru4 qfy2010-18-05-10
 
Hindalco Result Update 4 qfy2010-110510
Hindalco Result Update 4 qfy2010-110510Hindalco Result Update 4 qfy2010-110510
Hindalco Result Update 4 qfy2010-110510
 
Dabur Result Update
Dabur Result UpdateDabur Result Update
Dabur Result Update
 
HUL ru4 qfy2010-250510
HUL ru4 qfy2010-250510HUL ru4 qfy2010-250510
HUL ru4 qfy2010-250510
 
JISL Result Update 4 qfy2010-120510
JISL Result Update 4 qfy2010-120510JISL Result Update 4 qfy2010-120510
JISL Result Update 4 qfy2010-120510
 
Prakash Indutries
Prakash Indutries Prakash Indutries
Prakash Indutries
 
Bharat Forge
Bharat ForgeBharat Forge
Bharat Forge
 
Pantaloon Retail Result Update
Pantaloon Retail Result UpdatePantaloon Retail Result Update
Pantaloon Retail Result Update
 
Marico
Marico Marico
Marico
 
Dishman ru4 qfy2010-310510
Dishman ru4 qfy2010-310510Dishman ru4 qfy2010-310510
Dishman ru4 qfy2010-310510
 

Viewers also liked

Jk tyre ru4 qfy2010-260510
Jk tyre ru4 qfy2010-260510Jk tyre ru4 qfy2010-260510
Jk tyre ru4 qfy2010-260510Angel Broking
 
Technical Report 15th July 2011
Technical Report 15th July 2011Technical Report 15th July 2011
Technical Report 15th July 2011Angel Broking
 
Market Outlook - September 20, 2010
Market Outlook - September 20, 2010Market Outlook - September 20, 2010
Market Outlook - September 20, 2010Angel Broking
 
Technical Report - September 13, 2010
Technical Report - September 13, 2010Technical Report - September 13, 2010
Technical Report - September 13, 2010Angel Broking
 
Axis%20 bank ru1qfy2012-220711
Axis%20 bank ru1qfy2012-220711Axis%20 bank ru1qfy2012-220711
Axis%20 bank ru1qfy2012-220711Angel Broking
 
Cccl ru4 qfy2010-100510
Cccl  ru4 qfy2010-100510Cccl  ru4 qfy2010-100510
Cccl ru4 qfy2010-100510Angel Broking
 
Infosys Result Updated
Infosys Result UpdatedInfosys Result Updated
Infosys Result UpdatedAngel Broking
 
Pratibha ind Result Update 4 qfy2010-110510
Pratibha ind  Result Update 4 qfy2010-110510Pratibha ind  Result Update 4 qfy2010-110510
Pratibha ind Result Update 4 qfy2010-110510Angel Broking
 
Indoco ru2 qfy2011-251010
Indoco ru2 qfy2011-251010Indoco ru2 qfy2011-251010
Indoco ru2 qfy2011-251010Angel Broking
 
JP Associates - Result Update
JP Associates - Result UpdateJP Associates - Result Update
JP Associates - Result UpdateAngel Broking
 
Market Outlook - August 31,2010
Market Outlook - August 31,2010Market Outlook - August 31,2010
Market Outlook - August 31,2010Angel Broking
 

Viewers also liked (17)

Jk tyre ru4 qfy2010-260510
Jk tyre ru4 qfy2010-260510Jk tyre ru4 qfy2010-260510
Jk tyre ru4 qfy2010-260510
 
Technical Report 15th July 2011
Technical Report 15th July 2011Technical Report 15th July 2011
Technical Report 15th July 2011
 
Page Industries
Page IndustriesPage Industries
Page Industries
 
Weekly Report
Weekly ReportWeekly Report
Weekly Report
 
Market Outlook - September 20, 2010
Market Outlook - September 20, 2010Market Outlook - September 20, 2010
Market Outlook - September 20, 2010
 
Weekly Review
Weekly ReviewWeekly Review
Weekly Review
 
Aditya Birla Nuvo
Aditya Birla Nuvo Aditya Birla Nuvo
Aditya Birla Nuvo
 
Ht media
Ht mediaHt media
Ht media
 
Wipro Result Update
Wipro Result UpdateWipro Result Update
Wipro Result Update
 
Technical Report - September 13, 2010
Technical Report - September 13, 2010Technical Report - September 13, 2010
Technical Report - September 13, 2010
 
Axis%20 bank ru1qfy2012-220711
Axis%20 bank ru1qfy2012-220711Axis%20 bank ru1qfy2012-220711
Axis%20 bank ru1qfy2012-220711
 
Cccl ru4 qfy2010-100510
Cccl  ru4 qfy2010-100510Cccl  ru4 qfy2010-100510
Cccl ru4 qfy2010-100510
 
Infosys Result Updated
Infosys Result UpdatedInfosys Result Updated
Infosys Result Updated
 
Pratibha ind Result Update 4 qfy2010-110510
Pratibha ind  Result Update 4 qfy2010-110510Pratibha ind  Result Update 4 qfy2010-110510
Pratibha ind Result Update 4 qfy2010-110510
 
Indoco ru2 qfy2011-251010
Indoco ru2 qfy2011-251010Indoco ru2 qfy2011-251010
Indoco ru2 qfy2011-251010
 
JP Associates - Result Update
JP Associates - Result UpdateJP Associates - Result Update
JP Associates - Result Update
 
Market Outlook - August 31,2010
Market Outlook - August 31,2010Market Outlook - August 31,2010
Market Outlook - August 31,2010
 

Similar to Gcpl Result Update

Similar to Gcpl Result Update (18)

Nestle 1QCY2010 Result Update
Nestle 1QCY2010 Result UpdateNestle 1QCY2010 Result Update
Nestle 1QCY2010 Result Update
 
Cipla
Cipla Cipla
Cipla
 
GKS Consumer Result Update
GKS Consumer Result UpdateGKS Consumer Result Update
GKS Consumer Result Update
 
GSK con ru1 qcy2010-230410
GSK con ru1 qcy2010-230410GSK con ru1 qcy2010-230410
GSK con ru1 qcy2010-230410
 
Asian paints ru4 qfy2010-280510
Asian paints ru4 qfy2010-280510Asian paints ru4 qfy2010-280510
Asian paints ru4 qfy2010-280510
 
Itc ru4 qfy2010-22-05-10
Itc ru4 qfy2010-22-05-10Itc ru4 qfy2010-22-05-10
Itc ru4 qfy2010-22-05-10
 
TVS Motor
TVS MotorTVS Motor
TVS Motor
 
Grasim Result Update 4qfy2010 - 210510
Grasim Result Update 4qfy2010 - 210510Grasim Result Update 4qfy2010 - 210510
Grasim Result Update 4qfy2010 - 210510
 
Grasim ru4 qfy2010-210510
Grasim ru4 qfy2010-210510Grasim ru4 qfy2010-210510
Grasim ru4 qfy2010-210510
 
Exide Industries
Exide IndustriesExide Industries
Exide Industries
 
GCPL event update - 120510
GCPL event update - 120510GCPL event update - 120510
GCPL event update - 120510
 
Greenply industries ru4 qfy2010-310510
Greenply industries ru4 qfy2010-310510Greenply industries ru4 qfy2010-310510
Greenply industries ru4 qfy2010-310510
 
IGL
IGLIGL
IGL
 
Jagran Prakashan
Jagran PrakashanJagran Prakashan
Jagran Prakashan
 
Exide
Exide Exide
Exide
 
GSPL
GSPLGSPL
GSPL
 
GSPL
GSPLGSPL
GSPL
 
GSPL
GSPLGSPL
GSPL
 

More from Angel Broking

Market outlook 110612
Market outlook 110612Market outlook 110612
Market outlook 110612Angel Broking
 
Electrosteel castings
Electrosteel castingsElectrosteel castings
Electrosteel castingsAngel Broking
 
Derivative report 19th July 2011
Derivative report 19th July 2011Derivative report 19th July 2011
Derivative report 19th July 2011Angel Broking
 
Market outlook 19th July 2011
Market outlook 19th July 2011Market outlook 19th July 2011
Market outlook 19th July 2011Angel Broking
 
Weekly Report 18th July 2011
Weekly Report 18th July 2011Weekly Report 18th July 2011
Weekly Report 18th July 2011Angel Broking
 
Derivative Report 18th July 2011
Derivative Report 18th July 2011Derivative Report 18th July 2011
Derivative Report 18th July 2011Angel Broking
 
Technical Report 18th July 2011
Technical Report 18th July 2011Technical Report 18th July 2011
Technical Report 18th July 2011Angel Broking
 
Market Outlook 18th July 2011
Market Outlook 18th July 2011Market Outlook 18th July 2011
Market Outlook 18th July 2011Angel Broking
 
Bajaj auto Result Updated
Bajaj auto Result UpdatedBajaj auto Result Updated
Bajaj auto Result UpdatedAngel Broking
 
Tata consultancy services
Tata consultancy services Tata consultancy services
Tata consultancy services Angel Broking
 
Derivatives Report 15th July 2011
Derivatives Report 15th July 2011Derivatives Report 15th July 2011
Derivatives Report 15th July 2011Angel Broking
 
Derivative Report 13th July 2011
Derivative Report 13th July 2011Derivative Report 13th July 2011
Derivative Report 13th July 2011Angel Broking
 
Technical Report 13th July 2011
Technical Report 13th July 2011Technical Report 13th July 2011
Technical Report 13th July 2011Angel Broking
 
Market Outlook 13th July 2011
Market Outlook 13th July 2011Market Outlook 13th July 2011
Market Outlook 13th July 2011Angel Broking
 

More from Angel Broking (20)

Market outlook 110612
Market outlook 110612Market outlook 110612
Market outlook 110612
 
Electrosteel castings
Electrosteel castingsElectrosteel castings
Electrosteel castings
 
Persistent systems
Persistent systemsPersistent systems
Persistent systems
 
Derivative report 19th July 2011
Derivative report 19th July 2011Derivative report 19th July 2011
Derivative report 19th July 2011
 
Market outlook 19th July 2011
Market outlook 19th July 2011Market outlook 19th July 2011
Market outlook 19th July 2011
 
Telecom sector
Telecom sectorTelecom sector
Telecom sector
 
Weekly Report 18th July 2011
Weekly Report 18th July 2011Weekly Report 18th July 2011
Weekly Report 18th July 2011
 
Derivative Report 18th July 2011
Derivative Report 18th July 2011Derivative Report 18th July 2011
Derivative Report 18th July 2011
 
Technical Report 18th July 2011
Technical Report 18th July 2011Technical Report 18th July 2011
Technical Report 18th July 2011
 
Market Outlook 18th July 2011
Market Outlook 18th July 2011Market Outlook 18th July 2011
Market Outlook 18th July 2011
 
South Indian Bank
 South Indian Bank South Indian Bank
South Indian Bank
 
Bajaj auto Result Updated
Bajaj auto Result UpdatedBajaj auto Result Updated
Bajaj auto Result Updated
 
Tata consultancy services
Tata consultancy services Tata consultancy services
Tata consultancy services
 
Fc4 e63c4d01
Fc4 e63c4d01Fc4 e63c4d01
Fc4 e63c4d01
 
Derivatives Report 15th July 2011
Derivatives Report 15th July 2011Derivatives Report 15th July 2011
Derivatives Report 15th July 2011
 
Derivative Report 13th July 2011
Derivative Report 13th July 2011Derivative Report 13th July 2011
Derivative Report 13th July 2011
 
Technical Report 13th July 2011
Technical Report 13th July 2011Technical Report 13th July 2011
Technical Report 13th July 2011
 
Market Outlook 13th July 2011
Market Outlook 13th July 2011Market Outlook 13th July 2011
Market Outlook 13th July 2011
 
E72 f1fc5d01
E72 f1fc5d01E72 f1fc5d01
E72 f1fc5d01
 
E72 f1fc5d01
E72 f1fc5d01E72 f1fc5d01
E72 f1fc5d01
 

Gcpl Result Update

  • 1. 4QFY2010 Result Update I FMCG April 26, 2010 Godrej Consumer Products ACCUMULATE CMP Rs298 Performance Highlights Target Price Rs329 Godrej Consumer (GCPL) posted a Top-line growth of 48.1% yoy, in-line with Investment Period 12 Months our Estimates. However, the Earnings growth at 54.6% yoy was ahead of our expectations. Adjusted for Godrej Sara Lee’s (GSL) contribution, the Top-line Stock Info and Earnings growth stood at 5.3% yoy and 16% yoy, respectively. After the Sector FMCG 4QFY2010 results, we have marginally tweaked our numbers to factor in the slowdown in the core domestic business (Soaps and Hair Colours). Market Cap (Rs cr) 9,175 We maintain an Accumulate on the stock. Beta 0.2 Earnings beat estimates, Domestic growth at 1.9% disappointing: Godrej 52 WK High / Low 334/130 Consumer (GCPL) reported a strong Top-line growth at 48.1% yoy to Rs509cr. Godrej-Sara Lee (GSL) contributed Rs147cr to the Top-line, adjusted for which Avg. Daily Volume 73,918 GCPL posted a disappointing growth of 5.3% yoy to Rs362cr. Moreover, Face Value (Rs) 1 international operations (particularly Africa) registered strong growth during the quarter (we estimate it at ~19% yoy), which indicates that domestic BSE Sensex 17,745 operations (without GSL) grew just 1.9% yoy. We estimate that Soaps declined Nifty 5,322 ~3% yoy and Hair Colours grew in low single digits. We attribute the same to base effect and negative value growth. GCPL’s consolidated Earnings for the Reuters Code GOCP.BO quarter registered a growth of 54.6% yoy to Rs92cr, aided by the increase in Bloomberg Code GCPL @IN the Top-line and Margin expansion. On the operating front, GCPL delivered a Margin expansion of 154bp yoy to 21.1%, driving a 59.7% yoy growth in Shareholding Pattern (%) EBITDA to Rs108cr, partially aided by a low base and GSL’s consolidation. A 614bp yoy jump in Gross Margins (owing to a low base effect) aided Margin Promoters 71.8 expansion. MF/Banks/Indian FIs 2.9 Outlook and Valuation: Going ahead, we expect the growth momentum to FII/NRIs/OCBs 18.5 decelerate and expect GCPL to post a 15% CAGR in the Top-line and a 14% CAGR in Earnings during FY2010-12E, as the benefits of price hikes fade out, Indian Public 6.8 GSL’s consolidation effect forms a base and Gross Margin expansion peaks Abs. (%) 3m 1yr 3yr out. At the CMP of Rs297, GCPL is trading at 21x FY2012E EPS of Rs14.2. With GCPL's wider portfolio, stronger performance of its International Sensex 5.7 56.6 24.7 business, the likely acquisition of the remaining 51% stake in GSL from Sara Lee and a potential upside trigger from further acquisitions (likely in Latin GCPL 20.4 125.2 116.8 America), we believe that the stock still offers significant triggers for sustained performance. Hence, we maintain an Accumulate on the stock, with a Target Price of Rs329, valuing GCPL at 23x FY2012E EPS. Key Financials (Consolidated) Y/E Mar (Rs cr) FY2009 FY2010E FY2011E FY2012E Net Sales 1,393 2,041 2,412 2,720 % chg 26.3 46.5 18.2 12.7 Net Profit (Adj) 172.6 339.6 392.4 437.8 % chg 8.4 96.7 15.5 11.6 OPM (%) 14.6 20.0 20.2 20.3 EPS (Rs) 5.6 11.0 12.7 14.2 P/E (x) 53.2 27.0 23.4 21.0 Anand Shah P/BV (x) 13.5 12.1 9.5 7.7 Tel: 022 – 4040 3800 Ext: 334 E-mail: anand.shah@angeltrade.com RoE (%) 46.9 51.3 45.4 40.5 RoCE (%) 30.3 41.6 42.0 40.5 Chitrangda Kapur EV/Sales (x) 6.5 4.4 3.7 3.2 Tel: 022 – 4040 3800 Ext: 323 EV/EBITDA (x) 44.5 22.3 18.3 15.8 E-mail: chitrangda.kapur@angeltrade.com Source: Company, Angel Research; Note: Not factored Tura/Megasari Numbers 1 Please refer to important disclosures at the end of this report Sebi Registration No: INB 010996539
  • 2. GCPL I 4QFY2010 Result Update Exhibit 1: Quarterly Performance Update (Consolidated) Y/E March (Rs cr) 4QFY10 4QFY09 % chg FY2010 FY2009 % chg Net Sales 509.2 343.9 48.1 2,041.2 1,393.0 46.5 Consumption of RM 226.8 174.3 30.1 946.3 769.5 23.0 (% of Sales) 44.5 50.7 46.4 55.2 Staff Cost 32.7 24.2 34.9 187.7 87.6 114.4 (% of Sales) 6.4 7.0 9.2 6.3 Advertising 34.5 15.3 125.2 172.1 99.7 72.5 (% of Sales) 6.8 4.5 8.4 7.2 Other Expenses 107.7 62.8 71.6 327.8 232.4 41.0 (% of Sales) 21.2 18.3 16.1 16.7 Total Expenditure 401.7 276.6 45.2 1,633.9 1,189.3 37.4 Operating Profit 107.5 67.3 59.7 407.3 203.7 99.9 OPM (%) 21.1 19.6 20.0 14.6 Interest 2.7 4.8 11.1 20.1 Depreciation/Amortisation 6.1 4.0 50.0 23.6 19.2 22.7 Other Income 12.2 10.3 18.4 47.3 44.8 5.6 PBT (excl Ext. Items) 111.0 68.8 61.3 419.9 209.2 100.7 Ext Income/(Expenses) 0.0 0.0 0.0 0.0 PBT (incl Ext. Items) 111.0 68.8 61.3 419.9 209.2 100.7 (% of Sales) 21.8 20.0 20.6 15.0 Prov. for Taxation 19.2 9.4 103.8 80.3 36.0 123.4 (% of PBT) 17.3 13.7 19.1 17.2 Recurring PAT 91.8 59.4 54.6 339.6 173.3 96.0 PATM (%) 18.0 17.3 16.6 12.4 Reported PAT 91.8 59.4 54.6 339.6 173.3 96.0 Equity Shares (cr) 30.8 25.7 30.8 25.7 EPS (Rs) 3.0 2.3 28.9 11.0 6.7 63.4 Source: Company, Angel Research Godrej Sara Lee drives Top-line growth; adjusted growth at 5.3% yoy disappointing Godrej Consumer (GCPL) reported strong Top-line growth at 48.1% yoy to Rs509cr (Rs344cr), in-line with our expectations of a 51% yoy growth to Rs519cr. Godrej-Sara Lee (GSL) contributed Rs147cr to the Top-line for the quarter. However, adjusted for GSL’s revenue, GCPL posted a growth of 5.3% yoy to Rs362cr which was below our expectation. Moreover, international operations (particularly Africa) registered strong growth during the quarter (we estimate it at ~19% yoy) which indicates that domestic operations (without GSL) grew just 1.9% yoy. While our talks with the management indicate pressure on volumes but no significant decline in Soaps or Hair Colour, the muted growth in domestic business (we had modeled in moderation) has come as a negative surprise to us. We attribute the same to base effect and negative value growth. Margin expansion boosts Earnings, which grow 54.6% yoy GCPL’s consolidated Earnings for the quarter registered a growth of 54.6% yoy to Rs92cr (Rs59cr), ahead of our estimates of a 37% yoy growth to Rs81cr. In terms of Earnings, GSL’s consolidation contributed Rs23cr during the quarter, adjusted for which the growth in Bottom-line stood at 16% yoy to Rs69cr. The robust growth in the Top-line and Margin expansion boosted Earnings. However, in terms of EPS (adjusted for dilution of share swap to acquire GSL), GCPL registered a growth of 28.9% yoy to Rs3 (Rs2.3). April 26, 2010 2
  • 3. GCPL I 4QFY2010 Result Update OPM expands 154bp, aided by 614bp Gross Margin expansion At the operating front, GCPL delivered a Margin expansion of 154bp yoy to 21.1% (19.6%), driving a 59.7% yoy growth in EBITDA to Rs108cr (Rs67cr), partially aided by a low base and GSL’s consolidation. A 614bp yoy jump in Gross Margins (owing to a low base effect) and a decrease of 62bp yoy in Staff costs were the key drivers behind the Margin expansion. However, higher Other expenditure (up 290bp yoy) and a jump in Advertising spends (up 232bp yoy) kept Margins under check. Going ahead, we expect input costs for GCPL to rise, as palm oil prices have hardened during the quarter and as the benefits of inventory/price covers fade away. We have modeled in a 200bp contraction in Gross Margins during FY2010-12E. Soaps Revenue declines ~3%; Hair Colour growth moderates to low single digits GCPL’s Soaps business registered a decline of ~3%, largely owing to a high base effect (4QFY2009 saw soaps clocking a 46% yoy growth) and negative value growth. Our talks with the management indicate pressure on volume growth, but no significant decline. Near-term growth in Soaps is likely to be driven by an increasing focus on smaller packs (to drive rural penetration) and the successful launch of new variants. The company continued to be the second-largest toilet soaps player in India, increasing its market share to 10.5% from 9.4% in March 2009 (increased sequentially, as well, by 20bp). Godrej No1 was re-launched in April 2010, with a new shape, packaging and natural oils, and Cinthol Regular was launched in small packs, priced at Rs6. Going ahead, we expect GCPL to witness increased competitive pressures, owing to higher investments, and aggression from HUL and ITC. Moreover, higher food inflation and the fading effect of price hikes, coupled with higher competitive intensity, are likely to lead to a moderation in the revenue of this segment. GCPL’s Hair Colour business witnessed a moderation in growth to mid single digits, owing to negative value growth and pressure on the volume front. GCPL maintained its marketshare in the category on a sequential basis at 33.3%. International Business on a strong footing; Keyline witnesses a slow-down The performance of the International business registered yet another quarter of steady gains, registering an overall growth of ~19% yoy, largely aided by significant revenue traction in the Rapidol and Kinky businesses. For the full year FY2010, Keyline Brands (UK), registered a muted growth of 9% yoy. However, African operations, namely Rapidol (South Africa) and Kinky, posted a robust growth of 42% yoy and 41% yoy, respectively, in INR terms. However, the Profitability of the international operations came under pressure during the quarter (due to currency volatility), and registered a decline of 18% to Rs2.5cr (Rs3.1cr). Exhibit 2: Key Subsidiaries Performance (Consolidated) Y/E Mar (Rs cr) 4QFY10 4QFY09 % chg FY2010 FY2009 % chg Sales (Rs cr) Keyline Brands 45.5 43.5 4 218.6 200.6 9 Rapidol 17.6 11.0 60 69.4 48.8 42 Kinky Group 13.9 10.7 30 72.3 51.4 41 GGME 4.5 3.0 50 17.7 12.2 45 Total Sales - Subsidiaries 81.4 68.2 19 378.0 313.1 21 Source: Company, Angel Research April 26, 2010 3
  • 4. GCPL I 4QFY2010 Result Update Outlook and Valuation After the 4QFY2010 results, we have marginally tweaked our numbers to factor in a slowdown in the core domestic business (Soaps and Hair Colours). However, owing to the strong growth in the insecticides business (Godrej Sara Lee) and the steady performance of the International business (particularly Africa), our Top-line estimate is largely unchanged. We have revised our Operating Margin marginally upwards to factor in a higher Gross Margin (despite modeling almost a 200bp contraction over FY2010-12E). However, inability to take price hikes (due to competitive pressures), the impact of currency volatility on international operations and higher-than- anticipated advertising spends carry downside risks to our estimates. Exhibit 3: Revision in Estimates Old Estimate New Estimate % chg (Rs cr) FY11E FY12E FY11E FY12E FY11E FY12E Revenue 2,420 2,742 2,412 2,720 (0.3) (0.8) OPM (%) 19.9 20.2 20.2 20.3 25bp 5bp EPS 12.6 14.3 12.7 14.2 1.0 (0.7) Source: Angel Research FY2010E has been a year of strong growth for GCPL, driven by significant Gross Margin expansion, improved traction in the international business and consolidation of GSL’s business. However, going ahead, we expect the growth momentum to decelerate, and expect GCPL to post a 15% CAGR in the Top-line and a 14% CAGR in Earnings during FY2010-12E, as the benefits of price hikes fade out, GSL’s consolidation effect forms a base and the Gross Margin expansion peaks out. At the CMP of Rs297, GCPL is trading at 21x FY2012E EPS of Rs14.2. While we have not factored the Tura and Megasari deals into our numbers, owing to a lack of details, particularly in terms of deal size, our preliminary analysis indicates that both the deals are likely to be EPS accretive. Moreover, with GCPL's wider portfolio, a stronger performance of its International business, the likely acquisition of the remaining 51% stake in GSL from Sara Lee and a potential upside trigger from further acquisitions (likely in Latin America), we believe that the stock still offers significant triggers for sustained performance. Hence, we maintain an Accumulate on the stock, with a Target Price of Rs329, valuing GCPL at 23x FY2012E EPS. Exhibit 4: 1-year forward P/E band 350 14x 18x 22x 26x 300 250 Share Price (Rs) 200 150 100 50 - Dec-05 Dec-06 Dec-07 Dec-08 Dec-09 Apr-05 Apr-06 Apr-07 Apr-08 Apr-09 Apr-10 Oct-05 Oct-06 Oct-07 Oct-08 Oct-09 Aug-05 Feb-06 Aug-06 Feb-07 Aug-07 Feb-08 Aug-08 Feb-09 Aug-09 Feb-10 Jun-05 Jun-06 Jun-07 Jun-08 Jun-09 Source: Bloomberg, Angel Research April 26, 2010 4
  • 5. GCPL I 4QFY2010 Result Update Exhibit 5: 1-year forward P/E Chart 35.0 30.0 25.0 20.0 15.0 10.0 5.0 - Apr-02 Dec-02 Apr-03 Dec-03 Apr-04 Dec-04 Apr-05 Dec-05 Apr-06 Dec-06 Apr-07 Dec-07 Apr-08 Dec-08 Apr-09 Dec-09 Apr-10 Aug-02 Aug-03 Aug-04 Aug-05 Aug-06 Aug-07 Aug-08 Aug-09 Source: Bloomberg, Angel Research; Note: Red-line indicates 5-year average Exhibit 6: 1-year forward Premium to Sensex Chart 100% 80% 60% 40% 20% 0% -20% -40% -60% Dec-02 Dec-03 Dec-04 Dec-05 Dec-06 Dec-07 Dec-08 Dec-09 Apr-02 Apr-03 Apr-04 Apr-05 Apr-06 Apr-07 Apr-08 Apr-09 Apr-10 Aug-02 Aug-03 Aug-04 Aug-05 Aug-06 Aug-07 Aug-08 Aug-09 Source: Bloomberg, Angel Research; Note: Red-line indicates 5-year average April 26, 2010 5
  • 6. GCPL I 4QFY2010 Result Update Profit & Loss Statement (Consolidated) Rs crore Y/E Mar FY2007 FY2008 FY2009 FY2010E FY2011E FY2012E Gross sales 990 1,133 1,435 2,082 2,456 2,768 Less: Excise duty 38 30 42 41 43 49 Net Sales 952 1,103 1,393 2,041 2,412 2,720 Other operating income - 1 4 4 8 9 Total operating income 952 1,104 1,397 2,045 2,420 2,729 % chg 36.0 16.0 26.5 46.4 18.3 12.8 Total Expenditure 772 888 1,189 1,634 1,926 2,169 Cost of Materials 462 518 770 946 1,148 1,314 Advertising Exp 77 92 97 172 200 223 Personnel 54 73 87 188 220 245 Others 178 206 237 328 358 388 EBITDA 180 214 204 407 486 551 % chg 27.2 19.4 (5.0) 100.0 19.3 13.3 (% of Net Sales) 18.9 19.5 14.6 20.0 20.2 20.3 Depreciation& Amortisation 14 18 19 24 28 32 EBIT 165 196 184 384 458 519 % chg 27.5 18.6 (6.0) 108.0 19.3 13.4 (% of Net Sales) 17.4 17.8 13.2 18.8 19.0 19.1 Interest & other Charges 10 15 19 11 10 9 Other Income 3 5 40 43 39 37 (% of PBT) 1.7 2.4 19.1 10.3 7.9 6.7 Share in profit of Associates - - - - - - Recurring PBT 159 187 209 420 494 556 % chg 20.0 18.3 11.6 100.7 17.5 12.6 Extraordinary Expense/(Inc.) (10) - (1) - - - PBT (reported) 168 187 210 420 494 556 Tax 24 28 37 80 101 118 (% of PBT) 15.4 15.1 17.5 19.1 20.5 21.3 PAT (reported) 144 159 173 340 392 438 Add: Share of associates - - - - - - Less: Minority interest (MI) - - - - - - PAT after MI (reported) 144 159 173 340 392 438 ADJ. PAT 134 159 173 340 392 438 % chg 11.1 18.7 8.4 96.7 15.5 11.6 (% of Net Sales) 14.1 14.4 12.4 16.6 16.3 16.1 Basic EPS (Rs) 5.9 7.1 6.7 11.0 12.7 14.2 Fully Diluted EPS (Rs) 4.4 5.2 5.6 11.0 12.7 14.2 % chg 11.1 18.7 8.4 96.7 15.5 11.6 April 26, 2010 6
  • 7. GCPL I 4QFY2010 Result Update Balance Sheet (Consolidated) Rs crore Y/E Mar FY2007 FY2008 FY2009 FY2010E FY2011E FY2012E SOURCES OF FUNDS Equity Share Capital 23 23 26 31 31 31 Preference Capital - - - - - - Reserves& Surplus 99 149 541 727 940 1,161 Shareholders Funds 122 172 567 758 970 1,192 Minority Interest - - - - - - Total Loans 174 187 278 233 208 183 Deferred Tax Liability 8 9 4 4 4 4 Total Liabilities 304 368 849 995 1,182 1,379 APPLICATION OF FUNDS Gross Block 270 294 337 486 568 632 Less: Acc. Depreciation 111 125 110 133 162 193 Net Block 159 168 227 353 406 439 Capital Work-in-Progress 40 72 2 15 23 25 Goodwill 89 96 209 209 209 209 Investments 0 0 8 8 8 8 Current Assets 278 352 733 820 1,013 1,229 Cash 47 43 378 339 471 657 Loans & Advances 46 67 127 153 169 177 Other 184 243 228 328 373 396 Current liabilities 262 323 330 409 475 531 Net Current Assets 16 29 403 412 538 698 Mis. Exp. not written off - 3 - - - - Total Assets 304 368 849 995 1,182 1,379 Cash Flow Statement (Consolidated) Rs crore Y/E Mar FY2007 FY2008 FY2009 FY2010E FY2011E FY2012E Profit before tax 159 187 209 420 494 556 Depreciation 14 18 19 24 28 32 Change in Working Capital (12) (22) (45) (47) 5 24 Interest / Dividend (Net) 10 13 (17) (25) (20) (18) Direct taxes paid 24 28 37 80 101 118 Others 5 (2) (5) (1) 1 1 Cash Flow from Operations 151 165 125 290 407 477 Inc./ (Dec.) in Fixed Assets (129) (63) (156) (161) (90) (67) Inc./ (Dec.) in Investments 1 - (8) - - - Cash Flow from Investing (128) (63) (164) (161) (90) (67) Issue of Equity - - 396 5 - - Inc./(Dec.) in loans 105 13 90 (45) (25) (25) Dividend Paid (Incl. Tax) 97 109 120 153 180 216 Interest / Dividend (Net) 10 13 (8) (25) (20) (18) Cash Flow from Financing (2) (108) 375 (168) (186) (223) Inc./(Dec.) in Cash 21 (5) 336 (39) 132 186 Opening Cash balances 26 47 43 378 339 471 Closing Cash balances 47 43 378 339 471 657 April 26, 2010 7
  • 8. GCPL I 4QFY2010 Result Update Key Ratios Y/E Mar FY2007 FY2008 FY2009 FY2010E FY2011E FY2012E Valuation Ratio (x) P/E (on FDEPS) 68.4 57.6 53.2 27.0 23.4 21.0 P/CEPS 45.3 37.9 39.9 25.3 21.8 19.5 P/BV 55.1 39.2 13.5 12.1 9.5 7.7 Dividend yield (%) 1.3 1.4 1.3 1.4 1.7 2.0 EV/Sales 9.8 8.5 6.5 4.4 3.7 3.2 EV/EBITDA 51.8 43.4 44.5 22.3 18.3 15.8 EV / Total Assets 30.6 25.4 10.7 9.1 7.5 6.3 Per Share Data (Rs) EPS (Basic) 5.9 7.1 6.7 11.0 12.7 14.2 EPS (fully diluted) 4.4 5.2 5.6 11.0 12.7 14.2 Cash EPS 6.6 7.9 7.5 11.8 13.7 15.2 DPS 3.8 4.1 4.0 4.3 5.0 6.0 Book Value 5.4 7.6 22.1 24.6 31.5 38.7 Returns (%) RoCE (Pre-tax) 72.3 58.5 30.3 41.6 42.0 40.5 Angel RoIC (Pre-tax) 158.4 98.9 76.3 110.6 97.9 103.7 RoE 143.5 108.5 46.9 51.3 45.4 40.5 Turnover ratios (x) Asset Turnover (Gross Block) 3.5 3.8 4.1 4.2 4.3 4.3 Inventory / Sales (days) 51.9 63.4 43.9 42.4 39.5 36.5 Receivables (days) 18.5 16.9 15.8 16.2 17.0 16.6 Payables (days) 96.7 96.2 76.5 65.9 65.0 64.6 April 26, 2010 8
  • 9. GCPL I 4QFY2010 Result Update Research Team Tel: 4040 3800 E-mail: research@angeltrade.com Website: www.angeltrade.com DISCLAIMER This document is solely for the personal information of the recipient, and must not be singularly used as the basis of any investment decision. Nothing in this document should be construed as investment or financial advice. Each recipient of this document should make such investigations as they deem necessary to arrive at an independent evaluation of an investment in the securities of the companies referred to in this document (including the merits and risks involved), and should consult their own advisors to determine the merits and risks of such an investment. Angel Securities Limited, its affiliates, directors, its proprietary trading and investment businesses may, from time to time, make investment decisions that are inconsistent with or contradictory to the recommendations expressed herein. The views contained in this document are those of the analyst, and the company may or may not subscribe to all the views expressed within. Reports based on technical and derivative analysis center on studying charts of a stock's price movement, outstanding positions and trading volume, as opposed to focusing on a company's fundamentals and, as such, may not match with a report on a company's fundamentals. The information in this document has been printed on the basis of publicly available information, internal data and other reliable source believed to be true, and is for general guidance only. Angel Securities Limited has not independently verified all the information contained within this document. Accordingly, we cannot testify, nor make any representation or warranty, express or implied, to the accuracy, contents or data contained within this document. While Angel Securities Limited endeavours to update on a reasonable basis the information discussed in this material, there may be regulatory, compliance, or other reasons that prevent us from doing so. This document is being supplied to you solely for your information, and its contents, information or data may not be reproduced, redistributed or passed on, directly or indirectly. Angel Securities Limited and its affiliates may seek to provide or have engaged in providing corporate finance, investment banking or other advisory services in a merger or specific transaction to the companies referred to in this report, as on the date of this report or in the past. Neither Angel Securities Limited, nor its directors, employees or affiliates shall be liable for any loss or damage that may arise from or in connection with the use of this information. Note: Please refer to the important `Stock Holding Disclosure' report on the Angel website (Research Section). Disclosure of Interest Statement GCPL 1. Analyst ownership of the stock No 2. Angel and its Group companies ownership of the stock No 3. Angel and its Group companies’ Directors ownership of the stock No 4. Broking relationship with company covered No Note: We have not considered any Exposure below Rs 1 lakh for Angel and its Group companies. Address: Acme Plaza, ‘A’ Wing, 3rd Floor, M.V. Road, Opp. Sangam Cinema, Andheri (E), Mumbai - 400 059. Tel : (022) 3952 4568 / 4040 3800 Angel Broking Ltd: BSE Sebi Regn No : INB 010996539 / CDSL Regn No: IN - DP - CDSL - 234 - 2004 / PMS Regn Code: PM/INP000001546 Angel Securities Ltd:BSE: INB010994639/INF010994639 NSE: INB230994635/INF230994635 Membership numbers: BSE 028/NSE:09946 Angel Capital & Debt Market Ltd: INB 231279838 / NSE FNO: INF 231279838 / NSE Member code -12798 Angel Commodities Broking (P) Ltd: MCX Member ID: 12685 / FMC Regn No: MCX / TCM / CORP / 0037 NCDEX : Member ID 00220 / FMC Regn No: NCDEX / TCM / CORP / 0302 April 26, 2010 9