1. 4QFY2010 Result Update I Capital Goods
May 14, 2010
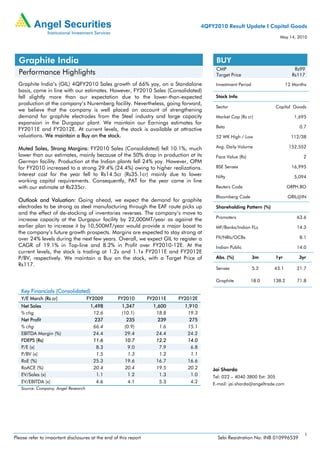
Graphite India BUY
CMP Rs99
Performance Highlights Target Price Rs117
Graphite India’s (GIL) 4QFY2010 Sales growth of 66% yoy, on a Standalone Investment Period 12 Months
basis, came in line with our estimates. However, FY2010 Sales (Consolidated)
fell slightly more than our expectation due to the lower-than-expected Stock Info
production at the company’s Nuremberg facility. Nevertheless, going forward,
Sector Capital Goods
we believe that the company is well placed on account of strengthening
demand for graphite electrodes from the Steel industry and large capacity Market Cap (Rs cr) 1,695
expansion in the Durgapur plant. We maintain our Earnings estimates for
Beta 0.7
FY2011E and FY2012E. At current levels, the stock is available at attractive
valuations. We maintain a Buy on the stock. 52 WK High / Low 112/38
Muted Sales, Strong Margins: FY2010 Sales (Consolidated) fell 10.1%, much Avg. Daily Volume 152,552
lower than our estimates, mainly because of the 50% drop in production at its Face Value (Rs) 2
German facility. Production at the Indian plants fell 24% yoy. However, OPM
for FY2010 increased to a strong 29.4% (24.4%) owing to higher realizations. BSE Sensex 16,995
Interest cost for the year fell to Rs14.5cr (Rs35.1cr) mainly due to lower Nifty 5,094
working capital requirements. Consequently, PAT for the year came in line
with our estimate at Rs235cr. Reuters Code GRPH.BO
Bloomberg Code GRIL@IN
Outlook and Valuation: Going ahead, we expect the demand for graphite
electrodes to be strong as steel manufacturing through the EAF route picks up Shareholding Pattern (%)
and the effect of de-stocking of inventories reverses. The company’s move to
increase capacity at the Durgapur facility by 22,000MT/year as against the Promoters 63.6
earlier plan to increase it by 10,500MT/year would provide a major boost to MF/Banks/Indian FLs 14.3
the company’s future growth prospects. Margins are expected to stay strong at
over 24% levels during the next few years. Overall, we expect GIL to register a FII/NRIs/OCBs 8.1
CAGR of 19.1% in Top-line and 8.2% in Profit over FY2010-12E. At the Indian Public 14.0
current levels, the stock is trading at 1.2x and 1.1x FY2011E and FY2012E
P/BV, respectively. We maintain a Buy on the stock, with a Target Price of Abs. (%) 3m 1yr 3yr
Rs117.
Sensex 5.2 43.1 21.7
Graphite 18.0 138.2 71.8
Key Financials (Consolidated)
Y/E March (Rs cr) FY2009 FY2010 FY2011E FY2012E
Net Sales 1,498 1,347 1,600 1,910
% chg 12.6 (10.1) 18.8 19.3
Net Profit 237 235 239 275
% chg 66.4 (0.9) 1.6 15.1
EBITDA Margin (%) 24.4 29.4 24.4 24.2
FDEPS (Rs) 11.6 10.7 12.2 14.0
P/E (x) 8.3 9.0 7.9 6.8
P/BV (x) 1.5 1.3 1.2 1.1
RoE (%) 25.3 19.6 16.7 16.6
RoACE (%) 20.4 20.4 19.5 20.2 Jai Sharda
EV/Sales (x) 1.1 1.2 1.3 1.0 Tel: 022 – 4040 3800 Ext: 305
EV/EBITDA (x) 4.6 4.1 5.3 4.2 E-mail: jai.sharda@angeltrade.com
Source: Company, Angel Research
1
Please refer to important disclosures at the end of this report Sebi Registration No: INB 010996539
2. Rallis I 4QFY2010 Result Update
Exhibit 1: 4QFY2010 Performance (Standalone)
Y/E March (Rs cr) 4Q FY10 3Q FY10 % chg 4Q FY09 % chg FY10 FY09 % chg
(qoq) (yoy)
Net Sales 338.6 278.9 21.4 203.3 66.5 1,131.2 1,125.9 0.5
Consumption of RM 141.3 97.2 45.4 67.9 108.2 417.2 380.7 9.6
(% of Sales) 41.7 34.8 33.4 36.9 33.8
Staff Costs 19.8 18.7 5.7 17.2 15.0 74.3 75.0 (0.9)
(% of Sales) 5.8 6.7 8.4 6.6 6.7
Other Expenses 79.3 60.4 31.4 85.2 (6.9) 261.0 438.1 (40.4)
(% of Sales) 23.4 21.6 41.9 23.1 38.9
Total Expenditure 240.4 176.2 36.4 170.3 41.2 752.5 893.8 (15.8)
Operating Profit 98.2 102.7 (4.4) 33.1 - 378.7 232.1 63.1
OPM 29.0 36.8 16.3 33.5 20.6
Interest 1.8 1.7 7.0 7.8 (76.5) 10.5 25.9 (59.6)
Depreciation 10.3 9.8 5.2 9.3 9.9 39.5 34.4 15.1
Other Income 2.2 5.9 (62.5) 14.9 (85.2) 30.6 28.9 5.8
PBT (excl. Extr. Items) 88.3 97.2 (9.1) 30.8 186.2 359.3 200.8 79.0
Extr. Income/(Expense) - - - - -
PBT (incl. Extr. Items) 88.3 97.2 (9.1) 30.8 - 359.3 200.8 79.0
(% of Sales) 26.1 34.8 15.2 31.8 17.8
Provision for Taxation 32.7 34.2 (4.4) (51.7) - 127.1 7.2 1,670.1
(% of PBT) 37.0 35.2 - 35.4 3.6
Reported PAT 55.6 63.0 (11.7) 82.6 - 232.2 193.6 19.9
PATM 16.4 22.6 40.6 20.5 17.2
Equity shares (cr) 17.2 17.1 15.1 17.2 15.1
EPS (Rs) 3.2 3.7 (12.0) 5.5 - 13.6 12.6 8.2
Adjusted PAT 55.6 63.0 (11.7) 82.6 - 232.2 193.6 19.9
Source: Company, Angel Research.
Key Highlights
For 4QFY2010, the company’s Sales grew at an impressive 66.5% yoy and 21.4%
qoq albeit on a low base due to the slowdown in 4QFY2009. In 4QFY2010, OPM at
29.0% fell from the high of 36.8% in 3QFY2010. For FY2010, Standalone OPM
stood at the historical high of 33.5%. This came primarily due to the fact that
globally graphite electrode prices increased in CY2009 on higher needle coke
prices, but other raw material and manufacturing costs fell during the year. Going
ahead, OPMs are expected to further correct to more reasonable levels of around
24.0%. PAT Margin for 4QFY2010 was 16.4% compared to 22.6% in 3QFY2010.
Sales in FY2010 were boosted by the availability of the High Speed Steel
manufacturing capacity throughout the year. Steel Division Sales registered 145.0%
yoy and 32.4% qoq increase in Sales for 4QFY2010.
May 14, 2010 2
3. Rallis I 4QFY2010 Result Update
Exhibit 2: Segment-wise Performance (Standalone)
Y/E March (Rs cr) 4QFY09 3QFY10 4QFY10 % chg % chg
Rs cr Rs cr Rs cr qoq yoy
Total Revenue
A) Graphite & Carbon 170.5 242.2 280.8 15.9 64.7
B) Power 10.0 9.4 8.6 (8.3) (13.7)
C) Steel 9.2 17.0 22.6 32.9 145.0
D) Others 30.8 22.7 32.1 41.1 4.4
Total 220.4 291.4 344.1 18.1 56.1
Less: Inter-Segmental Revenue 17.1 12.5 5.5 (55.7) (67.7)
Net Sales 203.3 278.9 338.6 21.4 66.5
EBIT Margin (%)
A) Graphite & Carbon 22.5 34.4 27.2 (726bp) 467bp
B) Power 26.4 76.2 62.0 (1,420bp) 3,559bp
C) Steel (16.7) (2.1) 8.5 1,061bp 2518bp
D) Others 10.4 24.3 22.6 (173bp) 1,215bp
Source: Company, Angel Research.
Key takeaways from Management discussion
• Global leaders like SGL and GrafTech have shown more aggression to win
orders in the last few months to ensure better capacity utilisation. Consequently,
graphite electrode prices have declined by 8-10% over the last few months.
• Management expects downside in pricing to be minimal, 3-4% at most, over the
next couple of quarters. Post that, as demand for graphite electrodes increases,
capacity utilisation of the global players will increase and prices would start
firming up again.
• Currently, graphite electrodes contracts are quarterly or half-yearly in nature.
• Management expects the contracts to remain quarterly, till there is volatility in
prices. Once there is stability in prices and buyers expect secular firming of
prices, the contracts are expected to return to annual basis.
• Currently, expansion at the Durgapur facility is progressing slowly. However, it is
expected to pick up from 1Q or 2Q of FY2011E to get completed within the
targeted time frame.
Other developments
The company has announced final dividend of Rs3.5/share for FY2010, viz. 175% of
the Face Value. Last year, the Dividend was Rs3.0/share.
May 14, 2010 3
4. Rallis I 4QFY2010 Result Update
Outlook and Valuation
The outlook for GIL remains promising over the next few years, as steel production
through the EAF route is expected to increase. In fact, current overall steel production
is near its pre-crisis levels of 2007 and 2008. We maintain our estimates for
FY2011E and FY2012E. We expect Sales to increase at a CAGR of 19.1% over
FY2010-12E. OPMs are expected to be 24.4% and 24.2% in FY2011E and FY2012E
respectively. We expect the company to post an EPS of Rs12.2 in FY2011E and
Rs14.0 in FY2012E. At the CMP, the stock is trading at 1.2x and 1.1x FY2011E and
FY2012E P/BV, respectively. Given the company’s strong growth potential and
attractive valuations, we maintain a Buy on the stock, with a Target Price of Rs117.
Exhibit 3: One-year forward P/BV band
140
120
100
Share Pirce (Rs)
80
60
40
20
0
Apr-02
Apr-03
Apr-04
Apr-05
Apr-06
Apr-07
Apr-08
Apr-09
Apr-10
Aug-02
Dec-02
Aug-03
Dec-03
Aug-04
Dec-04
Aug-05
Dec-05
Aug-06
Dec-06
Aug-07
Dec-07
Aug-08
Dec-08
Aug-09
Dec-09
Price 0.2x 0.5x 0.8x 1.1x 1.5x
Source: Company, Angel Research
May 14, 2010 4
5. Rallis I 4QFY2010 Result Update
Profit & Loss Statement (Consolidated) (Rs cr)
Y/E March FY2007 FY2008 FY2009 FY2010 FY2011E FY2012E
Gross sales 1,171 1,388 1,558 1,394 1,684 2,008
Less: Excise duty 53.2 57.1 59.5 47.0 84.0 98.8
Net Sales 1,118 1,331 1,498 1,347 1,600 1,910
Other operating income - - - - - -
Total operating income 1,118 1,331 1,498 1,347 1,600 1,910
% chg 19.1 12.6 (10.1) 18.8 19.3
Total Expenditure 893 1,054 1,133 951 1,210 1,448
Net Raw Materials 358 468 487 480 512 611
Other Mfg costs 301 321 381 350 376 450
Personnel 117 130 135 122 157 191
Other 117 134 130 - 165 196
EBITDA 225 278 366 396 390 461
% chg 23.5 31.8 8.3 (1.5) 18.3
(% of Net Sales) 20.1 20.9 24.4 29.4 24.4 24.2
Depreciation& Amortisation 38 41 44 50 49 62
EBIT 187 237 322 346 341 400
% chg 26.4 36.0 7.6 (1.4) 17.2
(% of Net Sales) 16.7 17.8 21.5 25.7 21.3 20.9
Interest & other Charges 37 43 35 14 17 22
Other Income 131 29 25 32 32 32
(% of PBT) 46.7 13.2 8.1 8.9 9.0 7.9
Share in profit of Associates - - - - - -
Recurring PBT 281 223 312 364 356 410
% chg (20.7) 39.8 16.6 (2.1) 15.1
Extraordinary Expense/(Inc.) - - 57 - - -
PBT (reported) 281 223 255 364 356 410
Tax 59 81 18 129 118 135
(% of PBT) 20.9 36.2 7.1 35.5 33.0 33.0
PAT (reported) 223 142 237 235 239 275
Add: Share of earnings of associate - - - - - -
Less: Minority interest (MI) - - - - - -
Prior period items 75 (0) (1) - - -
PAT after MI (reported) 223 142 237 235 239 275
ADJ. PAT 147 143 238 235 239 275
% chg (3.3) 67.3 (1.5) 1.6 15.1
(% of Net Sales) 13.2 10.7 15.9 17.4 14.9 14.4
Basic EPS (Rs) 15.1 9.6 15.3 13.7 12.2 14.0
Fully Diluted EPS (Rs) 12.5 8.0 11.6 10.7 12.2 14.0
% chg (36.2) 45.4 (7.6) 14.1 15.1
May 14, 2010 5
6. Rallis I 4QFY2010 Result Update
Balance Sheet (Consolidated) (Rs cr)
Y/E March FY2007 FY2008 FY2009 FY2010 FY2011E FY2012E
SOURCES OF FUNDS
Equity Share Capital 29 30 34 34 39 39
Preference Capital - - - - - -
Reserves& Surplus 614 725 1,085 1,249 1,527 1,710
Shareholders Funds 643 755 1,119 1,283 1,566 1,750
Minority Interest
Total Loans 706 619 528 324 170 320
Deferred Tax Liability (Net) 64 70 62 74 74 74
Total Liabilities 1,413 1,444 1,709 1,681 1,810 2,144
APPLICATION OF FUNDS
Gross Block 815 834 995 1,010 1,030 1,535
Less: Acc. Depreciation 262 303 435 485 534 596
Net Block 553 531 559 524 495 939
Capital Work-in-Progress 8 9 14 20 257 15
Goodwill - - - - - -
Investments 111 106 101 187 100 100
Current Assets 993 1,133 1,336 1,230 1,334 1,520
Cash 92 66 177 80 85 31
Loans & Advances 118 108 132 119 141 168
Inventories 439 534 695 729 640 764
Debtors 344 412 318 291 457 546
Other - 13 14 11 11 11
Current liabilities 252 335 301 281 377 430
Net Current Assets 741 798 1,035 949 958 1,089
Mis. Exp. not written off - - - - - -
Total Assets 1,413 1,444 1,709 1,681 1,810 2,144
Cash Flow (Consolidated) (Rs cr)
Y/E March FY2007 FY2008 FY2009 FY2010 FY2011E FY2012E
Profit before tax 281 223 254 364 356 410
Depreciation 38 41 44 50 49 62
(Inc.)/ Dec. in Working Capital (166) (92) (103) (23) 18 (158)
Less: Other income 131 29 25 32 32 32
Direct taxes paid 59 81 18 129 118 135
Cash Flow from Operations (38) 62 151 229 273 146
(Inc.)/ Dec. in Fixed Assets (76) (21) (165) (21) (257) (263)
(Inc.)/ Dec. in Investments (98) 5 5 (86) 87 -
(Inc.)/ Dec. in loans and advances (29) 10 (24) 13 (22) (27)
Other income 131 29 25 32 32 32
Cash Flow from Investing (72) 23 (158) (62) (160) (258)
Issue of Equity - 23 4 3 133 -
Inc./(Dec.) in loans 89 (86) (91) (204) (154) 150
Dividend Paid (Incl. Tax) 51 53 60 70 92 92
Others 11 6 265 8 4 -
Cash Flow from Financing 49 (111) 118 (264) (109) 58
Inc./(Dec.) in Cash (60) (25) 111 (97) 4 (54)
Opening Cash balances 152 92 66 177 80 85
Closing Cash balances 92 66 177 80 85 31
May 14, 2010 6
8. Rallis I 4QFY2010 Result Update
Research Team Tel: 022-4040 3800 E-mail: research@angeltrade.com Website: www.angeltrade.com
DISCLAIMER
This document is solely for the personal information of the recipient, and must not be singularly used as the basis of any investment decision. Nothing in this
document should be construed as investment or financial advice. Each recipient of this document should make such investigations as they deem necessary to
arrive at an independent evaluation of an investment in the securities of the companies referred to in this document (including the merits and risks involved),
and should consult their own advisors to determine the merits and risks of such an investment.
Angel Securities Limited, its affiliates, directors, its proprietary trading and investment businesses may, from time to time, make investment decisions that are
inconsistent with or contradictory to the recommendations expressed herein. The views contained in this document are those of the analyst, and the company
may or may not subscribe to all the views expressed within.
Reports based on technical and derivative analysis center on studying charts of a stock's price movement, outstanding positions and trading volume, as
opposed to focusing on a company's fundamentals and, as such, may not match with a report on a company's fundamentals.
The information in this document has been printed on the basis of publicly available information, internal data and other reliable sources believed to be true,
and is for general guidance only. Angel Securities Limited has not independently verified all the information contained within this document. Accordingly, we
cannot testify, nor make any representation or warranty, express or implied, to the accuracy, contents or data contained within this document. While Angel
Securities Limited endeavours to update on a reasonable basis the information discussed in this material, there may be regulatory, compliance, or other
reasons that prevent us from doing so.
This document is being supplied to you solely for your information, and its contents, information or data may not be reproduced, redistributed or passed on,
directly or indirectly.
Angel Securities Limited and its affiliates may seek to provide or have engaged in providing corporate finance, investment banking or other advisory services
in a merger or specific transaction to the companies referred to in this report, as on the date of this report or in the past.
Neither Angel Securities Limited, nor its directors, employees or affiliates shall be liable for any loss or damage that may arise from or in connection with the
use of this information.
Note: Please refer to the important `Stock Holding Disclosure' report on the Angel website (Research Section).
Disclosure of Interest Statement Graphite India
1. Analyst ownership of the stock No
2. Angel and its Group companies ownership of the stock No
3. Angel and its Group companies’ Directors ownership of the stock No
4. Broking relationship with company covered No
Note: We have not considered any Exposure below Rs 1 lakh for Angel and its Group companies.
.
Address: Acme Plaza, ‘A’ Wing, 3rd Floor, M.V. Road, Opp. Sangam Cinema, Andheri (E), Mumbai - 400 059.
Tel : (022) 3952 4568 / 4040 3800
Angel Broking Ltd: BSE Sebi Regn No : INB 010996539 / CDSL Regn No: IN - DP - CDSL - 234 - 2004 / PMS Regn Code: PM/INP000001546 Angel Securities Ltd:BSE: INB010994639/INF010994639 NSE:
INB230994635/INF230994635 Membership numbers: BSE 028/NSE:09946
Angel Capital & Debt Market Ltd: INB 231279838 / NSE FNO: INF 231279838 / NSE Member code -12798 Angel Commodities Broking (P) Ltd: MCX Member ID: 12685 / FMC Regn No: MCX / TCM /
CORP / 0037 NCDEX : Member ID 00220 / FMC Regn No: NCDEX / TCM / CORP / 0302
May 14, 2010 8