1. 4QFY2010 Result Update I Oil & Gas
April 23, 2010
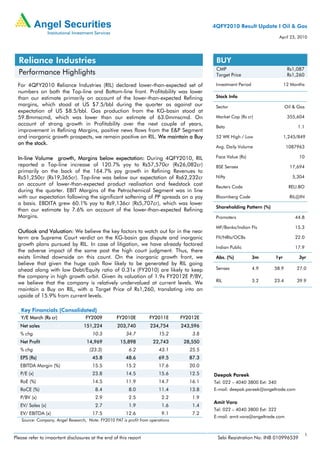
Reliance Industries BUY
CMP Rs1,087
Performance Highlights Target Price Rs1,260
For 4QFY2010 Reliance Industries (RIL) declared lower-than-expected set of Investment Period 12 Months
numbers on both the Top-line and Bottom-line front. Profitability was lower
than our estimate primarily on account of the lower-than-expected Refining Stock Info
margins, which stood at US $7.5/bbl during the quarter as against our Sector Oil & Gas
expectation of US $8.5/bbl. Gas production from the KG-basin stood at
59.8mmscmd, which was lower than our estimate of 63.0mmscmd. On Market Cap (Rs cr) 355,604
account of strong growth in Profitability over the next couple of years,
Beta 1.1
improvement in Refining Margins, positive news flows from the E&P Segment
and inorganic growth prospects, we remain positive on RIL. We maintain a Buy 52 WK High / Low 1,245/849
on the stock.
Avg. Daily Volume 1087963
In-line Volume growth, Margins below expectation: During 4QFY2010, RIL Face Value (Rs) 10
reported a Top-line increase of 120.7% yoy to Rs57,570cr (Rs26,082cr) BSE Sensex 17,694
primarily on the back of the 164.7% yoy growth in Refining Revenues to
Rs51,250cr (Rs19,365cr). Top-line was below our expectation of Rs62,232cr Nifty 5,304
on account of lower-than-expected product realisation and feedstock cost Reuters Code RELI.BO
during the quarter. EBIT Margins of the Petrochemical Segment was in line
with our expectation following the significant softening of PP spreads on a yoy Bloomberg Code RIL@IN
a basis. EBDITA grew 60.1% yoy to Rs9,136cr (Rs5,707cr), which was lower
Shareholding Pattern (%)
than our estimate by 7.6% on account of the lower-than-expected Refining
Margins. Promoters 44.8
MF/Banks/Indian FIs 15.3
Outlook and Valuation: We believe the key factors to watch out for in the near
term are Supreme Court verdict on the KG-basin gas dispute and inorganic FII/NRIs/OCBs 22.0
growth plans pursued by RIL. In case of litigation, we have already factored
Indian Public 17.9
the adverse impact of the same post the high court judgment. Thus, there
exists limited downside on this count. On the inorganic growth front, we Abs. (%) 3m 1yr 3yr
believe that given the huge cash flow likely to be generated by RIL going
ahead along with low Debt/Equity ratio of 0.31x (FY2010) are likely to keep Sensex 4.9 58.9 27.0
the company in high growth orbit. Given its valuation of 1.9x FY2012E P/BV,
we believe that the company is relatively undervalued at current levels. We RIL 3.2 23.4 39.9
maintain a Buy on RIL, with a Target Price of Rs1,260, translating into an
upside of 15.9% from current levels.
Key Financials (Consolidated)
Y/E March (Rs cr) FY2009 FY2010E FY2011E FY2012E
Net sales 151,224 203,740 234,754 243,596
% chg 10.3 34.7 15.2 3.8
Net Profit 14,969 15,898 22,743 28,550
% chg (23.3) 6.2 43.1 25.5
EPS (Rs) 45.8 48.6 69.5 87.3
EBITDA Margin (%) 15.5 15.2 17.6 20.0
P/E (x) 23.8 14.5 15.6 12.5 Deepak Pareek
RoE (%) 14.5 11.9 14.7 16.1 Tel: 022 – 4040 3800 Ext: 340
RoCE (%) 8.4 8.0 11.4 13.8 E-mail: deepak.pareek@angeltrade.com
P/BV (x) 2.9 2.5 2.2 1.9
Amit Vora
EV/ Sales (x) 2.7 1.9 1.6 1.4
Tel: 022 – 4040 3800 Ext: 322
EV/ EBITDA (x) 17.5 12.6 9.1 7.2
E-mail: amit.vora@angeltrade.com
Source: Company, Angel Research, Note: FY2010 PAT is profit from operations
1
Please refer to important disclosures at the end of this report Sebi Registration No: INB 010996539
3. Reliance Industries I 4QFY2010 Result Update
Key Highlights
Volumes drive Top-line, EBITDA disappoints: RIL reported lower-than expected
4QFY2010 numbers on the Top-line and EBITDA front. Top-line increased 120.7%
yoy to Rs57,570cr (Rs26,082cr) primarily on the back of the 164.7% yoy growth in
Refining Revenues to Rs51,250cr (Rs19,365cr) and a whopping 486.7% yoy
increase in Oil & Gas Revenues to Rs4,318cr (Rs736cr). Growth in the Refining
Segment was driven by the increase in Refining throughput during the quarter
coupled with the increase in crude oil prices. Crude oil processed during the quarter
was higher by 114.4% yoy to 16.7mn tonnes (7.79mn tonnes) following
commissioning of the SEZ refinery. KG-D6 gas production further scaled up in the
current quarter with average production increasing qoq to 60mmscmd (46mmscmd
in 4QFY2010).
Margins below expectations: During the quarter, RIL reported GRMs of US $7.5/bbl
(US $9.9/bbl) as against our expectation of US $8.5/bbl. Benchmark complex
Singapore Margins, during the quarter, stood at around US $4.9/bbl. Thus, RIL
managed to earn a spread of US $2.6/bbl, which was lower than 3QFY2010. Oil &
Gas EBIT Margins declined by a substantial 2,457bp yoy to 39.4% (64.9%) on
account of higher Depreciation of KG-D6. Petchem Margins strengthened on a qoq
basis on account of strong Petrochemical deltas. Operating Profit grew by 60.1% yoy
to Rs9,136cr (Rs5,707cr), which was lower than our estimate by 7.6% on account of
lower than expected Refining Margins.
Depreciation increases, Interest, Other Income decline: Depreciation during the
quarter exceeded our estimate spiking 134.6% yoy on account of the additional
depreciation of the SEZ refinery and KG-basin gas facility. Interest expenditure was
largely flat at Rs525cr, down 0.9% yoy. Other Income at Rs615cr, fell 39.7% yoy
and came in higher than our estimate of Rs500cr.
PAT grew 29.9%: PAT grew 29.9% yoy to Rs4,710cr (Rs3,627cr), which was lower
than our expectation of Rs5,109cr mainly because of lower-than-expected Refining
Margins. Tax rate during the quarter was lower at 19.2% as against our expectation
of 21.0%.
Exhibit 3: EBIT Break-up
100%
90%
80%
70%
60%
50%
40%
30%
20%
10%
0%
1QFY09 2QFY09 3QFY09 4QFY09 1QFY10 2QFY10 3QFY10 4QFY10
Petrochemicals Refining Oil and gas Others
Source: Company, Angel Research
April 23, 2010 3
4. Reliance Industries I 4QFY2010 Result Update
Segment-wise Performance
Refining and Marketing (R&M): Crude processing stood at 16.7mn tonnes (7.79mn
tonnes), up 114.4% yoy, with the refinery reporting capacity utilisation of 108%.
Crude processing was higher on account of RPL’s merger with RIL. Increase in crude
throughput and higher crude oil prices led to 164.7% yoy increase in R&M Revenues
to Rs51,250cr (Rs19,365cr). On the Margins front, RIL reported slightly lower-than
expected GRMs of US $7.5/bbl (US $9.9/bbl) as against our expectation of
US $8.5/bbl. Singapore margins during the quarter averaged at US $4.9/bbl. Thus,
RIL managed to earn a spread of US $2.6/bbl over the same, which was lower than
3QFY2010. The primary reason for the lower-than-expected spread over the
benchmark Singapore margins is the absence of fuel oil in RIL’s product slate
(notably fuel oil spreads improved during 4QFY2010 in turn aiding expansion of the
benchmark Singapore margins). Moreover, the benchmark refining margins in RIL’s
target markets, viz. North America (US Gulf Coast Margins) was lower at
US $3.0/bbl. Thus, the R&M Segment registered a muted performance during the
quarter on account of the lower-than-expected Refining Margins during the quarter.
Exhibit 4: RIL v/s Benchmark Singapore GRMs
18
16
14
12
US $/bbl
10
8
6
4
2
0
1QFY06
2QFY06
3QFY06
4QFY06
1QFY07
2QFY07
3QFY07
4QFY07
1QFY08
2QFY08
3QFY08
4QFY08
1QFY09
2QFY09
3QFY09
4QFY09
1QFY10
2QFY10
3QFY10
4QFY10
RIL GRMs Singapore GRMs
Source: Company, Angel Research
Exhibit 5: Capacity Utilisation Trend
120 17
100 15
80 13
mn tonnes
%
60 11
40 9
20 7
1QFY07
2QFY07
3QFY07
4QFY07
1QFY08
2QFY08
3QFY08
4QFY08
1QFY09
2QFY09
3QFY09
4QFY09
1QFY10
2QFY10
3QFY10
4QFY10
Capacity Utilisation Crude Processing (RHS)
Source: Company, Angel Research
April 23, 2010 4
5. Reliance Industries I 4QFY2010 Result Update
Petrochemicals: The Petrochemical Segment Revenues grew 59.0% yoy to
Rs15,448cr (Rs9,718cr) due to higher crude and product prices yoy and increase in
Volumes following expansion of polypropylene capacity. While the Product deltas
improved on a yoy basis on increase in raw material prices, EBIT Margins declined
by 326bp yoy to 14.4% (17.6%). However, on a qoq basis, Margins strengthened on
the back rise in product deltas wherein the feedstock prices were relatively stable,
leading to expansion of EBIT Margins by 50bp qoq to 14.4% (13.9%).
PP delta, which were at US $47/MT during 3QFY2010 declined to an average US
$30/MT. However, Margins were supported by higher the HDPE-Naphtha and
PVC-EDC deltas. HDPE-Naphtha stood at US $604/MT as against US $524/MT
during 3QFY2010, similarly PVC-EDC deltas increased to US $446/MT in
4QFY2010 from US $398/MT in 3QFY2010. Polyester Margins were also lower on
qoq basis following the decline in POY-PTA-MEG delta and PSF-PTA-MEG deltas.
However, Margins of integrated players like RIL were less impacted on account of
increase in the Fibre Intermediate Margins, which improved due to higher deltas for
MEG-naphtha and PTA-PX.
Oil & Gas: RIL’s KG-D6 gas production during the quarter averaged at
59.8mmscmd, registering a growth of 30.1% qoq. Around 80% of this gas is sold to
the Power (48%) and Fertiliser (31%) Sectors. The company has already executed
GSPAs with 50 customers for selling over 69mmscmd of gas. Gas production
currently stands at 60mmscmd and the company has successfully assessed design
capacity of production facilities to handle 80mmscmd of gas. Thus, further ramp up
in gas production from KG-D6 will happen in 2HQFY2011E.
April 23, 2010 5
6. Reliance Industries I 4QFY2010 Result Update
Outlook and Valuation
FY2010 has been a very challenging one for the company with severe pressure on
the benchmark Refining and Petrochemical Margins on account of the global
slowdown. The ongoing litigation between RIL and RNRL also proved to be a
dampener on the stock. Amidst this scenario, RIL has been able to deliver decent set
of numbers over the period. However, as the global economy recovers from the
recession, demand for petroleum and petrochemical products are bound to improve
and lead to an improvement in RIL’s Profitability. Moreover, increase in Gas
production will also aid Bottom-line growth going ahead. This, coupled with
inorganic growth prospects is likely to keep RIL in strong growth trajectory.
Petrochemical Segment
In spite of the slowdown in the global petrochemical market, the Indian market has
been fairly resistant to the slowdown as is evident from the fact that capacity
utilisation continued to be on the higher end with an increase in demand of 19%
yoy during FY2010. On account of the same, RIL continues to operate at 100%
capacity utilisation with the domestic focus on its Polymer Segment.
The global slowdown resulted in significant softening in the margins of the Polymer
Segment, wherein average HDPE-Naphtha spreads declined from US $629/MT in
FY2009 to US $599/MT FY2010, slightly below the five year average of
US$642/MT. Deltas in the PP Segment (largest contributor to RIL’s Polymer Segment)
were even lower at US $94/MT in FY2010 from US $188/MT in FY2009,
significantly below the five-year average of US $139/MT. Similarly, margins of the
PVC Segment also fell from US $498/MT in FY2009 to US $388/MT (below the five-
year average of US $426/MT).
Exhibit 6: Global Petrochemical Capacity and Operating Rate
Source: RIL
Going ahead, we do not anticipate further significant fall in margins as they are
already lower than their 5-year average. This, coupled with start-up slippages and
slow ramp up of new capacities in the Middle East, are likely to hold the margins.
According to RIL, due to weak polymer margins, around 3.2MT (2.4% of the global
ethylene capacity) of the facilities have been shut down and another 4.3MT (3.2% of
the global ethylene capacity) could close down. Similarly, around 13.4MT (10.0% of
the global ethylene capacity) of ethylene capacity is sub-scale capacity requiring
higher margins to operate. According to RIL, industry trends suggest bottoming out
of global operating rates in 2010 followed by a steep increase in operating rates
due to better demand prospects and further delays in capacity ramp up. This could
lead to a better-than-anticipated demand-supply balance. Thus, margins are bound
to improve from current levels on improved operating rate going ahead.
April 23, 2010 6
7. Reliance Industries I 4QFY2010 Result Update
The Domestic Polyester Segment registered strong growth of 15% yoy in FY2010
driven by robust growth in the PET Segment. In the Polyester Segment, the company
maintained its margins due to the integrated nature of its operations and strong
domestic demand. Going ahead, we believe the trend could continue as RIL is likely
to retain its fully integrated business model, high operating rates and focus on
specialty products.
Refining Segment
Decline in demand for petroleum products led to a challenging FY2010 for the
global refining industry. With oil demand registering the highest ever decline owing
to weak demand and high inventories, product cracks and refining margins eased
significantly during the year (refining margins lowest in the decade). This, coupled
with the decline in light-heavy crude differential (on account of low demand for
transportation fuels), reduced the spreads for complex refiners such as RIL. However,
margins improved considerably during the quarter on improved economic outlook
and higher demand. We had earlier pointed that a lower margins scenario was
largely an unsustainable phenomenon as the average operating cost of refinery
stands close to US $4.0/bbl.
Going ahead, we expect the benchmark Singapore Margins to average around US
$4.5-5.0/bbl during the next fiscal driven by increase in product demand and light-
heavy spreads (on account of rise in crude oil prices, lower OPEC compliance to
production quota). Thus, the worst in terms of refining margins is behind us.
Moreover, improvement in demand in transportation fuels in North America and
Europe is likely to further aid the margin expansion of complex refineries such as
RIL.
E&P Segment
We believe that the E&P Segment is likely to be the key driver of RILs’ profitability
growth going ahead. RIL started gas production from KG-D6 during the year and its
current gas flow rate is close to 60mmscmd. However, full ramp up of the same is
likely to happen in 2QFY2011E. RIL has ramped up oil production at KG-D6 at a
fast pace from 10,000bpd levels in 3QFY2010 to current levels of 32,000bpd. We
expect oil production to further increase to 40,000bpd over the next couple of
quarters. Thus, increased oil production coupled with higher oil prices could result in
improved performance in the ensuing quarters.
Moreover, we expect news flows associated with the E&P Segment to be positive
catalysts for the stock. RIL has planned E&P activities in the prospective Cauvery,
Mahanadi and Kerala Konkan basin. Thus, any new discoveries from these blocks
will lend a fillip to RIL’s valuations. We also expect scope of the recent JV with Atlas
Energy to widen and open new growth vistas for the company. Overall, the E&P
Segment is likely to be one of the key growth areas for RIL going ahead.
Conclusion
Overall, RIL has successfully executed its two mega ventures, viz. KG basin gas and
the SEZ refinery with minimal execution problems as is evident from the strong ramp
up in production at both KG-D6 and SEZ refineries. These ventures speak about
RIL’s successful execution capability as KG-D6 has been one of the fastest deepwater
developments across the globe, while the SEZ refinery is one of the most complex
refineries. We expect these ventures to be likely key drivers of Profitability over the
next couple of years. We expect RIL’s profitability to register 34% CAGR over
FY2010-12E. Ramp up of gas production and higher oil production would likely
increase the share of E&P in the Profit matrix in turn reducing exposure to cyclical
segments. Thus, we remain positive on RIL’s future growth prospects.
April 23, 2010 7
8. Reliance Industries I 4QFY2010 Result Update
We believe the key factors to watch out for in the near term are Supreme Court
verdict on the KG-basin gas dispute and inorganic growth plans pursued by RIL. In
case of litigation, we have already factored the adverse impact of the same post the
high court judgment. Thus, there exists limited downside on this count. On the
inorganic growth front, we believe that given the huge cash flow likely to be
generated by RIL going ahead along with low Debt/Equity ratio of 0.31x are likely to
keep the company in high growth orbit. Given its valuation of 1.9x FY2012E P/BV,
we believe that the company is relatively undervalued at current levels. We maintain
a Buy on RIL, with a Target Price of Rs1,260, translating into an upside of 15.9%
from current levels.
Exhibit 7: One-year forward P/E Band
1800
1600
1400 19x
Share price (Rs)
1200 16x
1000
13x
800
10x
600
7x
400
200
0
Apr-04
Apr-05
Apr-06
Apr-07
Apr-08
Apr-09
Apr-10
Oct-04
Oct-05
Oct-06
Oct-07
Oct-08
Oct-09
Source: Angel Research
Exhibit 8: Premium/Discount in RIL (P/E) v/s Sensex (P/E)
50
40
30
20
10
0
(%)
(10)
(20)
(30)
(40)
(50)
Dec-08
Apr-04
May-08
Oct-07
Aug-06
Feb-10
Mar-07
Jul-09
Nov-04
Jun-05
Jan-06
Prem/Disc to Sensex Historic Avg Disc
Source: Angel Research
April 23, 2010 8
12. Reliance Industries I 4QFY2010 Result Update
Research Team Tel: 4040 3800 E-mail: research@angeltrade.com Website: www.angeltrade.com
DISCLAIMER
This document is solely for the personal information of the recipient, and must not be singularly used as the basis of any investment decision. Nothing in this
document should be construed as investment or financial advice. Each recipient of this document should make such investigations as they deem necessary to
arrive at an independent evaluation of an investment in the securities of the companies referred to in this document (including the merits and risks involved),
and should consult their own advisors to determine the merits and risks of such an investment.
Angel Securities Limited, its affiliates, directors, its proprietary trading and investment businesses may, from time to time, make investment decisions that are
inconsistent with or contradictory to the recommendations expressed herein. The views contained in this document are those of the analyst, and the company
may or may not subscribe to all the views expressed within.
Reports based on technical and derivative analysis center on studying charts of a stock's price movement, outstanding positions and trading volume, as
opposed to focusing on a company's fundamentals and, as such, may not match with a report on a company's fundamentals.
The information in this document has been printed on the basis of publicly available information, internal data and other reliable sources believed to be true,
and is for general guidance only. Angel Securities Limited has not independently verified all the information contained within this document. Accordingly, we
cannot testify, nor make any representation or warranty, express or implied, to the accuracy, contents or data contained within this document. While Angel
Securities Limited endeavours to update on a reasonable basis the information discussed in this material, there may be regulatory, compliance, or other
reasons that prevent us from doing so.
This document is being supplied to you solely for your information, and its contents, information or data may not be reproduced, redistributed or passed on,
directly or indirectly.
Angel Securities Limited and its affiliates may seek to provide or have engaged in providing corporate finance, investment banking or other advisory services
in a merger or specific transaction to the companies referred to in this report, as on the date of this report or in the past.
Neither Angel Securities Limited, nor its directors, employees or affiliates shall be liable for any loss or damage that may arise from or in connection with the
use of this information.
Note: Please refer to the important `Stock Holding Disclosure' report on the Angel website (Research Section).
Disclosure of Interest Statement RIL
1. Analyst ownership of the stock No
2. Angel and its Group companies ownership of the stock Yes
3. Angel and its Group companies’ Directors ownership of the stock Yes
4. Broking relationship with company covered No
Note: We have not considered any Exposure below Rs 1 lakh for Angel and its Group companies.
Address: Acme Plaza, ‘A’ Wing, 3rd Floor, M.V. Road, Opp. Sangam Cinema, Andheri (E), Mumbai - 400 059.
Tel : (022) 3952 4568 / 4040 3800
Angel Broking Ltd: BSE Sebi Regn No : INB 010996539 / CDSL Regn No: IN - DP - CDSL - 234 - 2004 / PMS Regn Code: PM/INP000001546 Angel Securities Ltd:BSE: INB010994639/INF010994639 NSE:
INB230994635/INF230994635 Membership numbers: BSE 028/NSE:09946
Angel Capital & Debt Market Ltd: INB 231279838 / NSE FNO: INF 231279838 / NSE Member code -12798 Angel Commodities Broking (P) Ltd: MCX Member ID: 12685 / FMC Regn No: MCX / TCM /
CORP / 0037 NCDEX : Member ID 00220 / FMC Regn No: NCDEX / TCM / CORP / 0302
April 23, 2010 12