This document provides guidance on key concepts and skills for practical biology experiments, including:
1. Experimental design involves establishing a testable hypothesis with independent and dependent variables. Proper controls and minimizing random/systematic errors ensures fair and reliable tests.
2. Variables, controls, sample size, precision and accuracy must be considered. Results should be recorded in tables and graphs, then analyzed and conclusions made about whether the data supports the original hypothesis.
3. Proper scientific communication includes objective interpretation of results, evaluating sources of error, and stating how experiments could be improved. The conclusion relates directly back to the original hypothesis.
Experimental skills areexaminable in the final
examination
Consult the syllabus (handout given out)
3.
HYPOTHESIS
The starting pointof any experiment – want to
find out something.
An idea which experiments are designed to test
A testable statement (cause and effect)
A statement that connects the independent
and dependent variable
e.g.
1. Light intensity will affect the growth of
plants
2. An increase in temperature will
affect
the rate of enzyme action
4.
Independent Variable
Also referredto as the experimental variable
The variable which is deliberately changed
Should be plotted on x-axis of a graph
e.g. light intensity, temperature
5.
Dependent Variable
The variablewhich may change as a result
of changes to the independent variable
Plotted on y-axis of the graph
e.g. growth rate, rate of enzyme action
6.
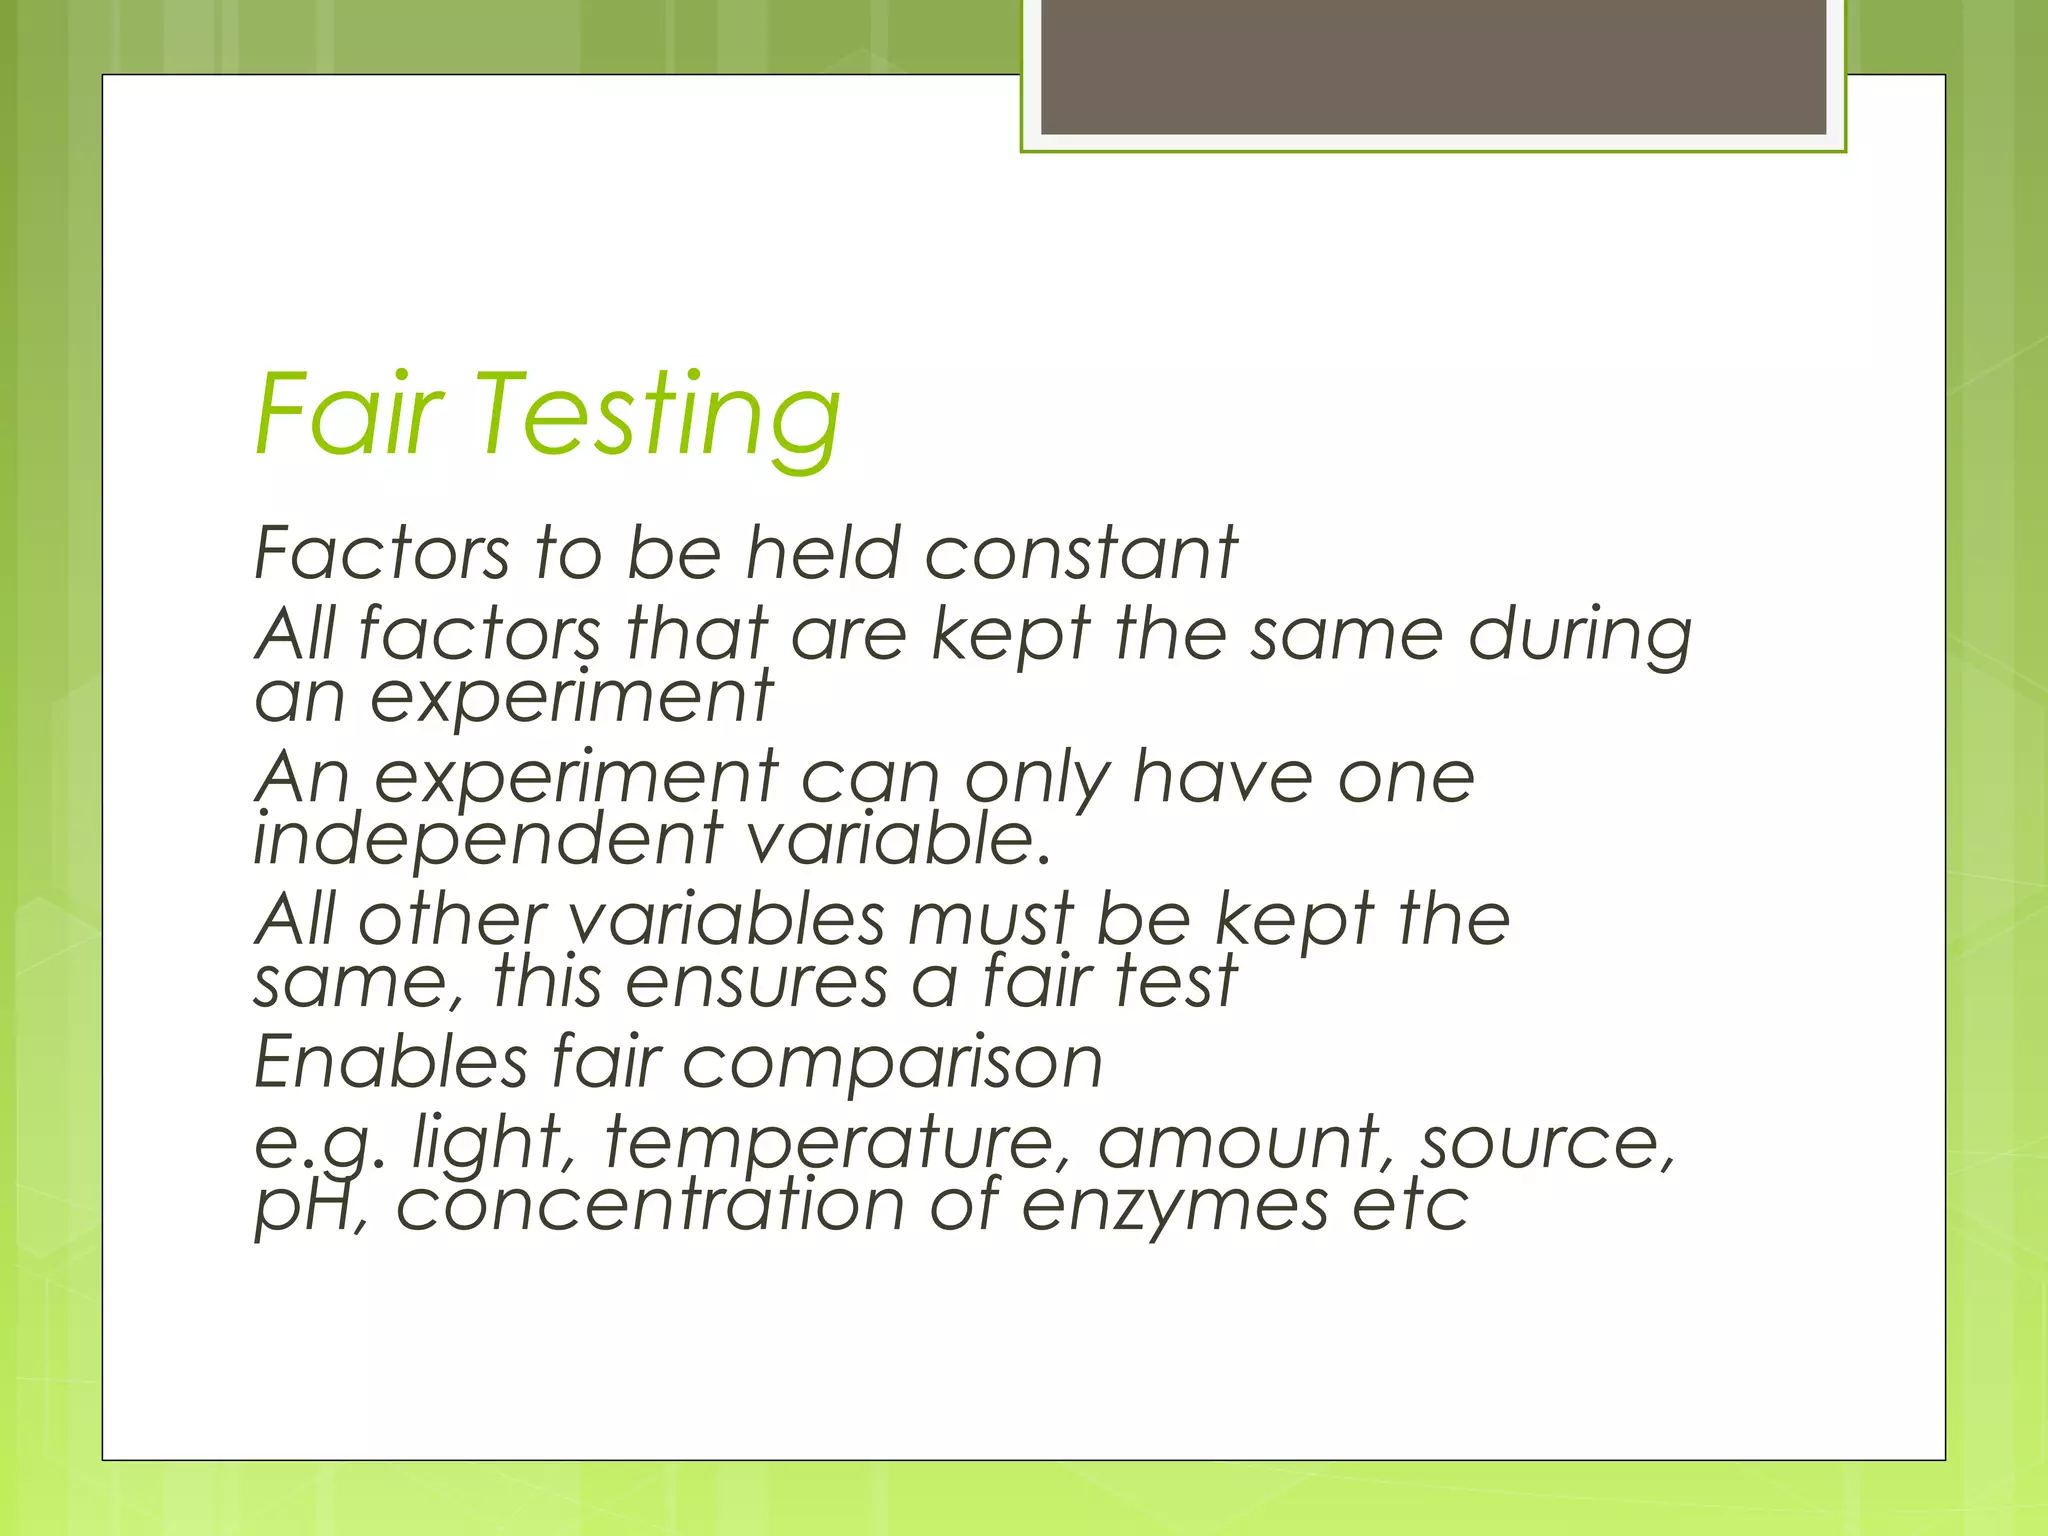
Fair Testing
Factors tobe held constant
All factors that are kept the same during
an experiment
An experiment can only have one
independent variable.
All other variables must be kept the
same, this ensures a fair test
Enables fair comparison
e.g. light, temperature, amount, source,
pH, concentration of enzymes etc
7.
Control
A control isan additional experimental
trial or run.
It is a separate experiment, done exactly
like the others. The only difference is that
no experimental variables are changed.
A control is a neutral "reference point" for
comparison that allows you to see what
changing a variable does by comparing
it to not changing anything.
8.
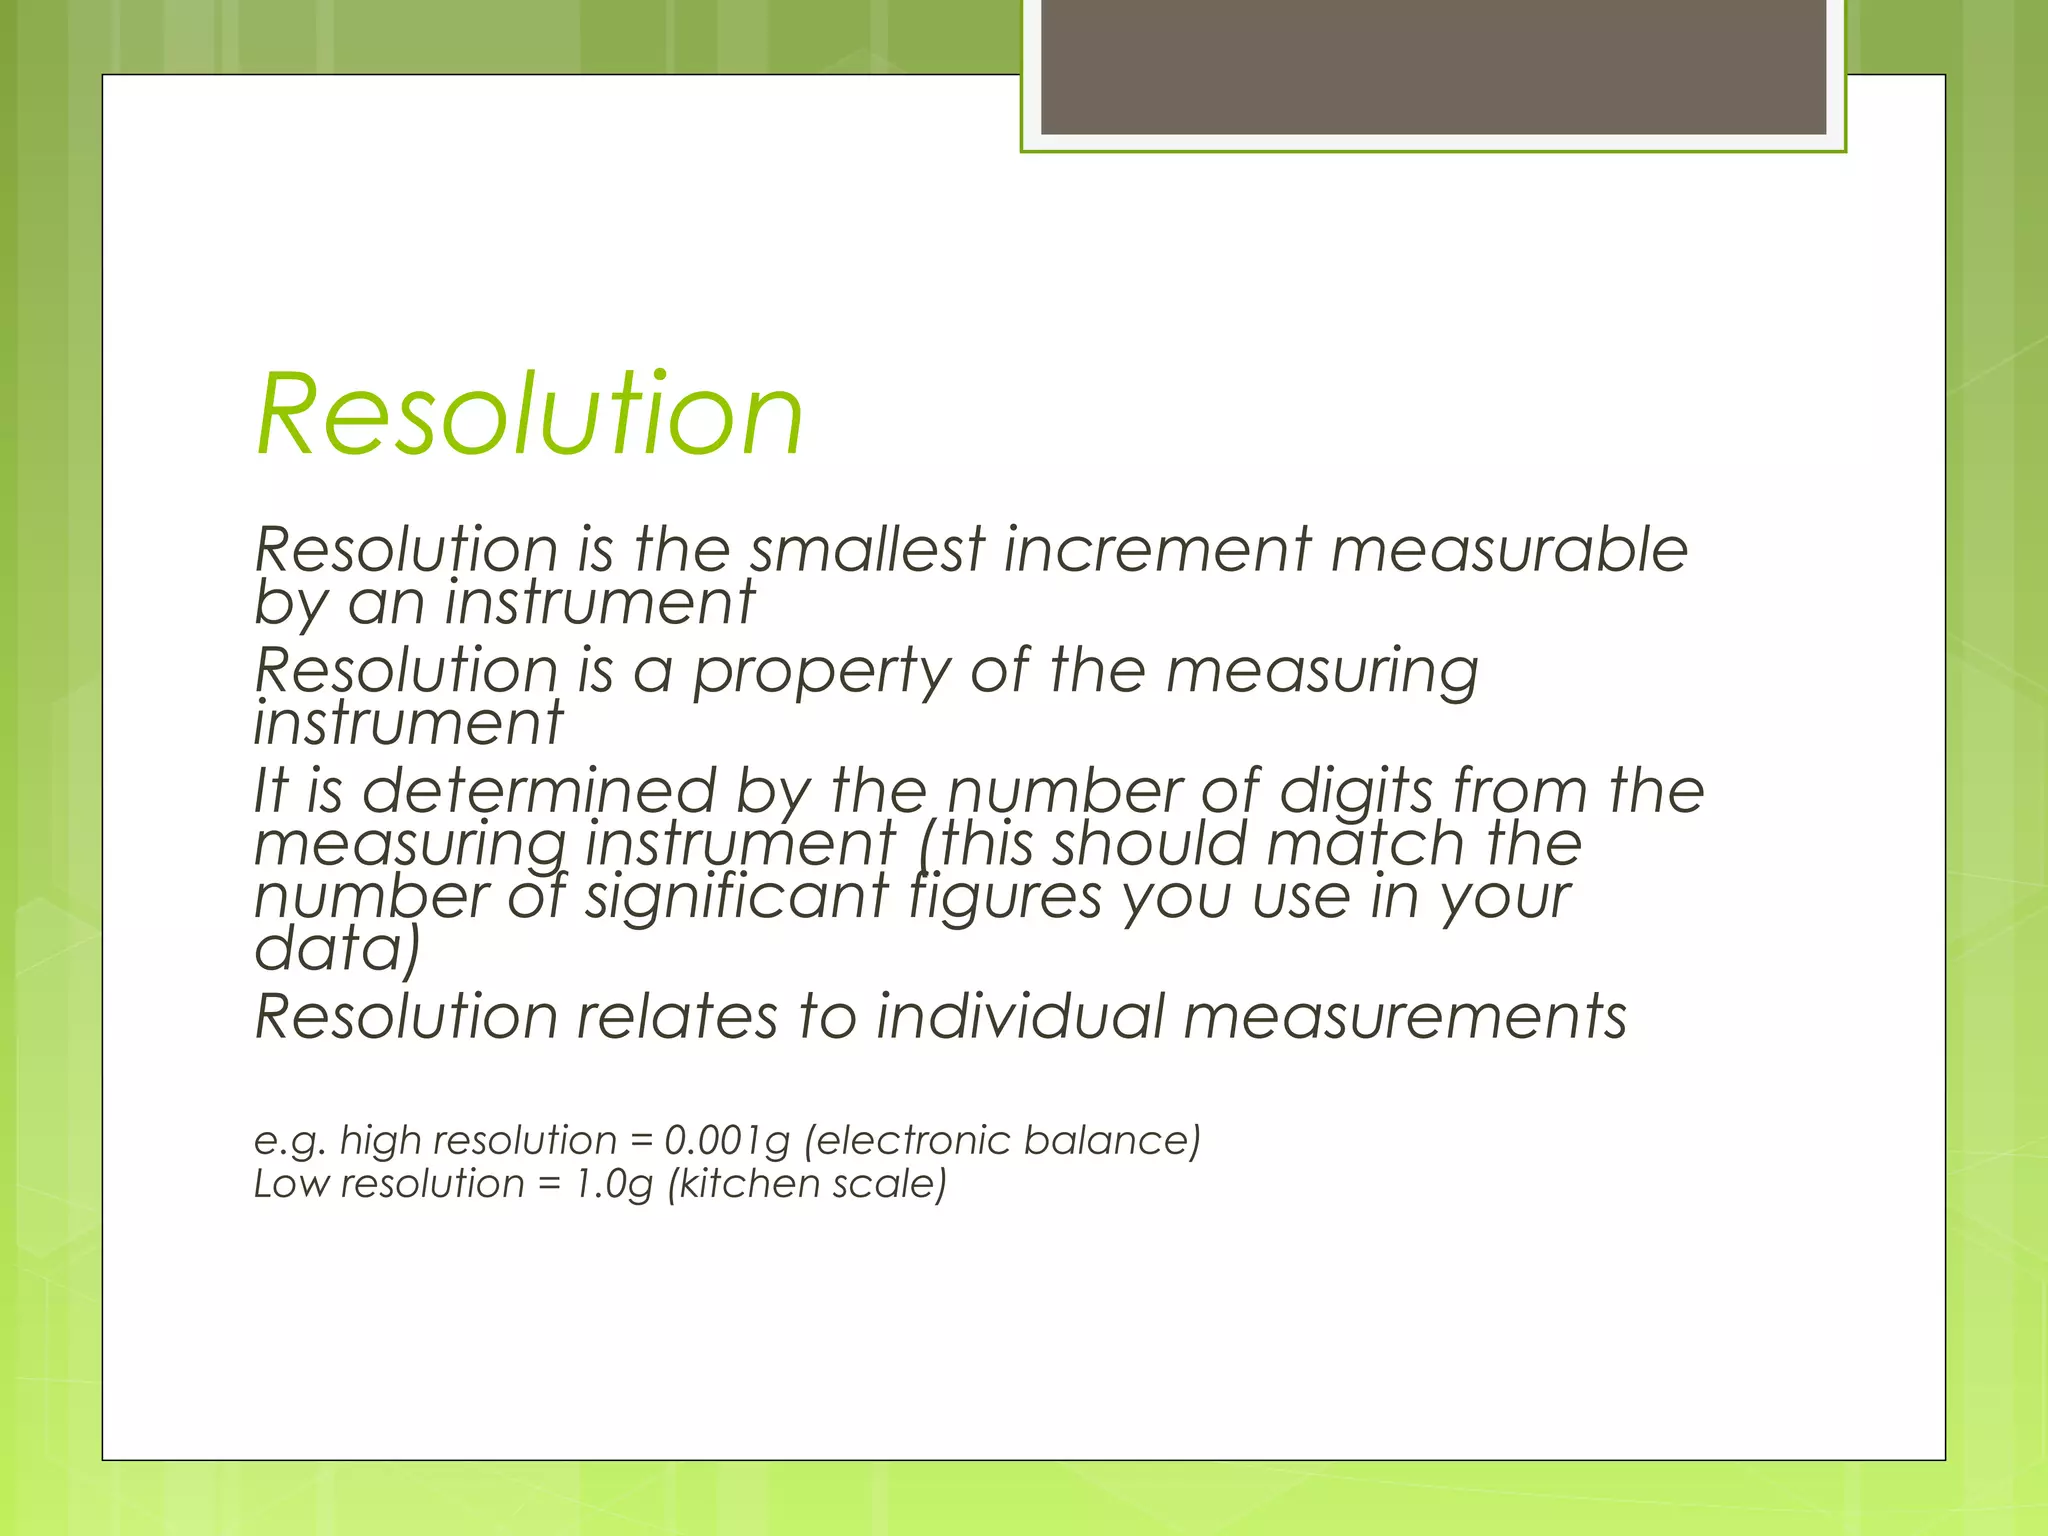
Resolution
Resolution is thesmallest increment measurable
by an instrument
Resolution is a property of the measuring
instrument
It is determined by the number of digits from the
measuring instrument (this should match the
number of significant figures you use in your
data)
Resolution relates to individual measurements
e.g. high resolution = 0.001g (electronic balance)
Low resolution = 1.0g (kitchen scale)
9.
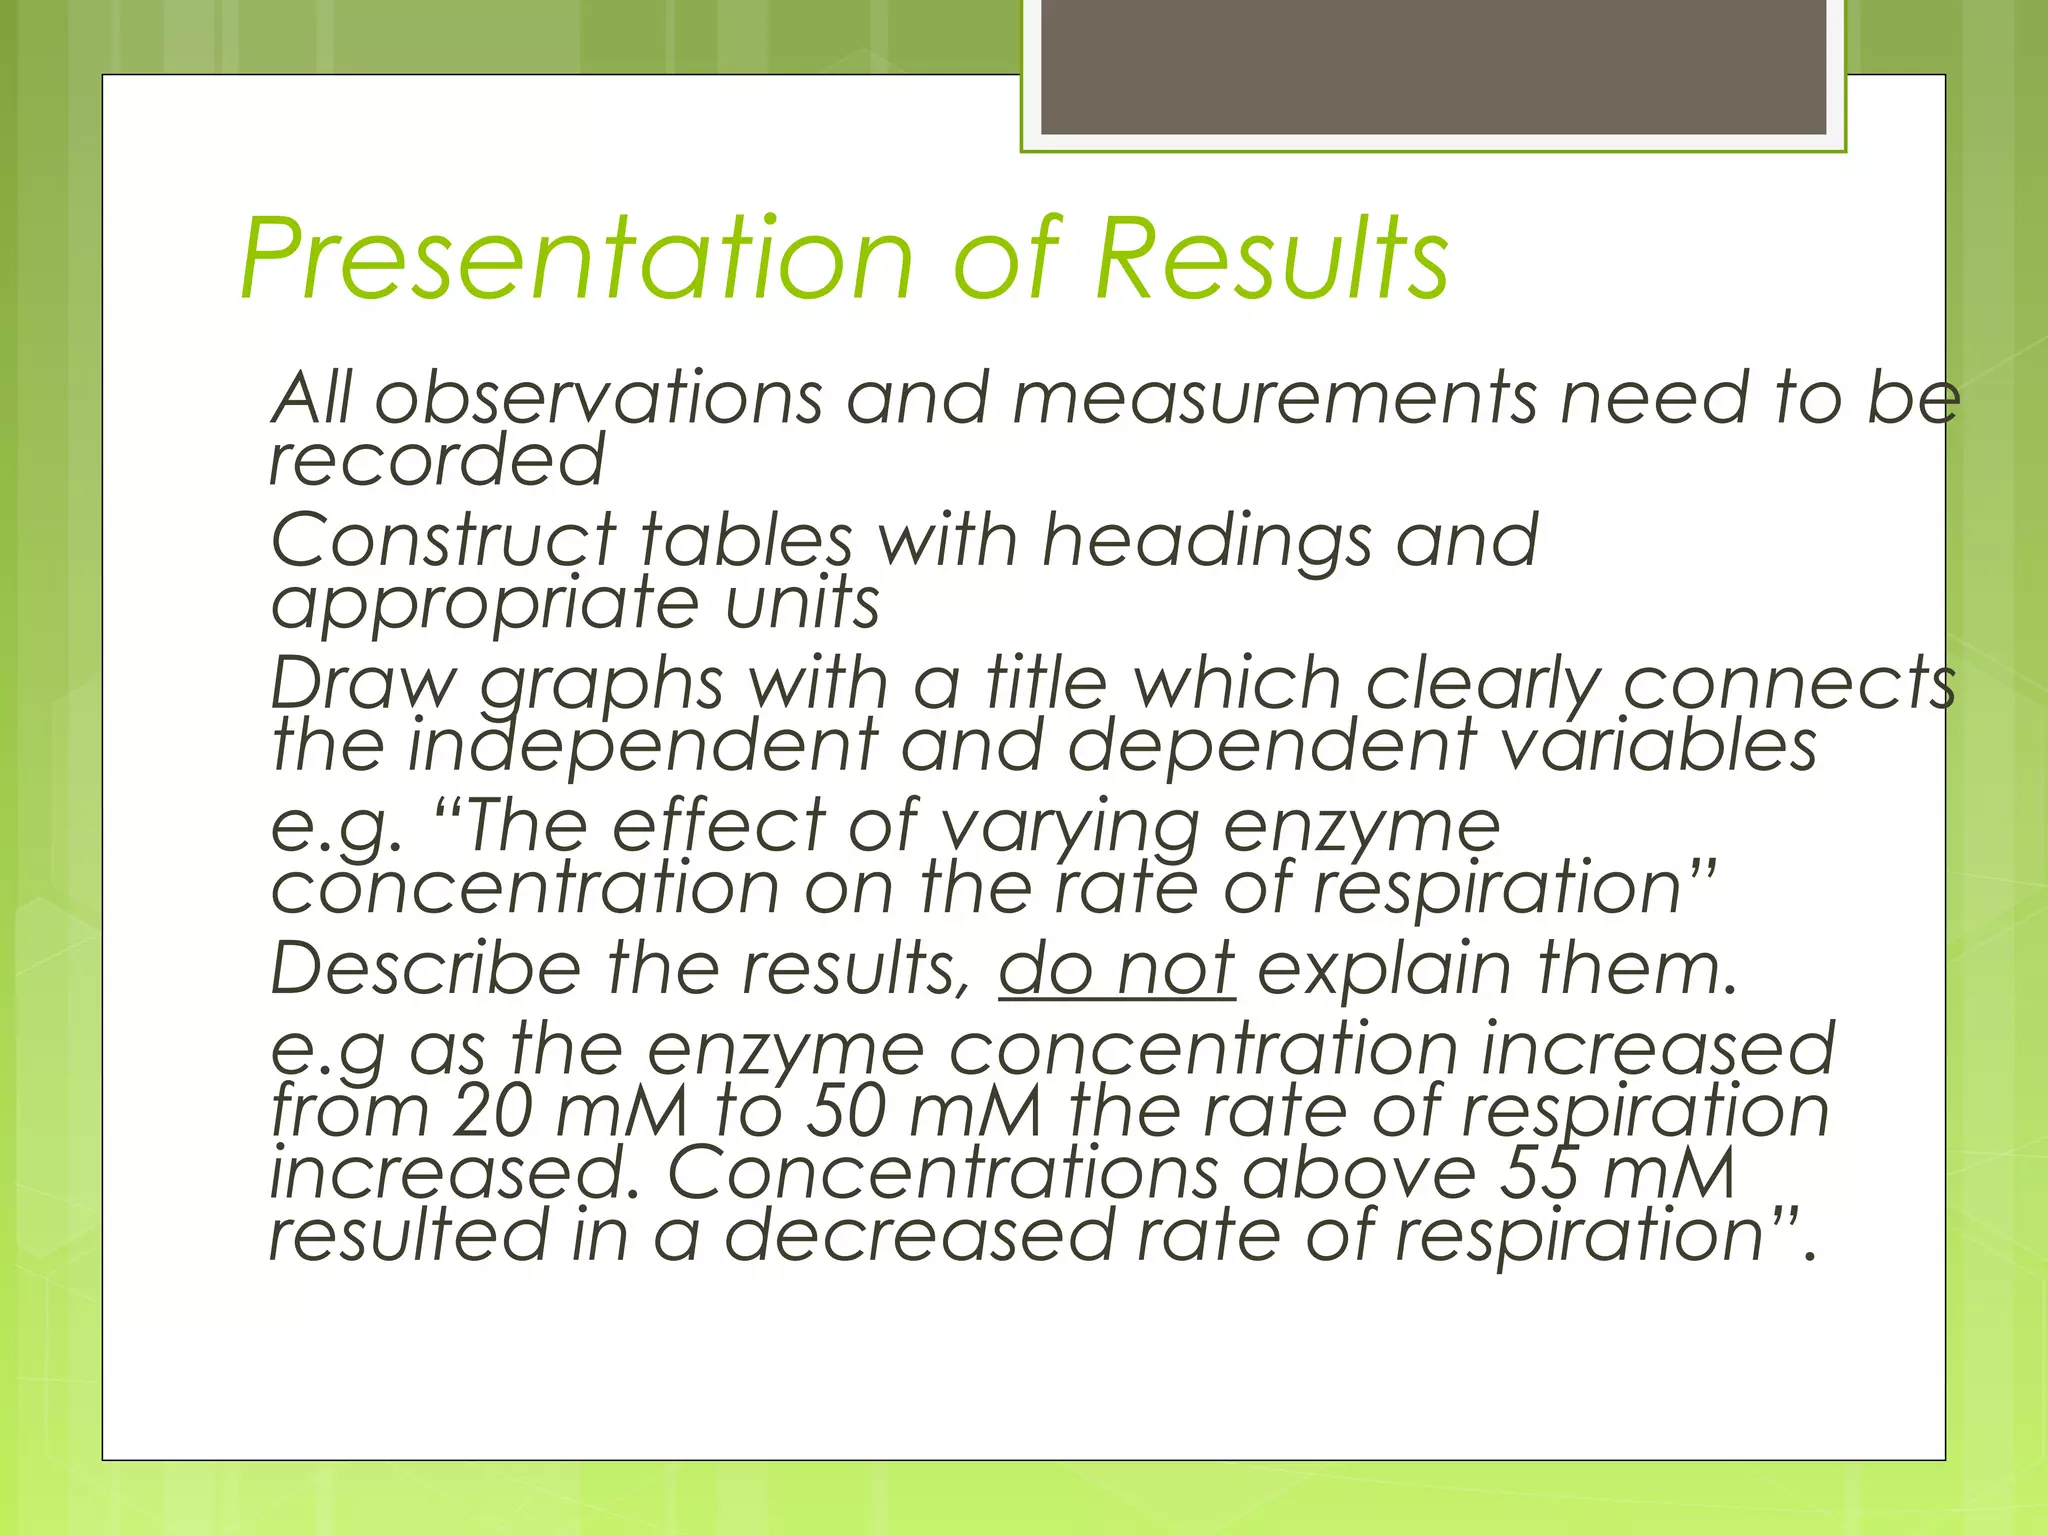
Presentation of Results
Allobservations and measurements need to be
recorded
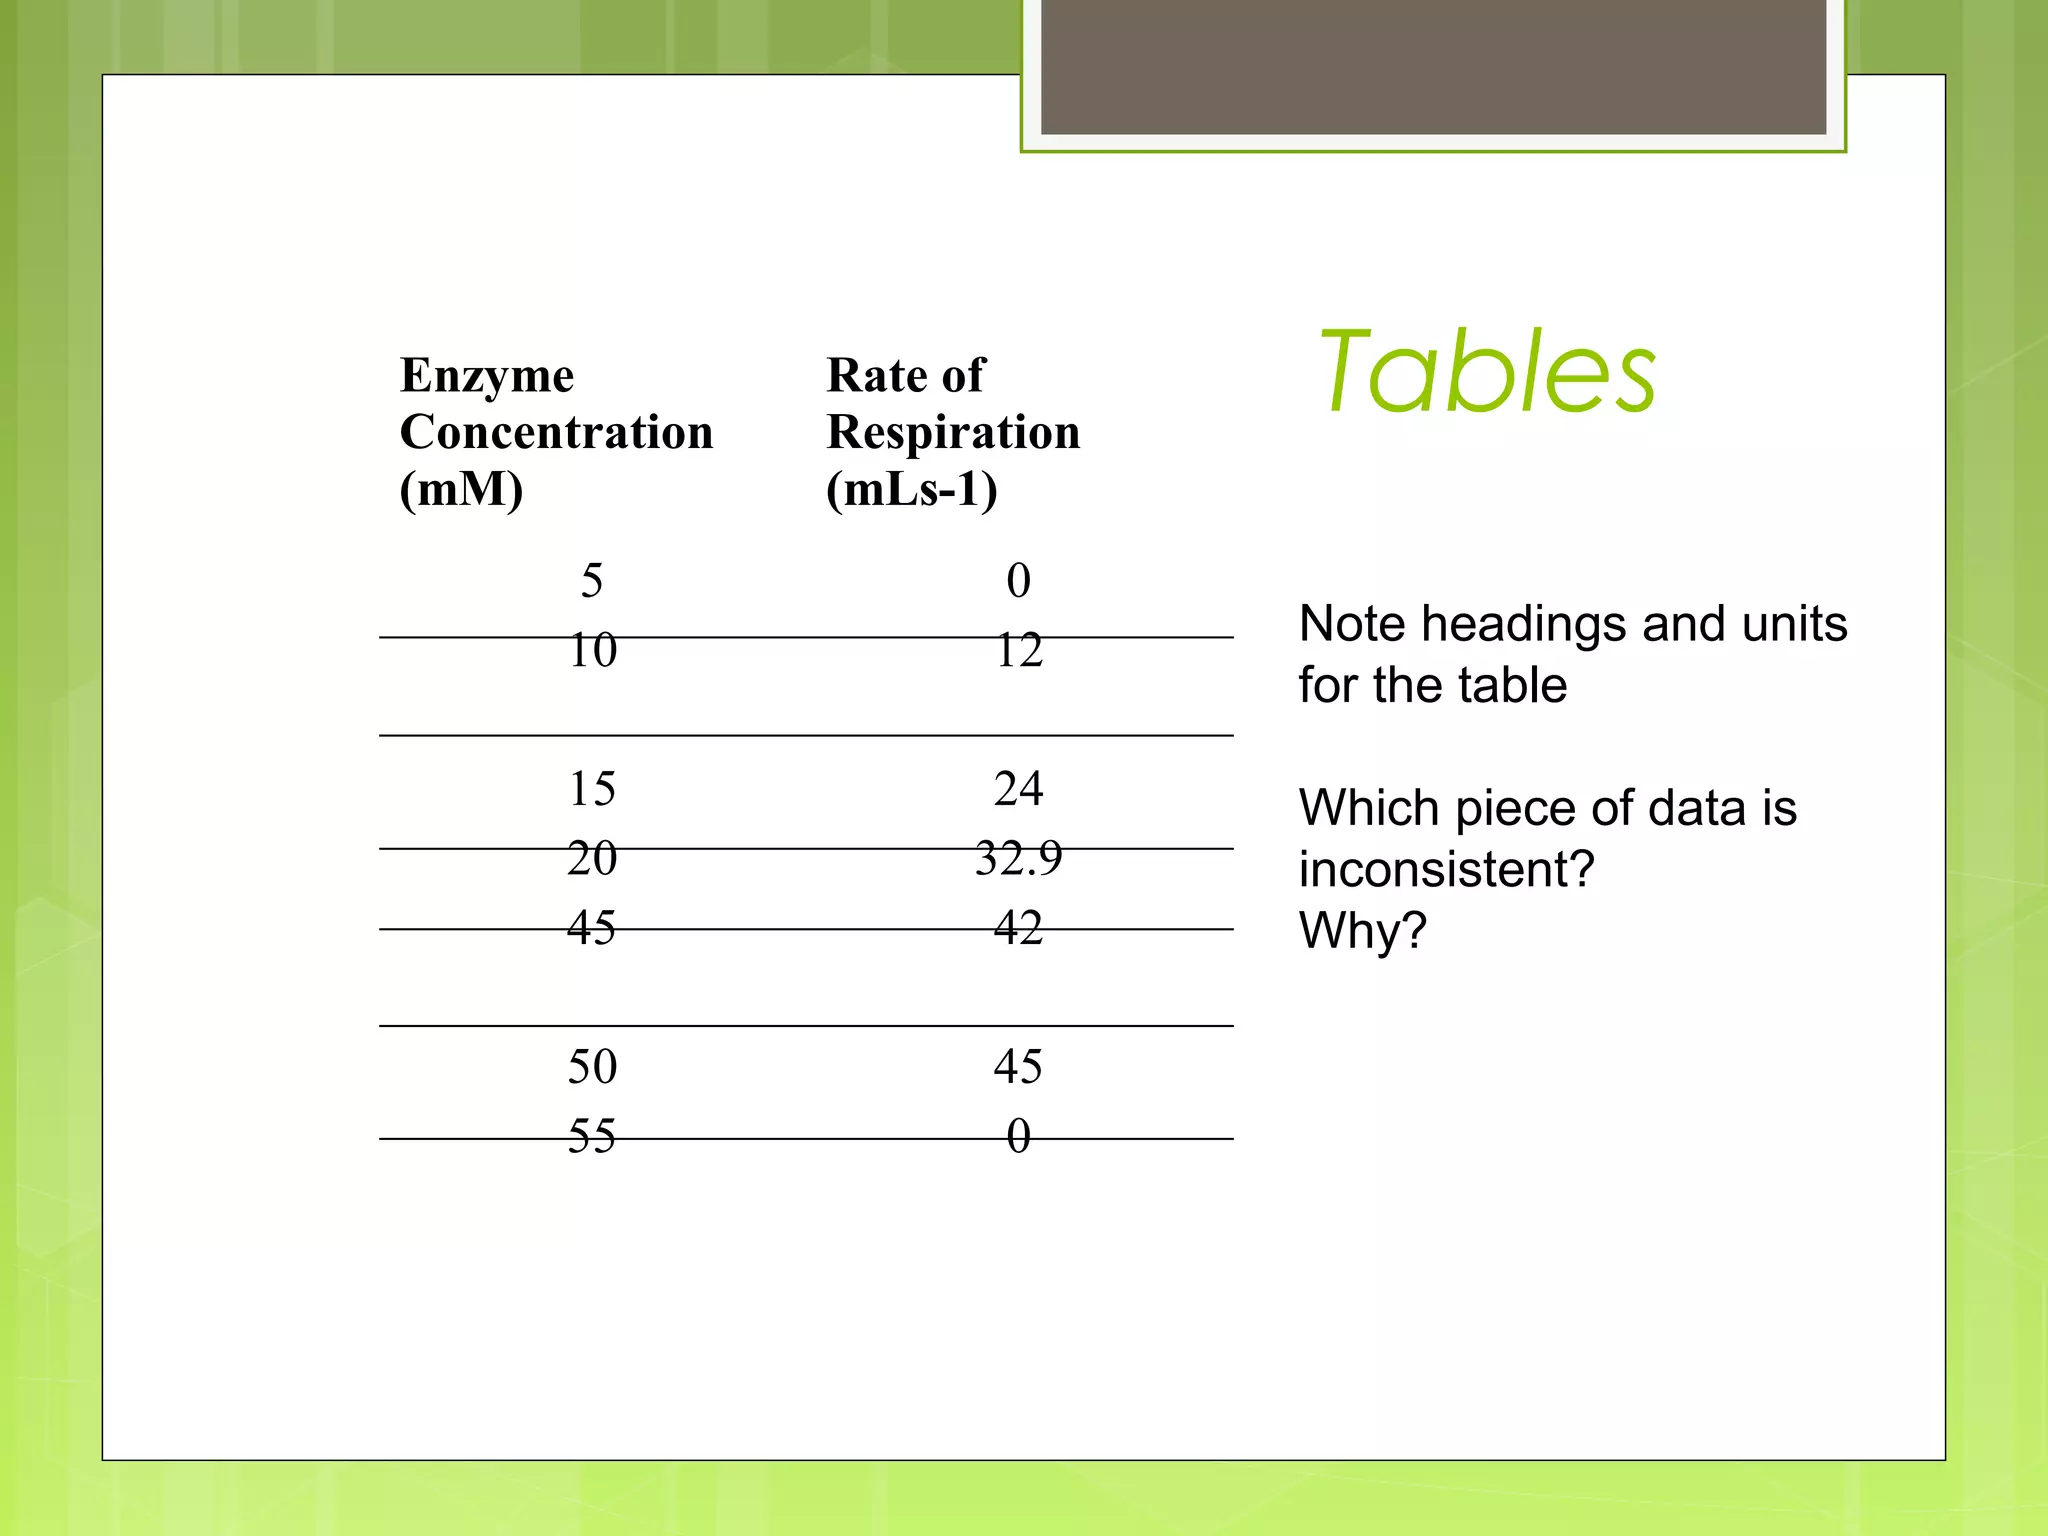
Construct tables with headings and
appropriate units
Draw graphs with a title which clearly connects
the independent and dependent variables
e.g. “The effect of varying enzyme
concentration on the rate of respiration”
Describe the results, do not explain them.
e.g as the enzyme concentration increased
from 20 mM to 50 mM the rate of respiration
increased. Concentrations above 55 mM
resulted in a decreased rate of respiration”.
Drawing Graphs
Axes labelledwith units and appropriate
title
An appropriate scale (uniform/use most
of the axis
Accurate plot of points
Line of best fit
12.
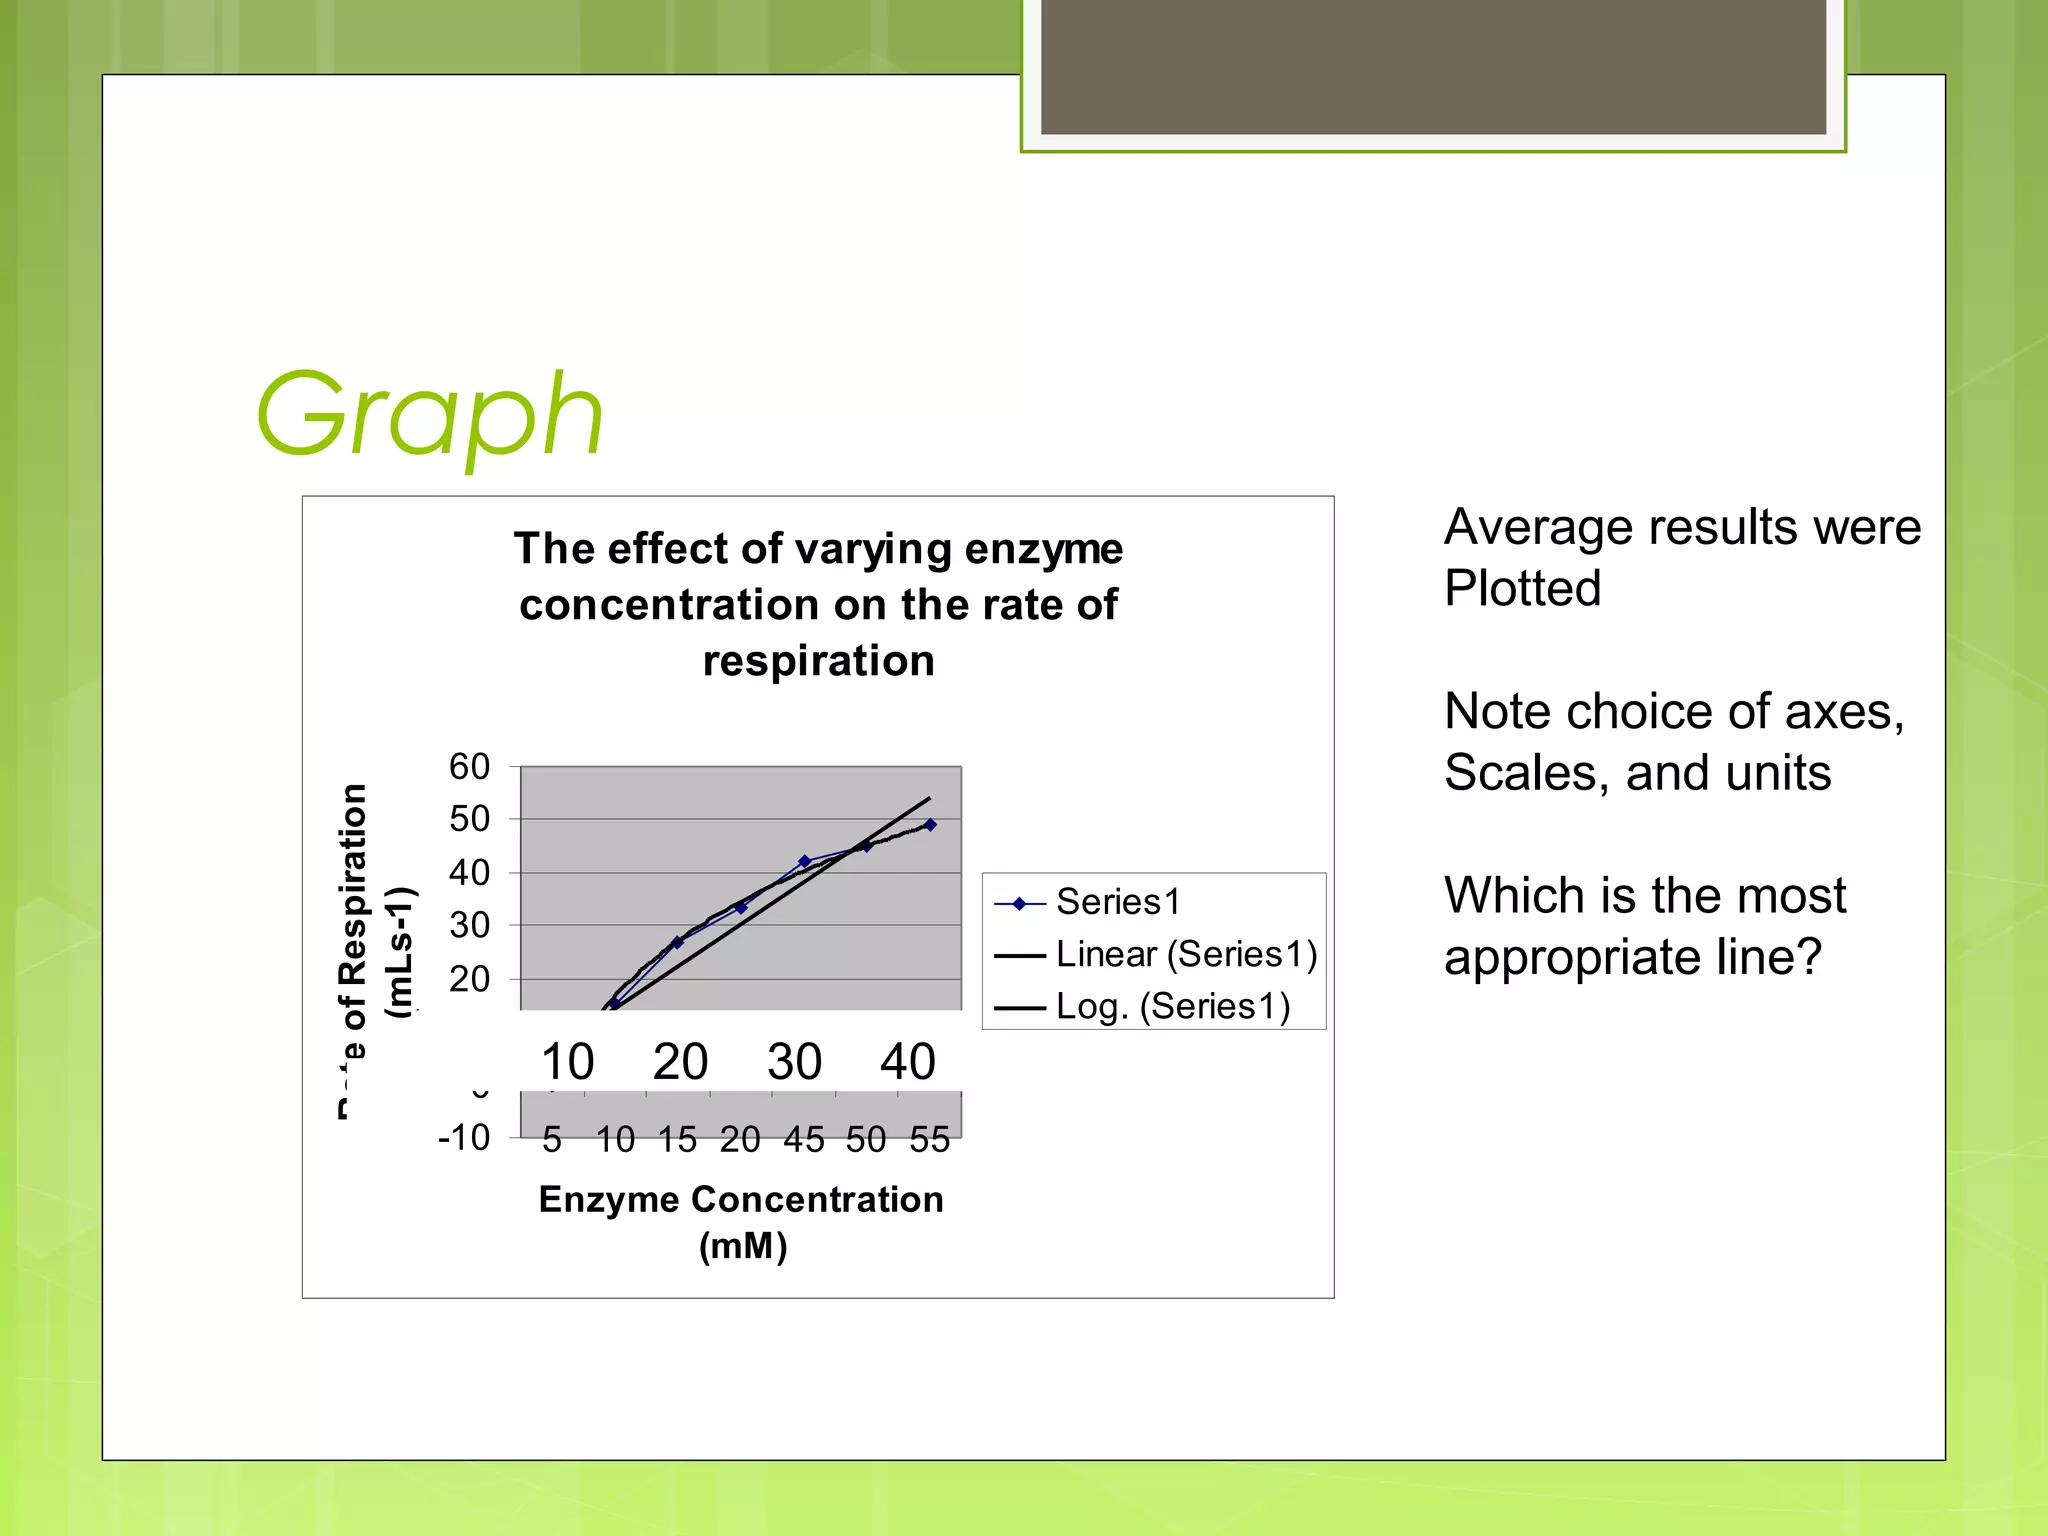
Graph
Rate of Respiration
(mLs-1)
Theeffect of varying enzyme
concentration on the rate of
respiration
60
50
40
30
20
10
0
-10
Series1
Linear (Series1)
Log. (Series1)
10
20
30
40
5 10 15 20 45 50 55
Enzyme Concentration
(mM)
Average results were
Plotted
Note choice of axes,
Scales, and units
Which is the most
appropriate line?
13.
Random Errors
Random errorsare caused by any factor
that randomly affects the measurement
variable
The amount of random error is indicated by
the amount of scatter in the data
An increase in sample size allows averages
to be calculated- this reduces the effect of
random errors
Measurements are never perfect- therefore
random errors are always present
e.g. inconsistent reading of scales/use of
timer
14.
Systematic Errors
Systematic errorsare present when measured
values consistently differ from their true value
Usually due to faulty apparatus/equipment or
experimental design
Tend to be consistent throughout practical so
an average does not rectify the problem.
However repeating experiment may identify a
systematic error (need to use other equipment)
Consistent results indicate the conclusion(s)
drawn are likely to be valid
Balance not calibrated, contaminant in a
solution
15.
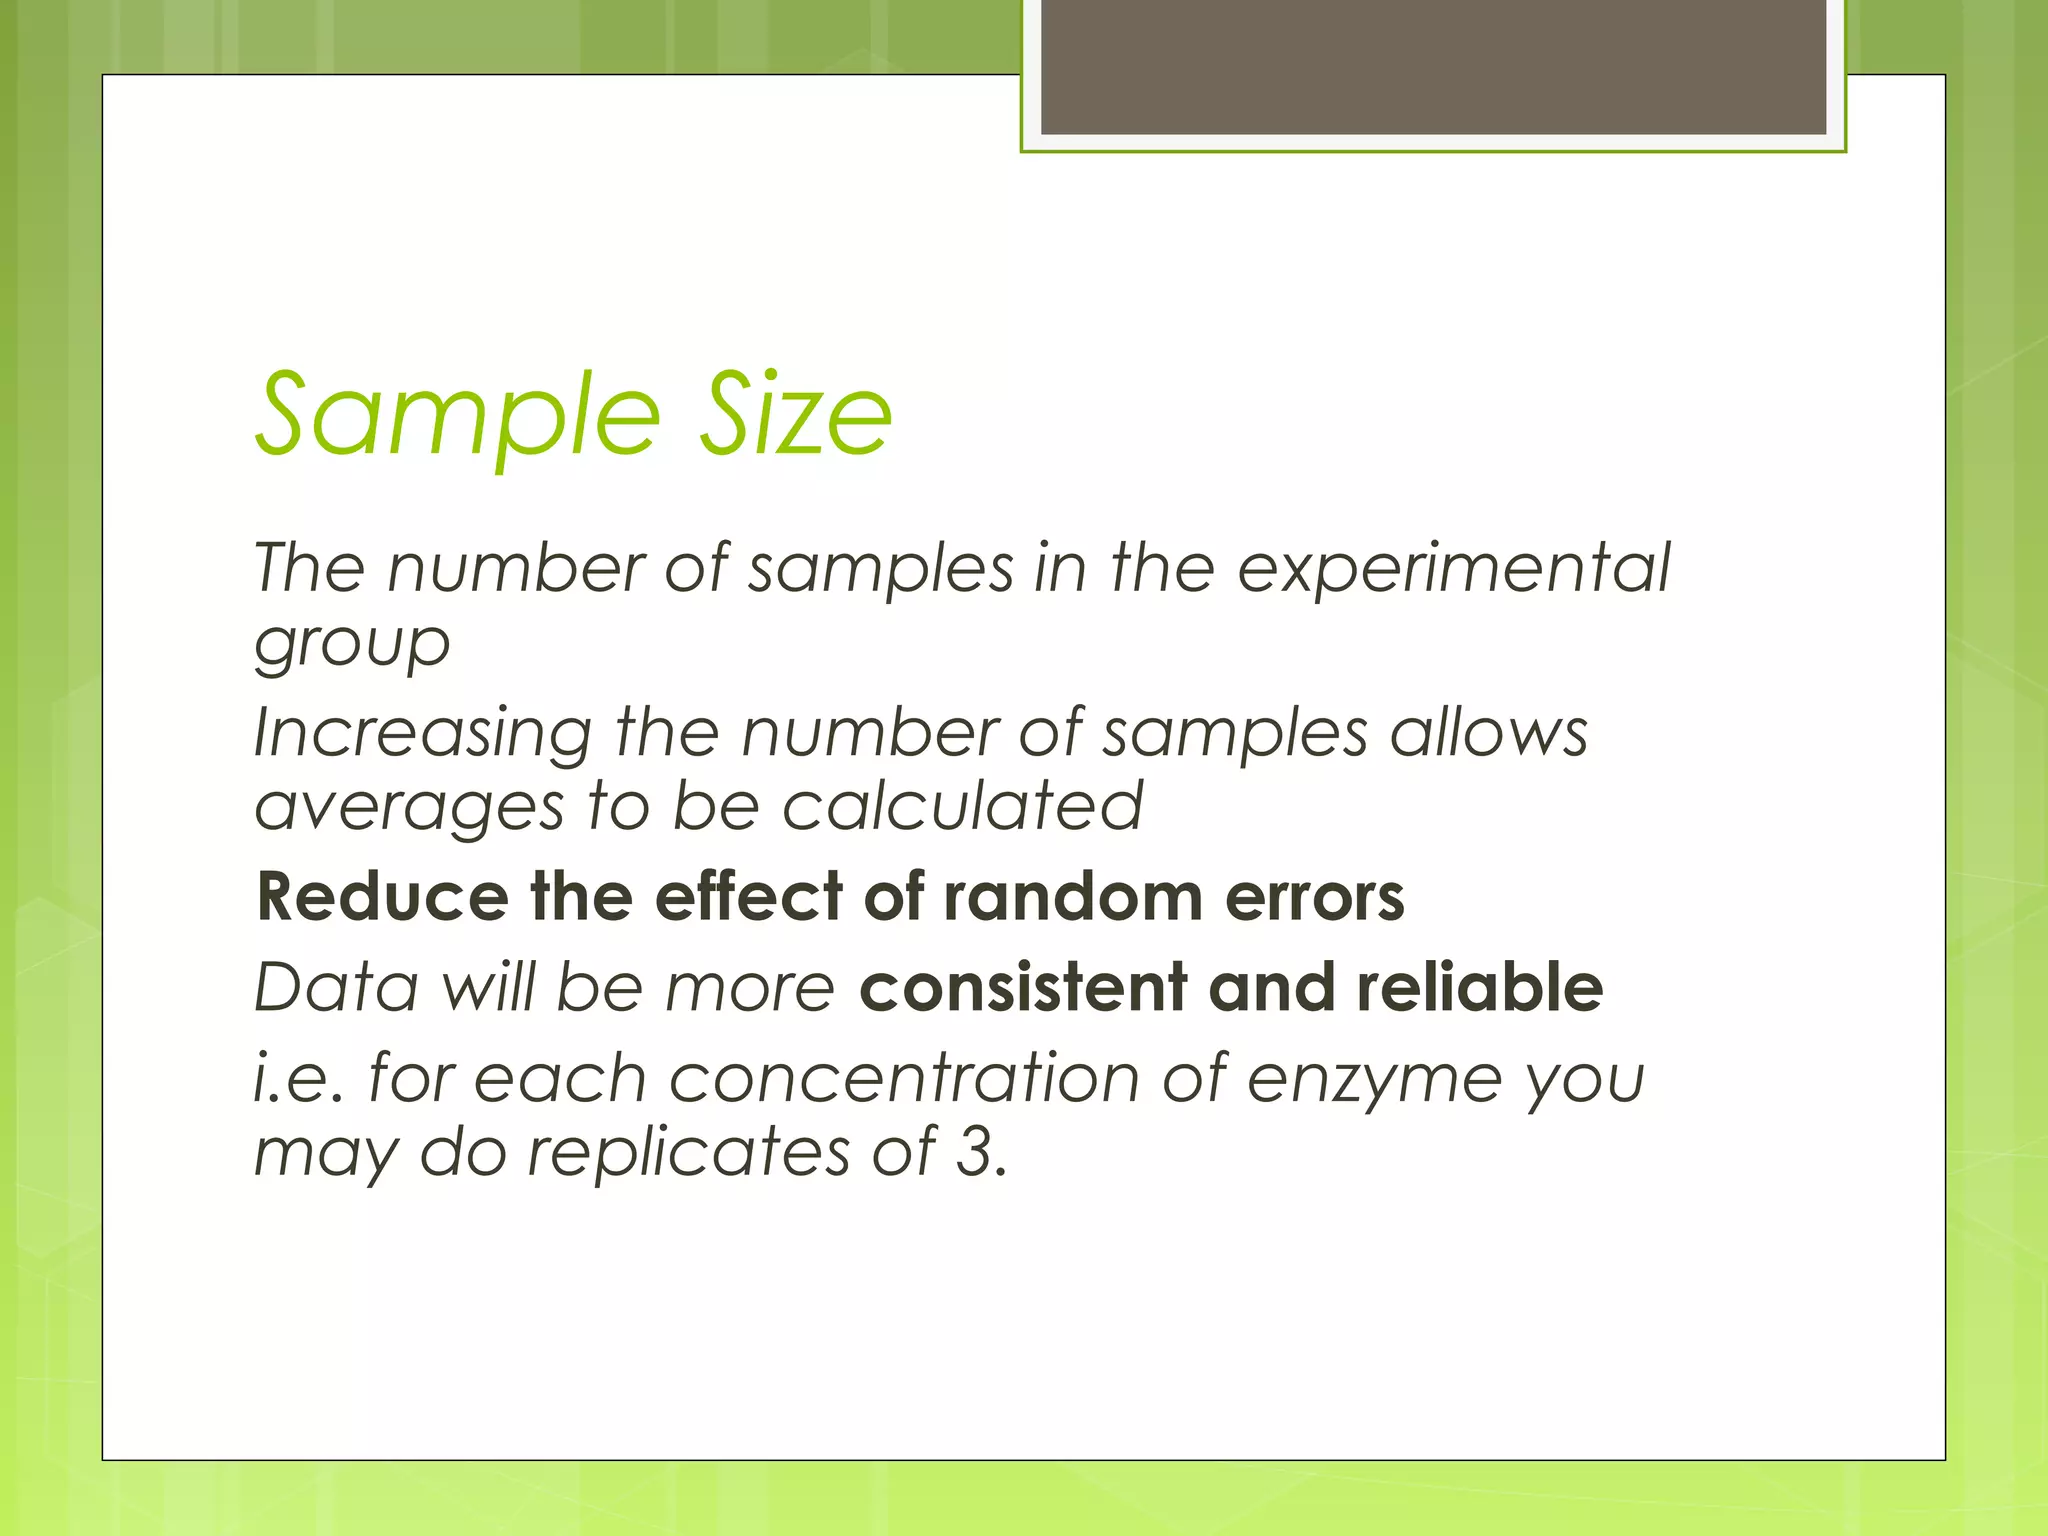
Sample Size
The numberof samples in the experimental
group
Increasing the number of samples allows
averages to be calculated
Reduce the effect of random errors
Data will be more consistent and reliable
i.e. for each concentration of enzyme you
may do replicates of 3.
16.
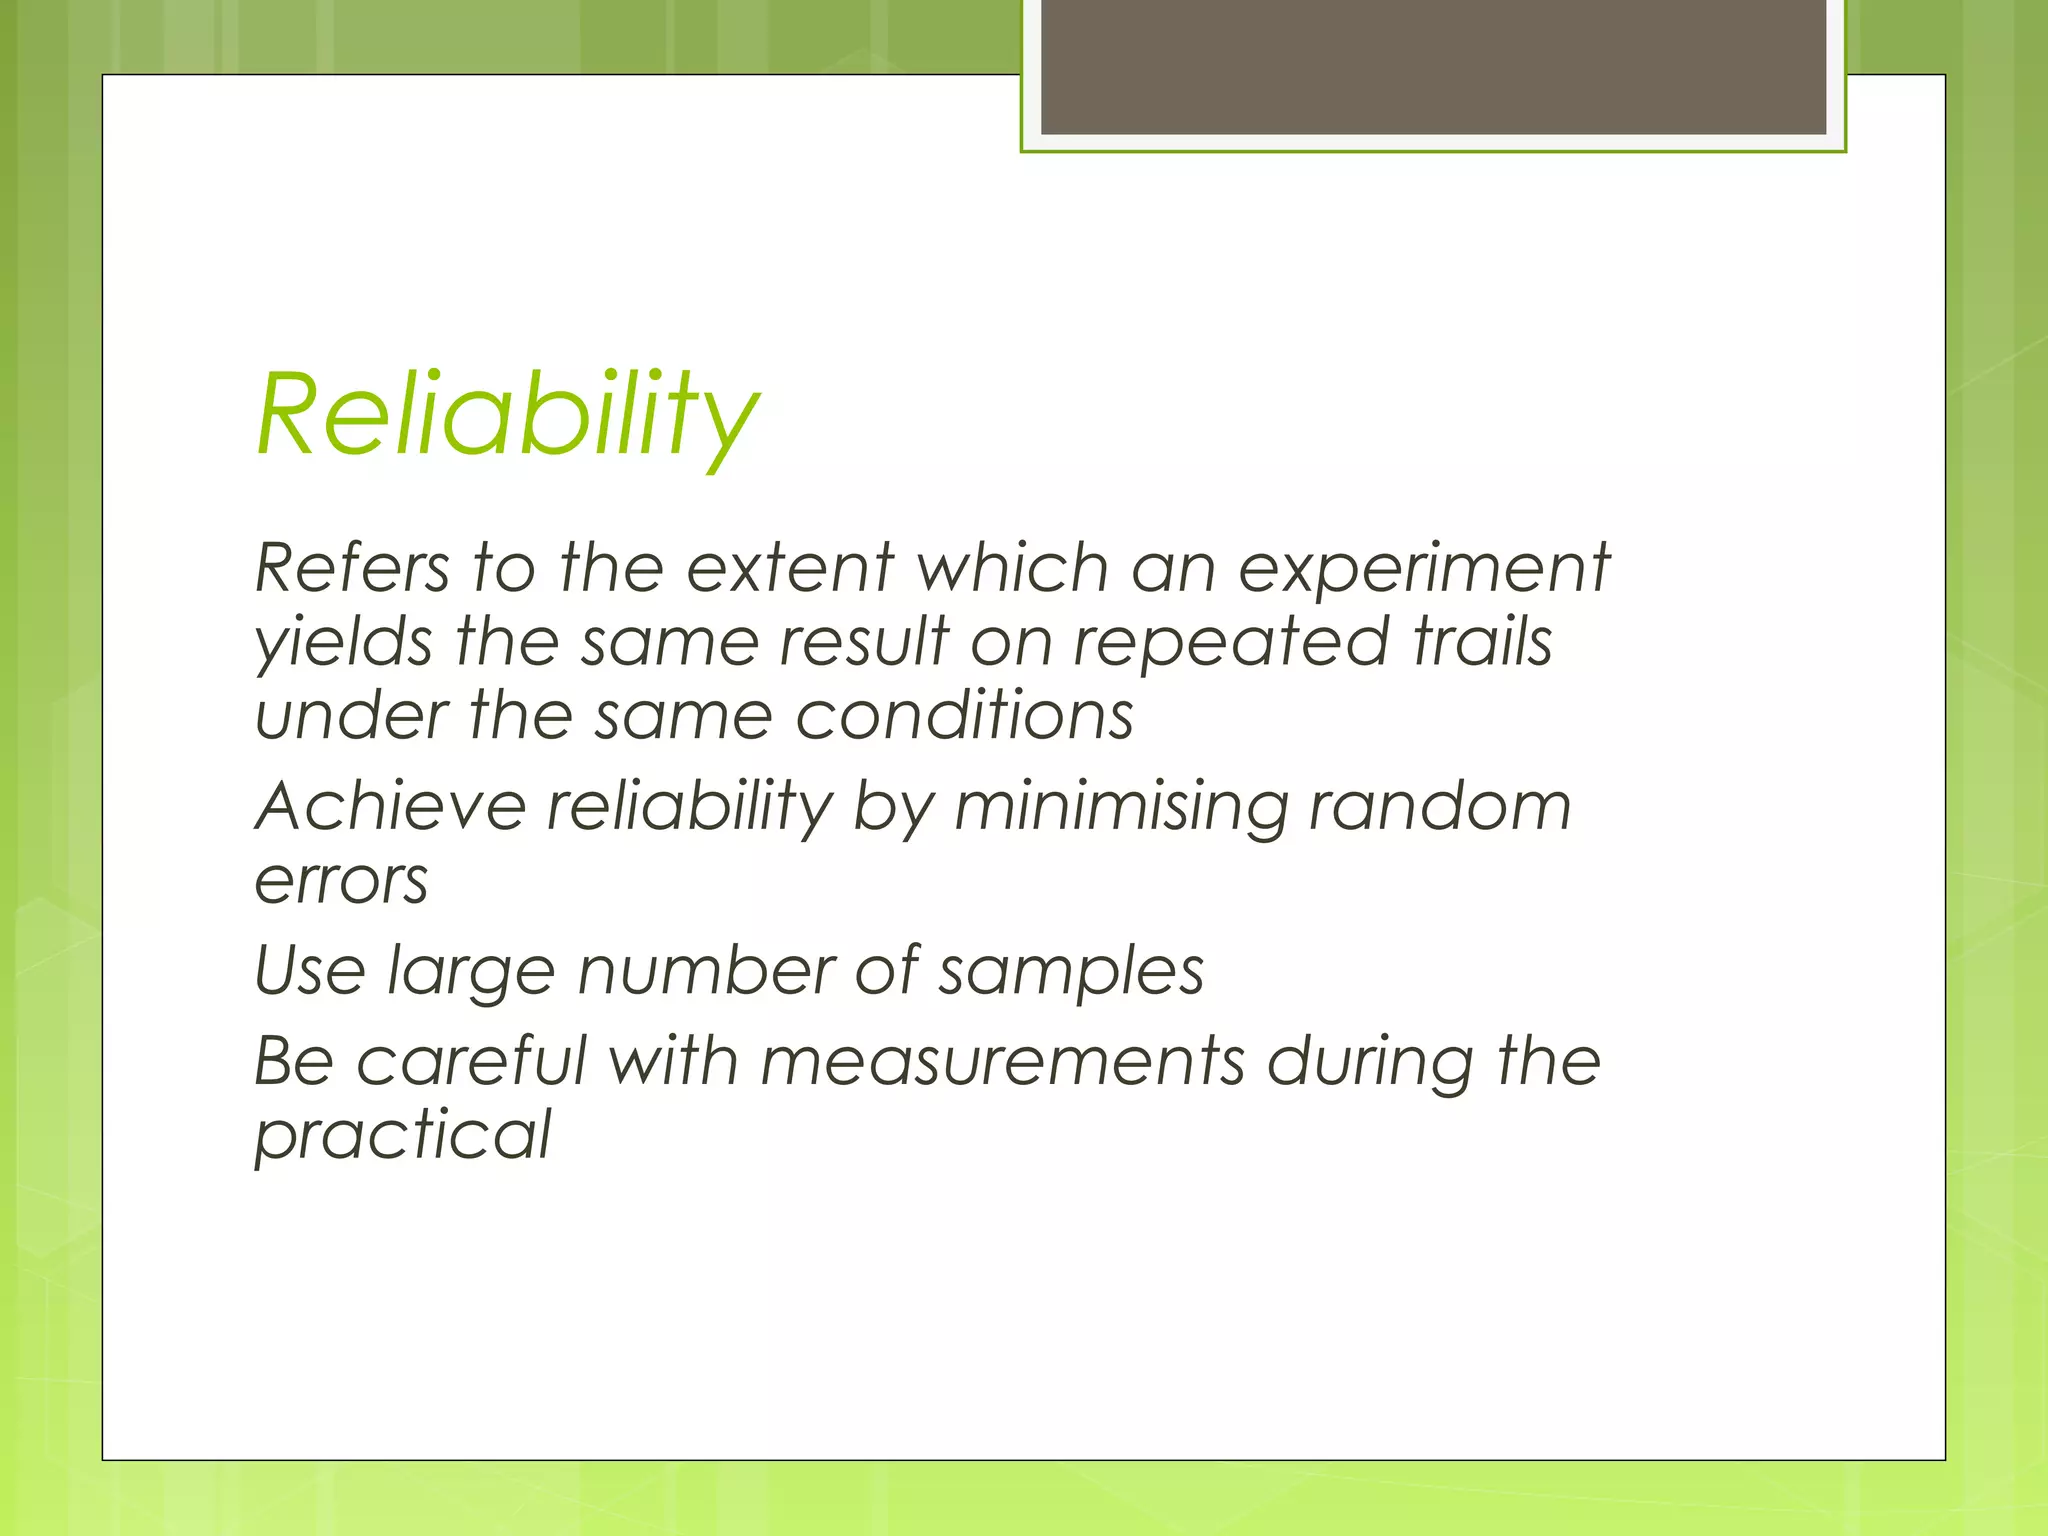
Reliability
Refers to theextent which an experiment
yields the same result on repeated trails
under the same conditions
Achieve reliability by minimising random
errors
Use large number of samples
Be careful with measurements during the
practical
17.
To repeat ornot to repeat?
Repeating the experiment with same
procedure and apparatus at different
times helps to identify systematic errors
Repeat experiment to validate the
results, experimental design and be
confident in our conclusions
Useful to repeat with different
equipment, solutions etc… Are the results
still the same?
18.
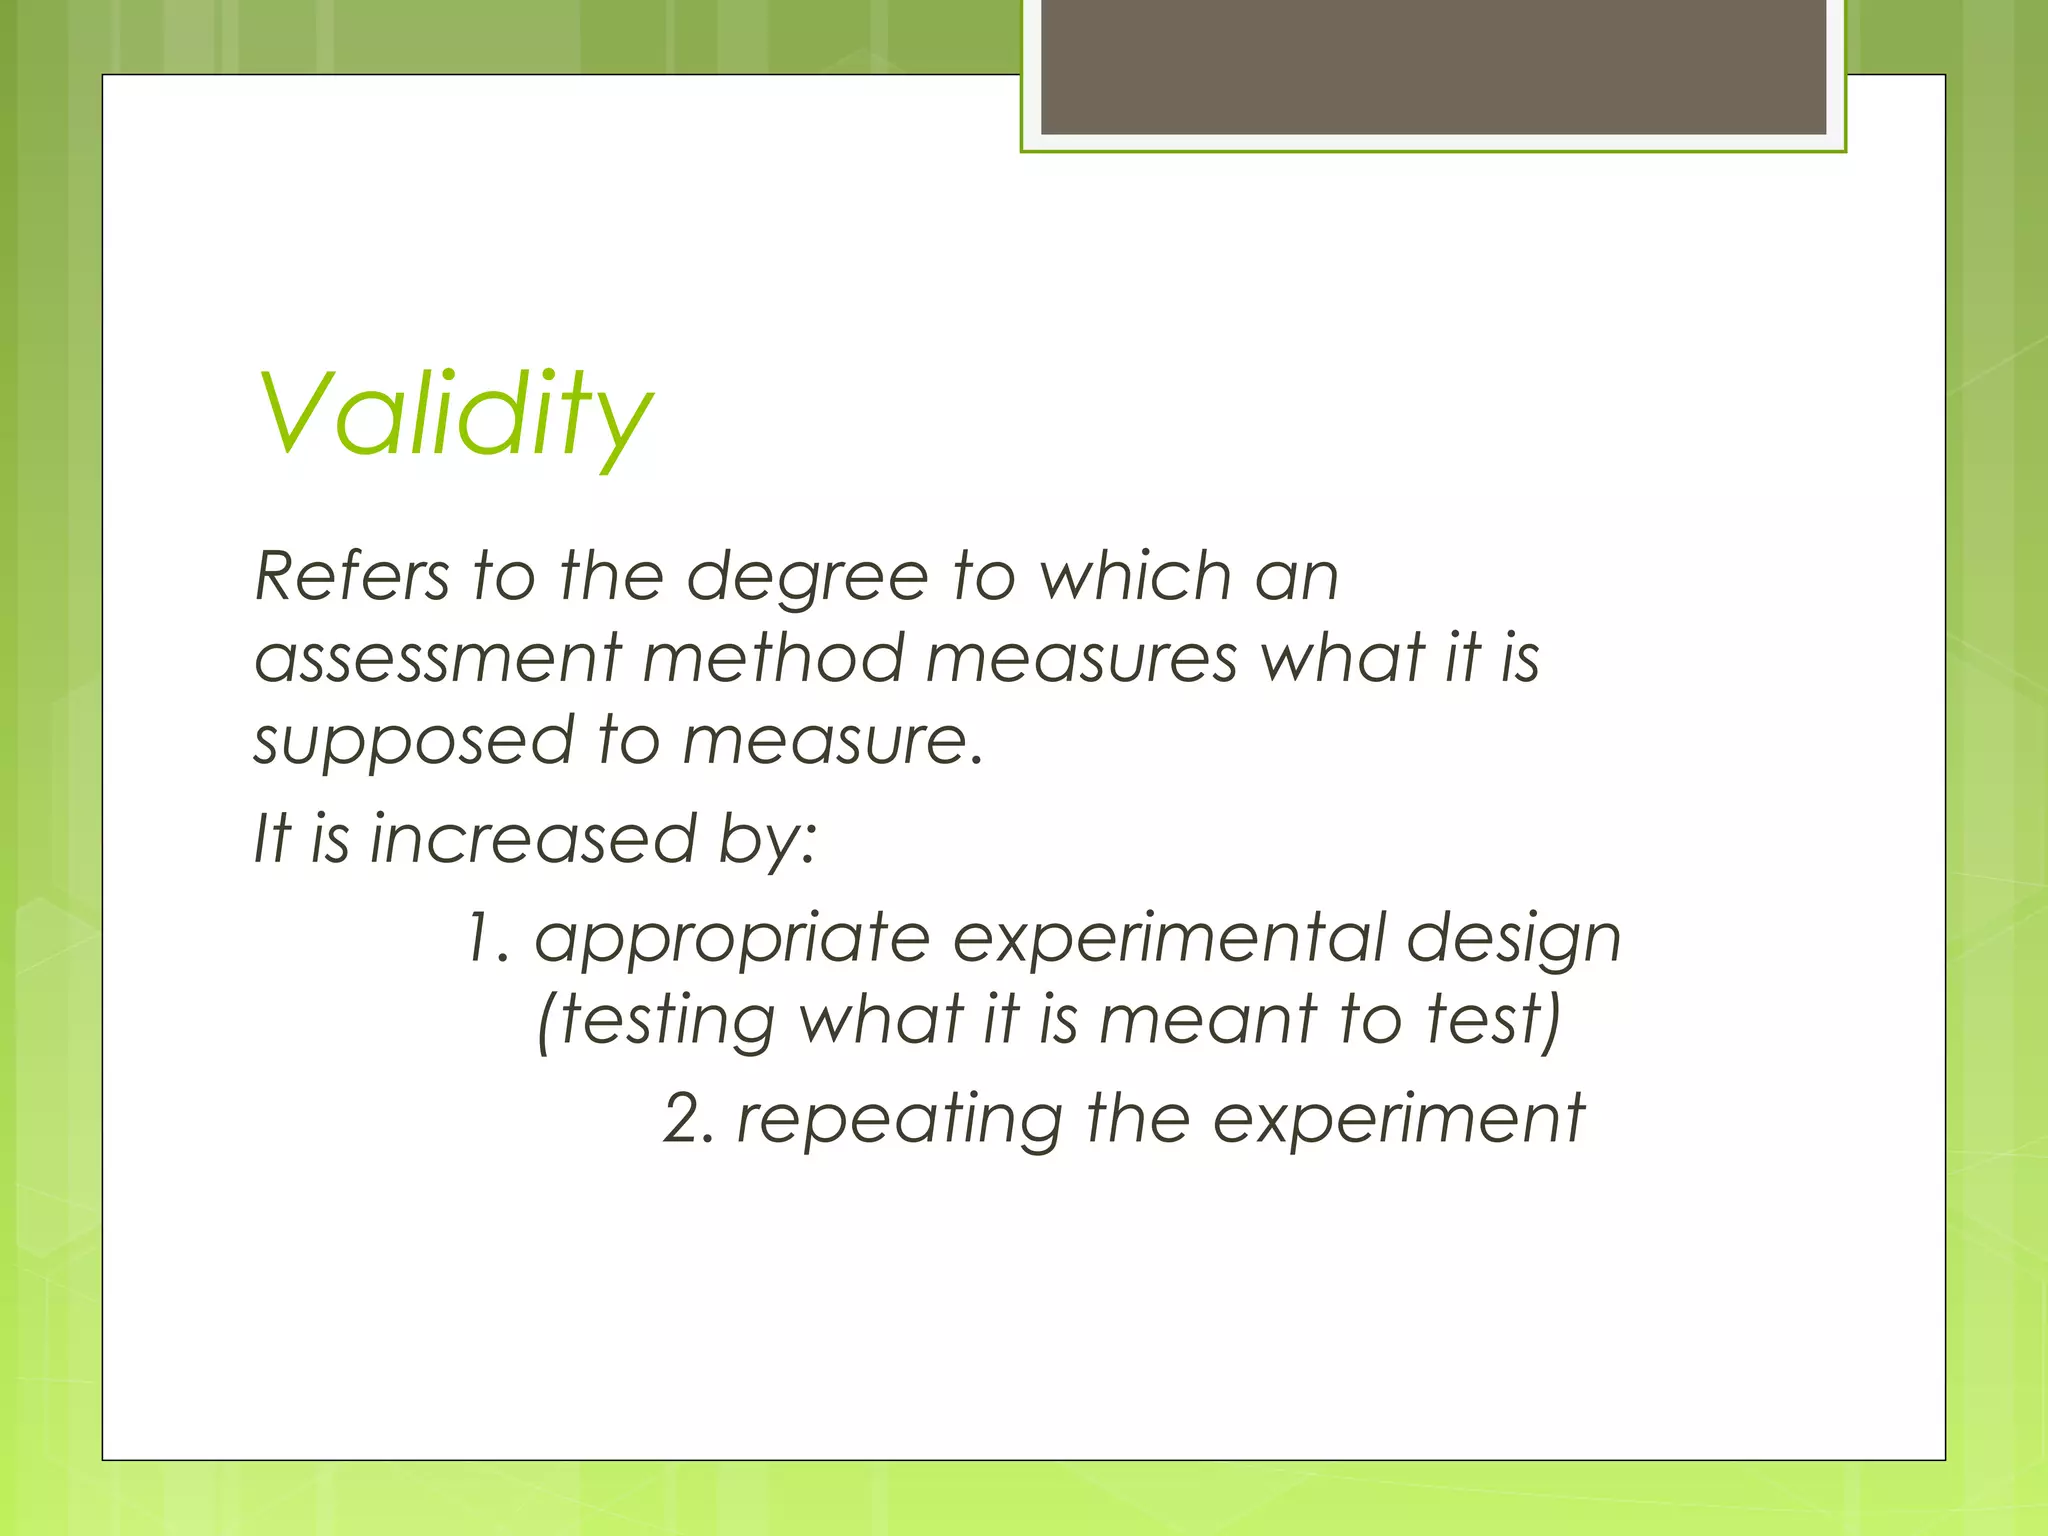
Validity
Refers to thedegree to which an
assessment method measures what it is
supposed to measure.
It is increased by:
1. appropriate experimental design
(testing what it is meant to test)
2. repeating the experiment
19.
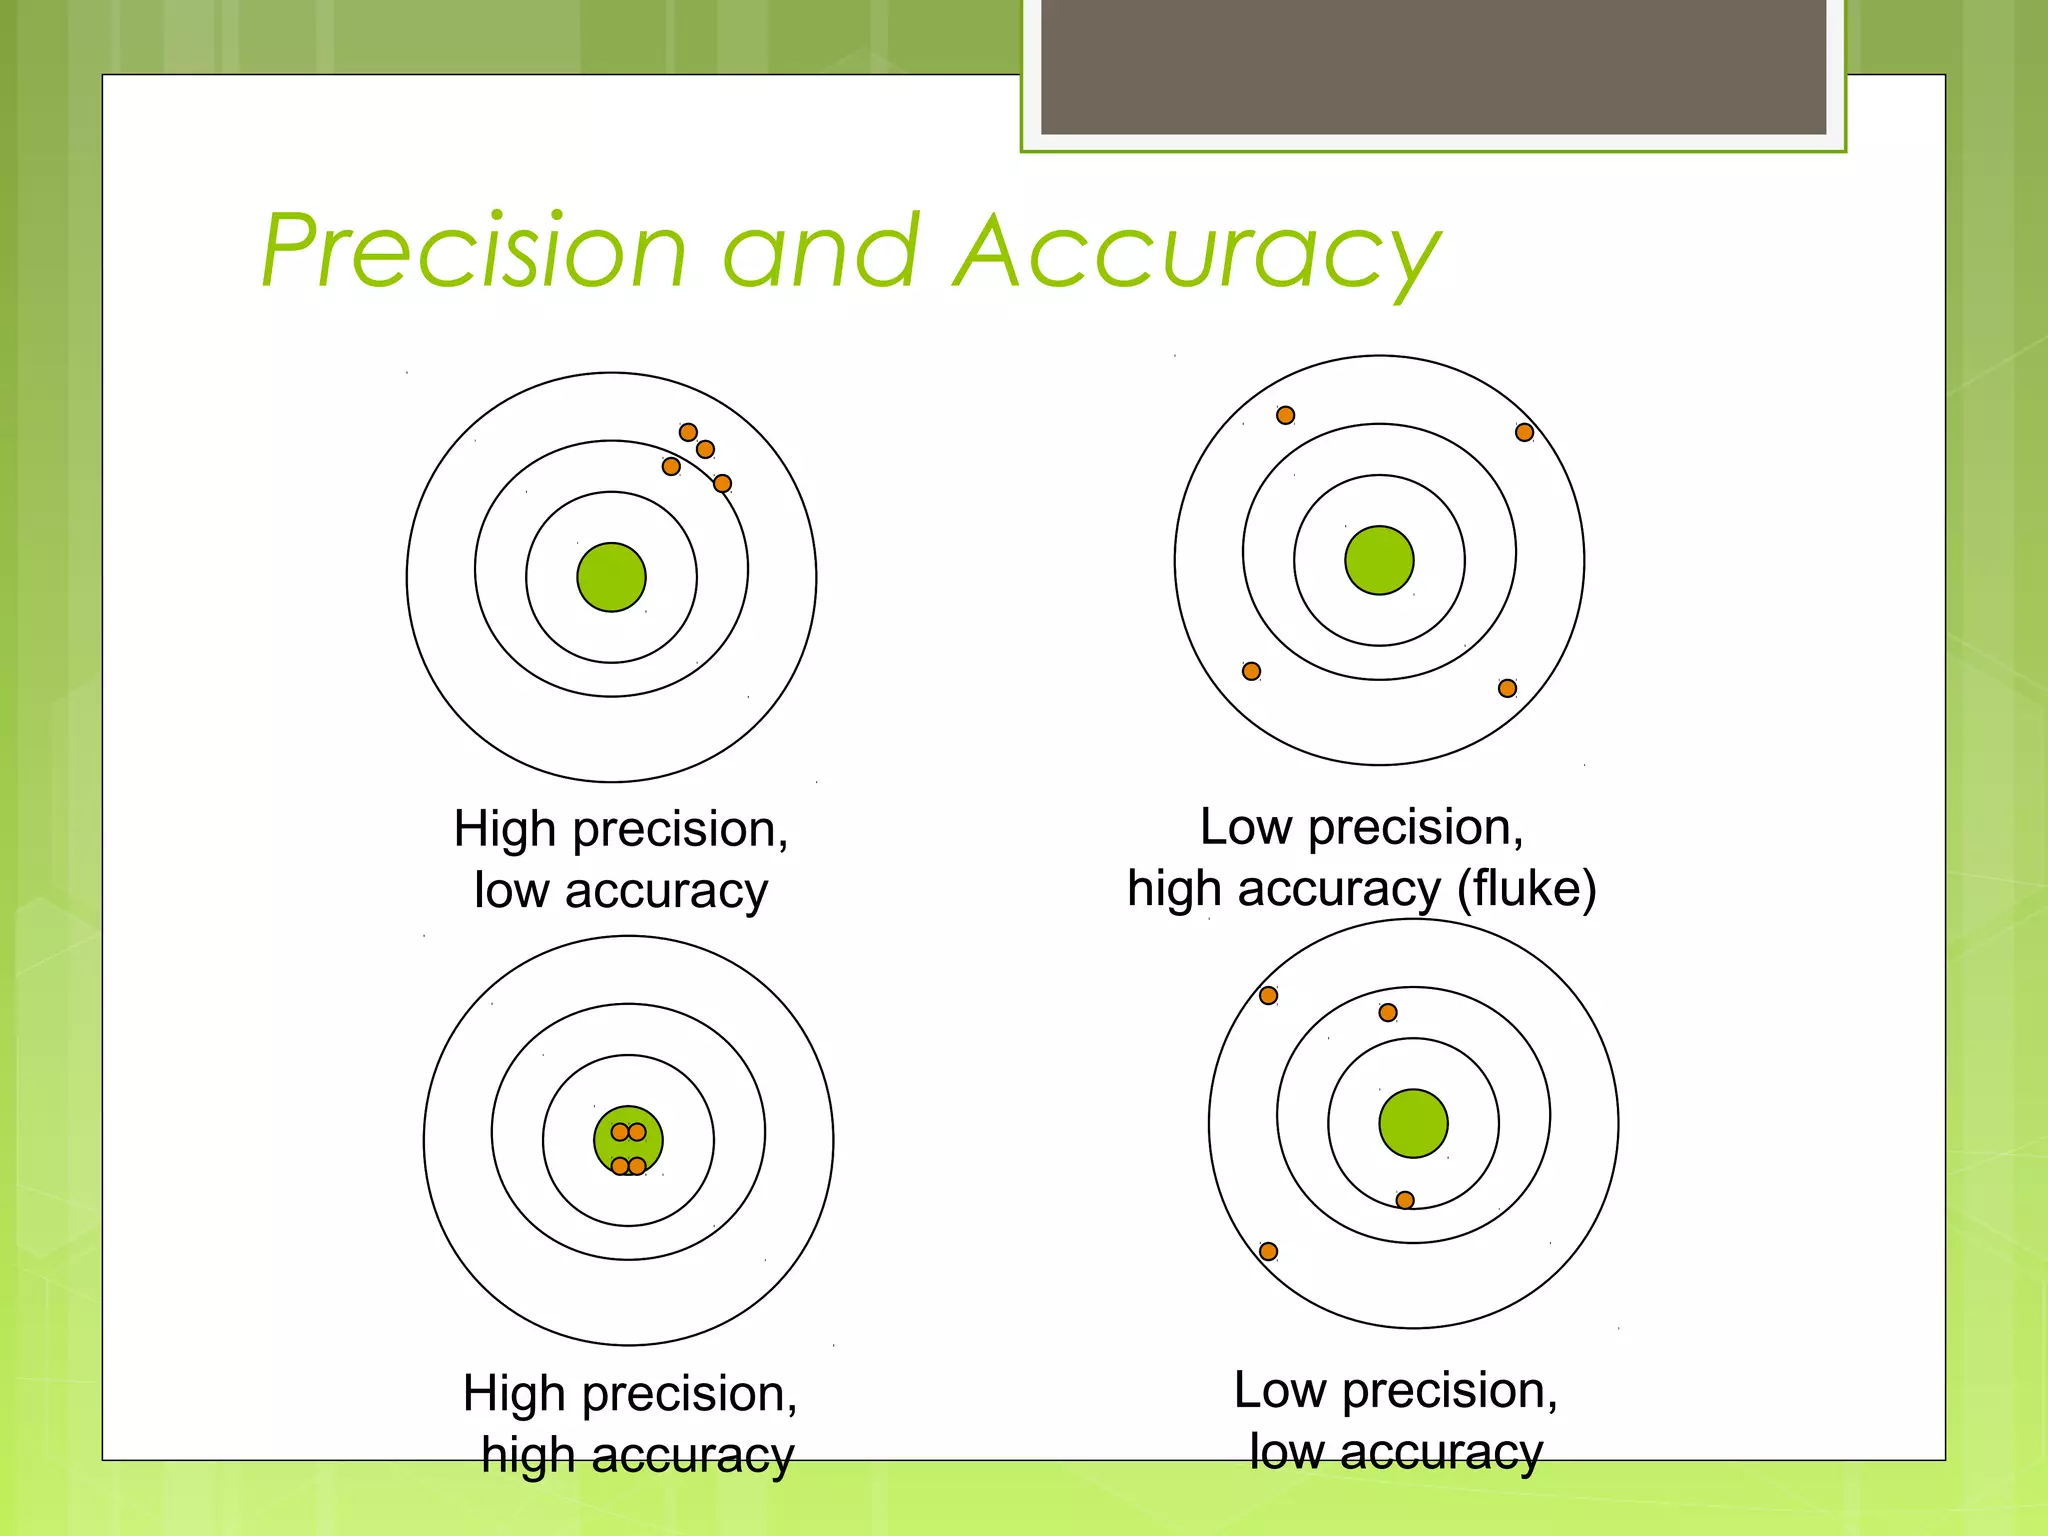
Precision and Accuracy
Highprecision,
low accuracy
High precision,
high accuracy
Low precision,
high accuracy (fluke)
Low precision,
low accuracy
20.
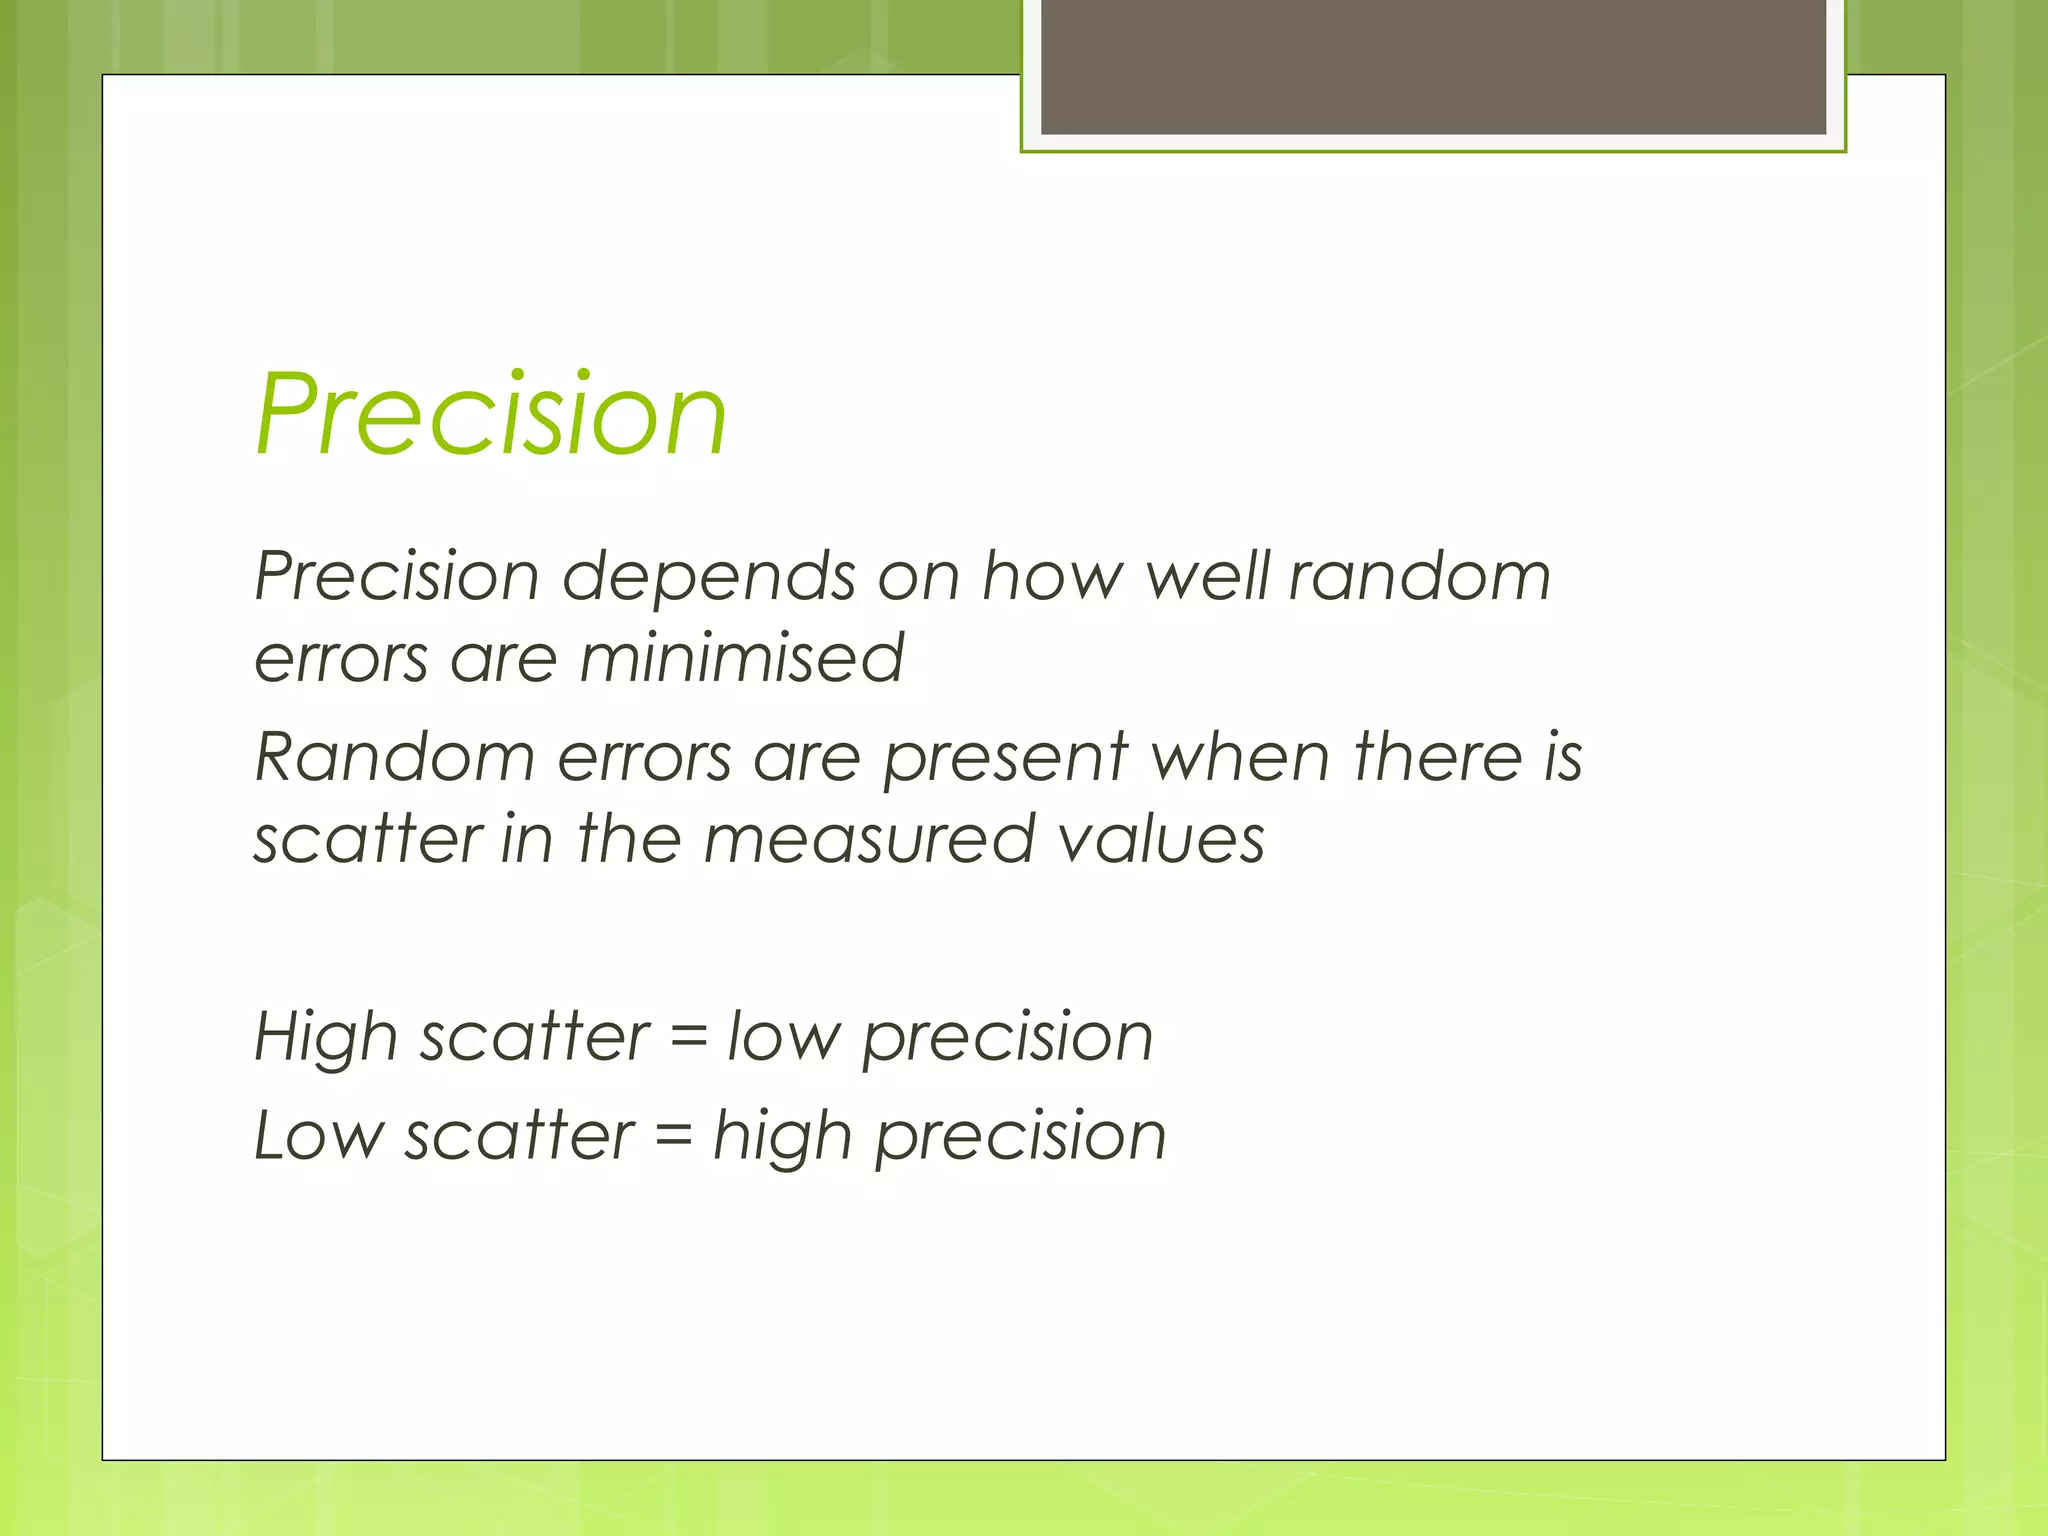
Precision
Precision depends onhow well random
errors are minimised
Random errors are present when there is
scatter in the measured values
High scatter = low precision
Low scatter = high precision
21.
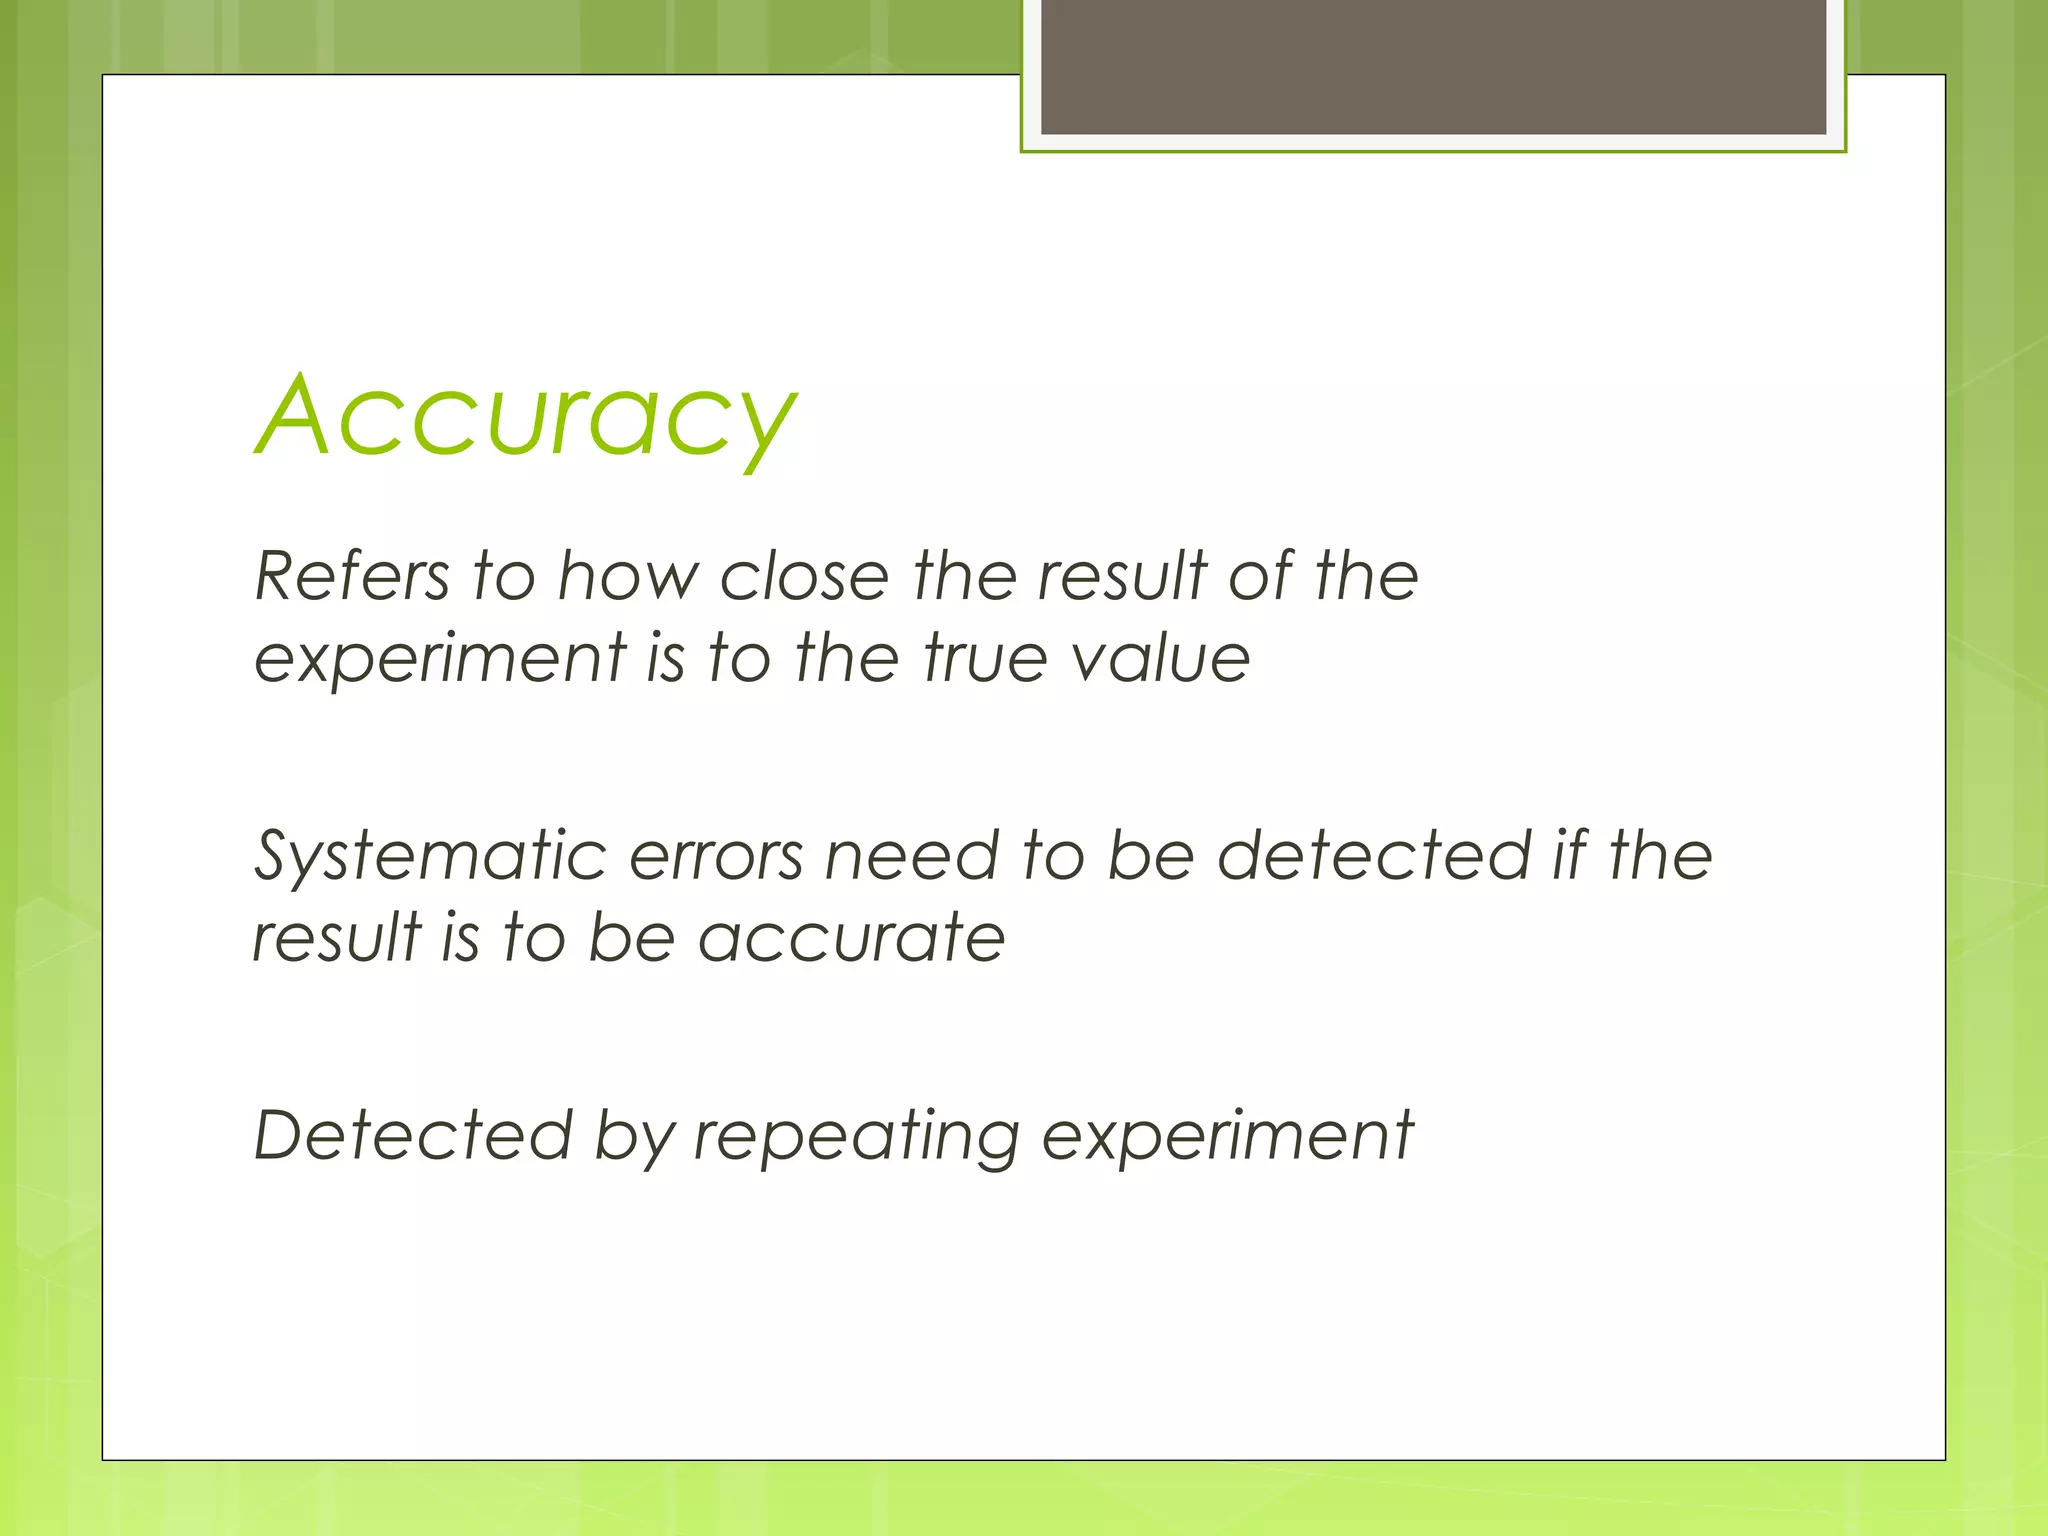
Accuracy
Refers to howclose the result of the
experiment is to the true value
Systematic errors need to be detected if the
result is to be accurate
Detected by repeating experiment
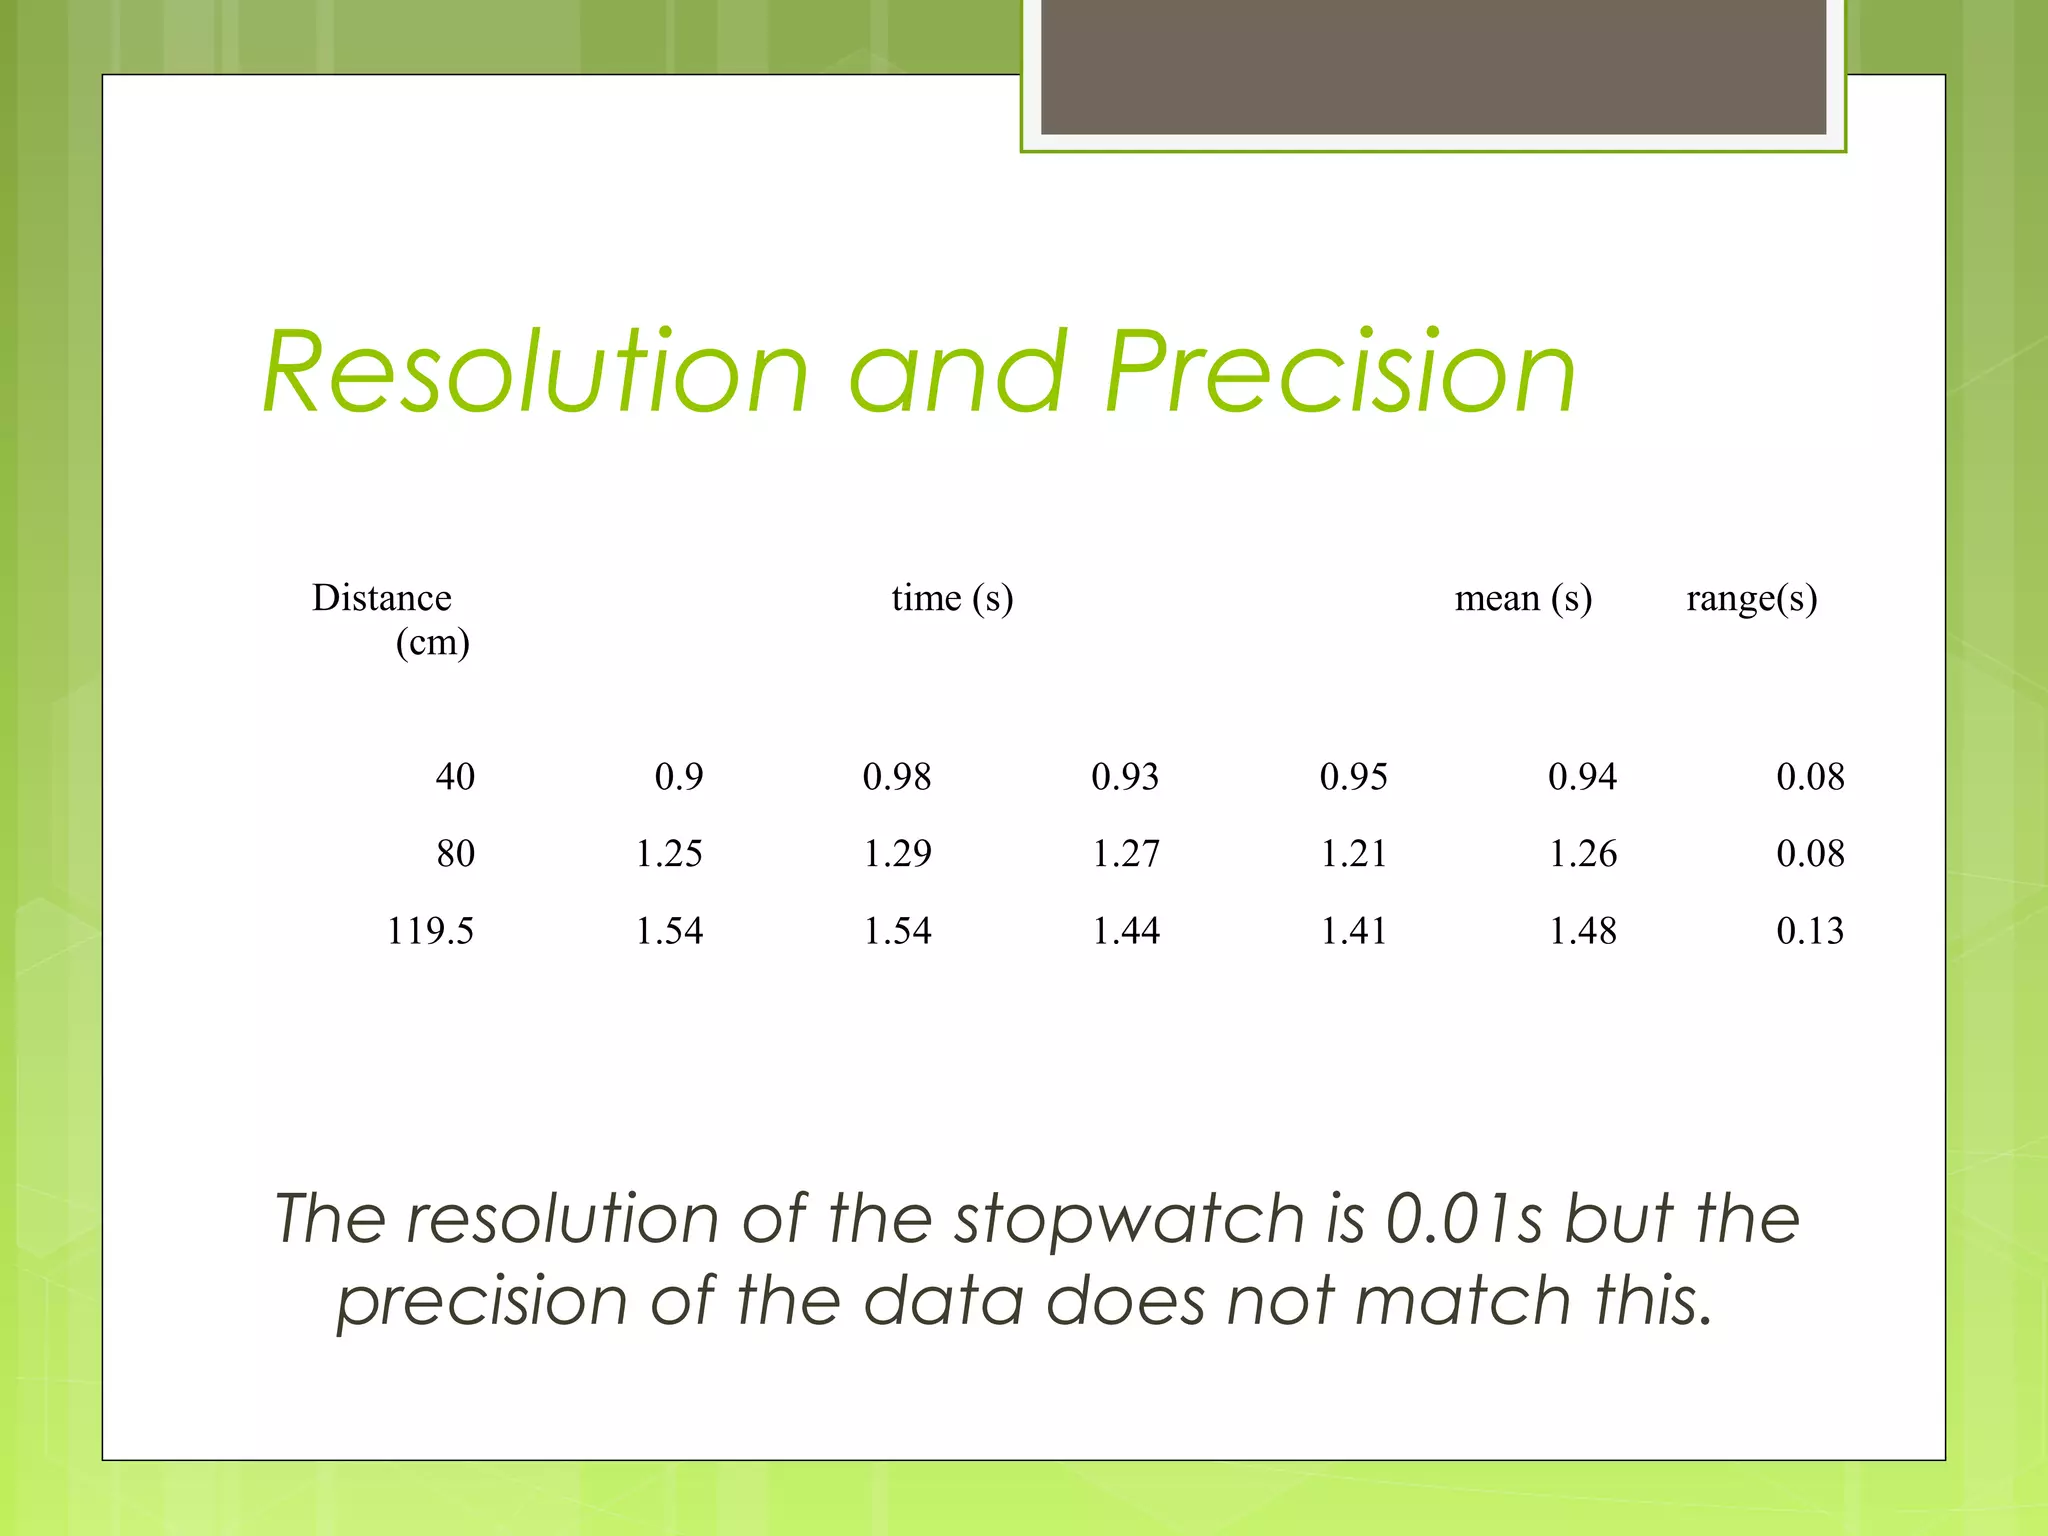
Resolution and Precision
Distance
(cm)
time(s)
mean (s)
range(s)
40
0.9
0.98
0.93
0.95
0.94
0.08
80
1.25
1.29
1.27
1.21
1.26
0.08
119.5
1.54
1.54
1.44
1.41
1.48
0.13
The resolution of the stopwatch is 0.01s but the
precision of the data does not match this.
24.
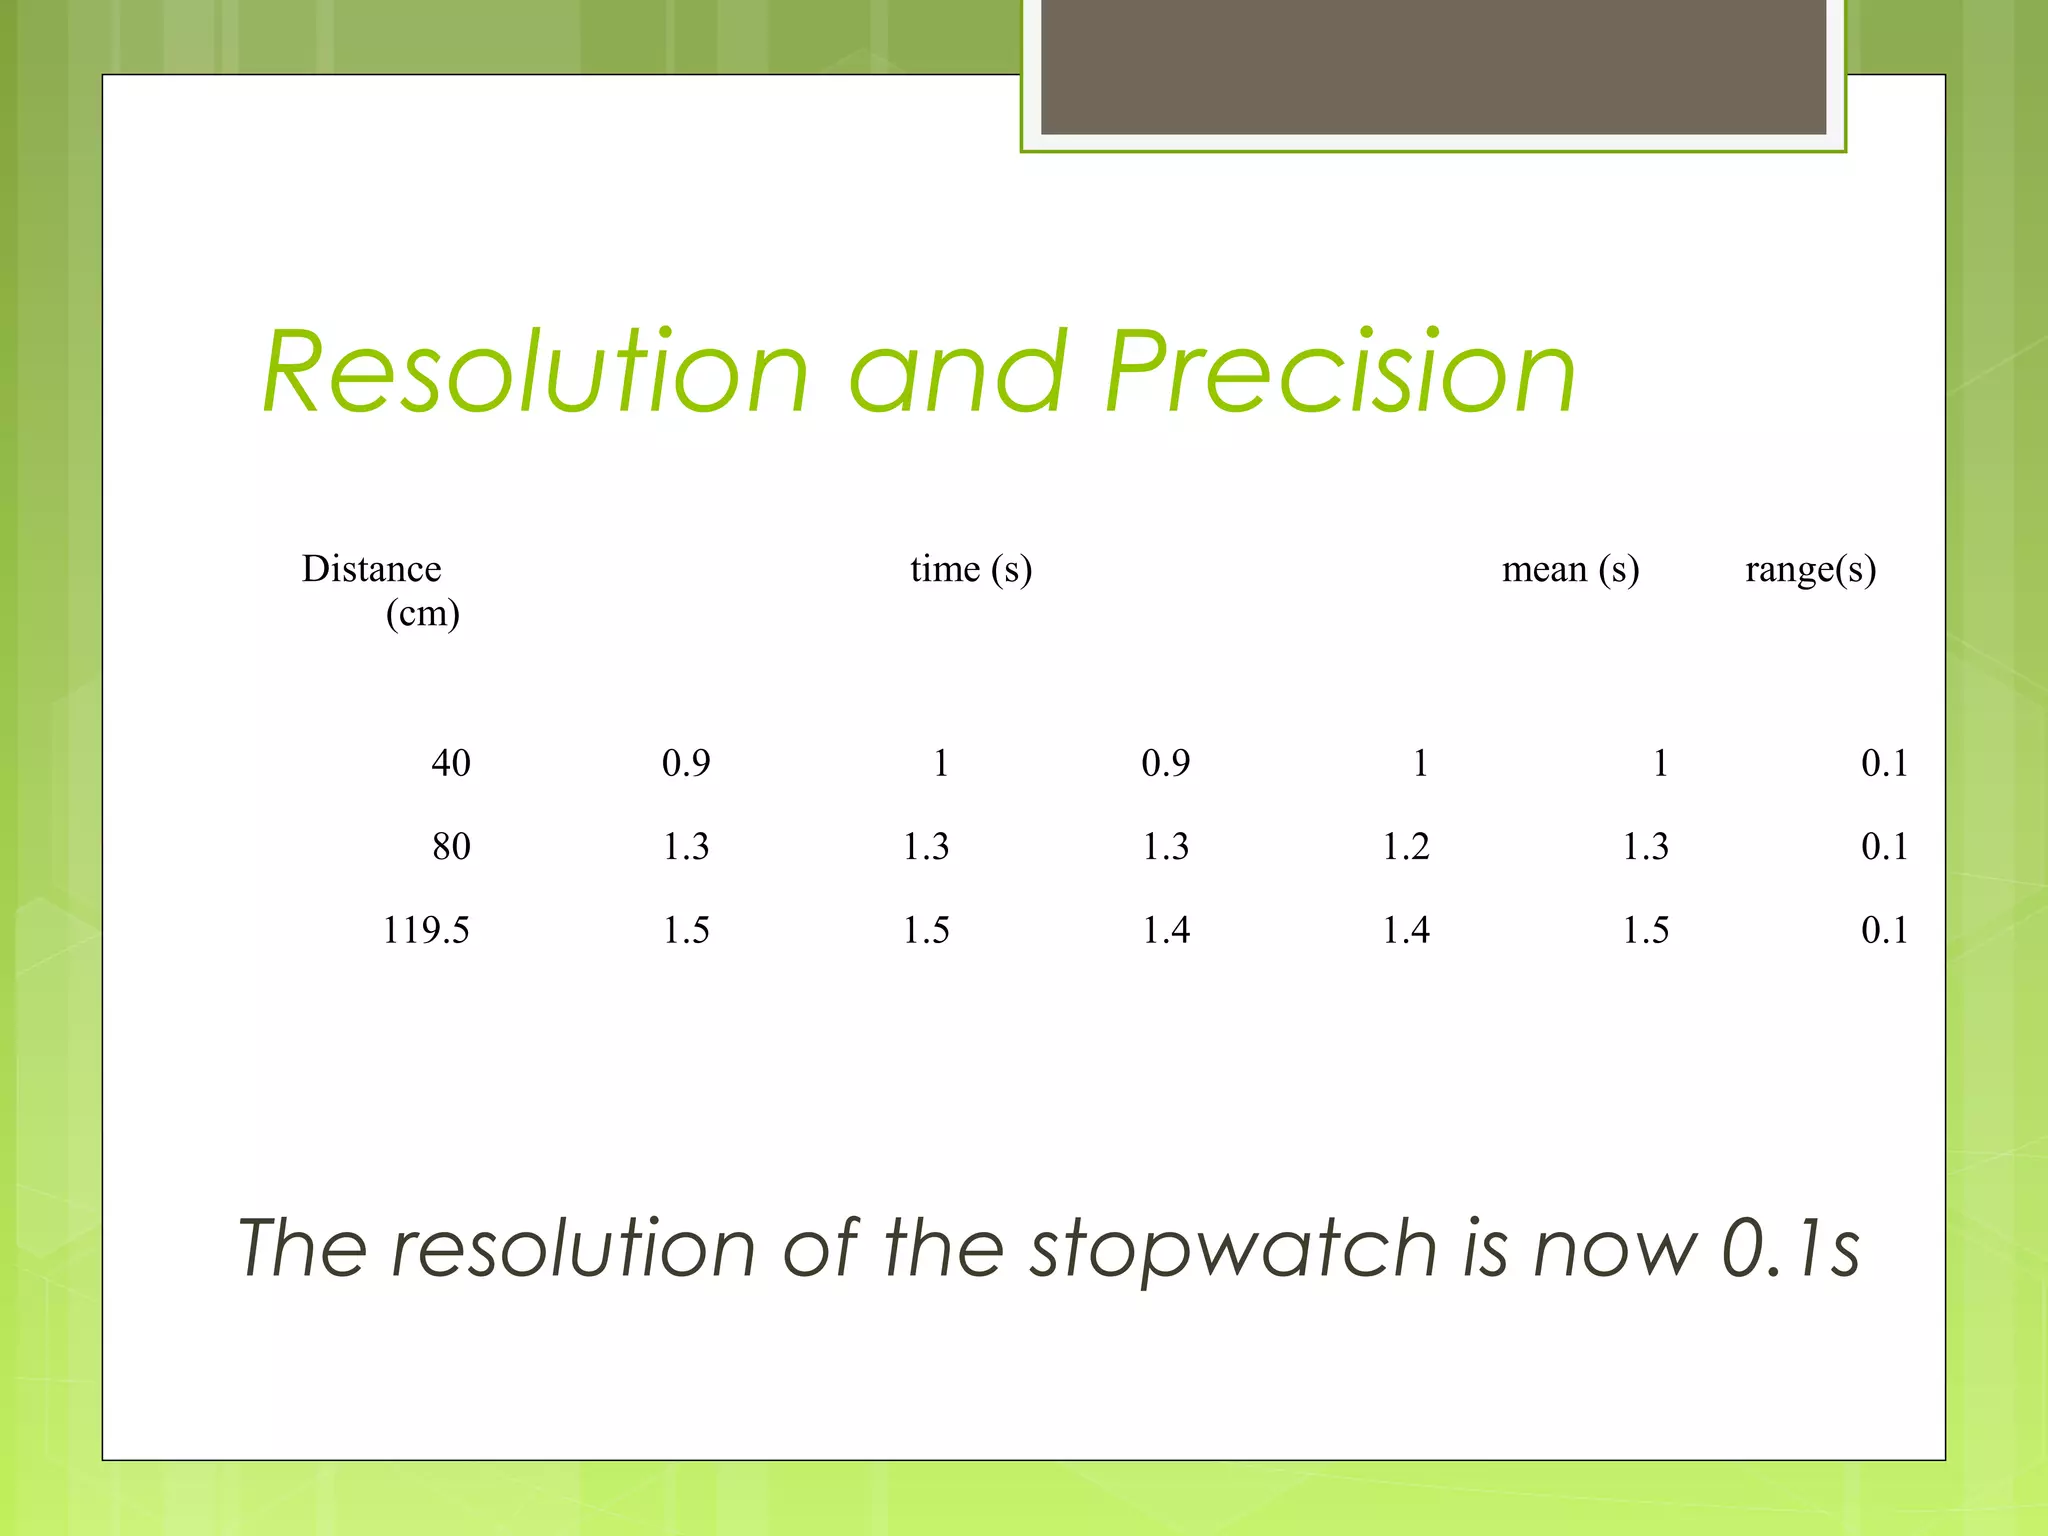
Resolution and Precision
Distance
(cm)
time(s)
mean (s)
range(s)
40
0.9
1
0.9
1
1
0.1
80
1.3
1.3
1.3
1.2
1.3
0.1
119.5
1.5
1.5
1.4
1.4
1.5
0.1
The resolution of the stopwatch is now 0.1s
25.
Interpretation of Data
(Discussion)
Writtenin the third person (stated
objectively)
Inferences can be made when interpreting
the data
An inference is a reasoning based on
observation and experience. To infer is to
arrive at a decision or opinion by reasoning
from known facts
e.g. “an increase in enzyme concentration
influenced the rate of respiration as more
enzyme was available for the reaction.”
26.
Analysis and Evaluationof the
Experiment
Identify sources and distinguish between
random and systematic errors
List ways to improve procedures of the
experiment (possibly give reasons why)
Comment on suitability and importance
of the sample size
Comment on the accuracy and
precision of the experiment
Comment on the value of repeating the
experiment
27.
Conclusion
A brief statementthat relates to the hypothesis
Should be written at the end of each
experiment
Supports or refutes the hypothesis
Experiments do not prove the hypothesis
Confidence in the conclusions will depend on
the validity (design) of your experiment and the
care in execution.
e.g. “this experiment indicates that enzyme
concentration does have an affect on the rate
of respiration” or “no conclusion can be drawn
from tis experiment due to the large number of
uncontrolled factors”
28.
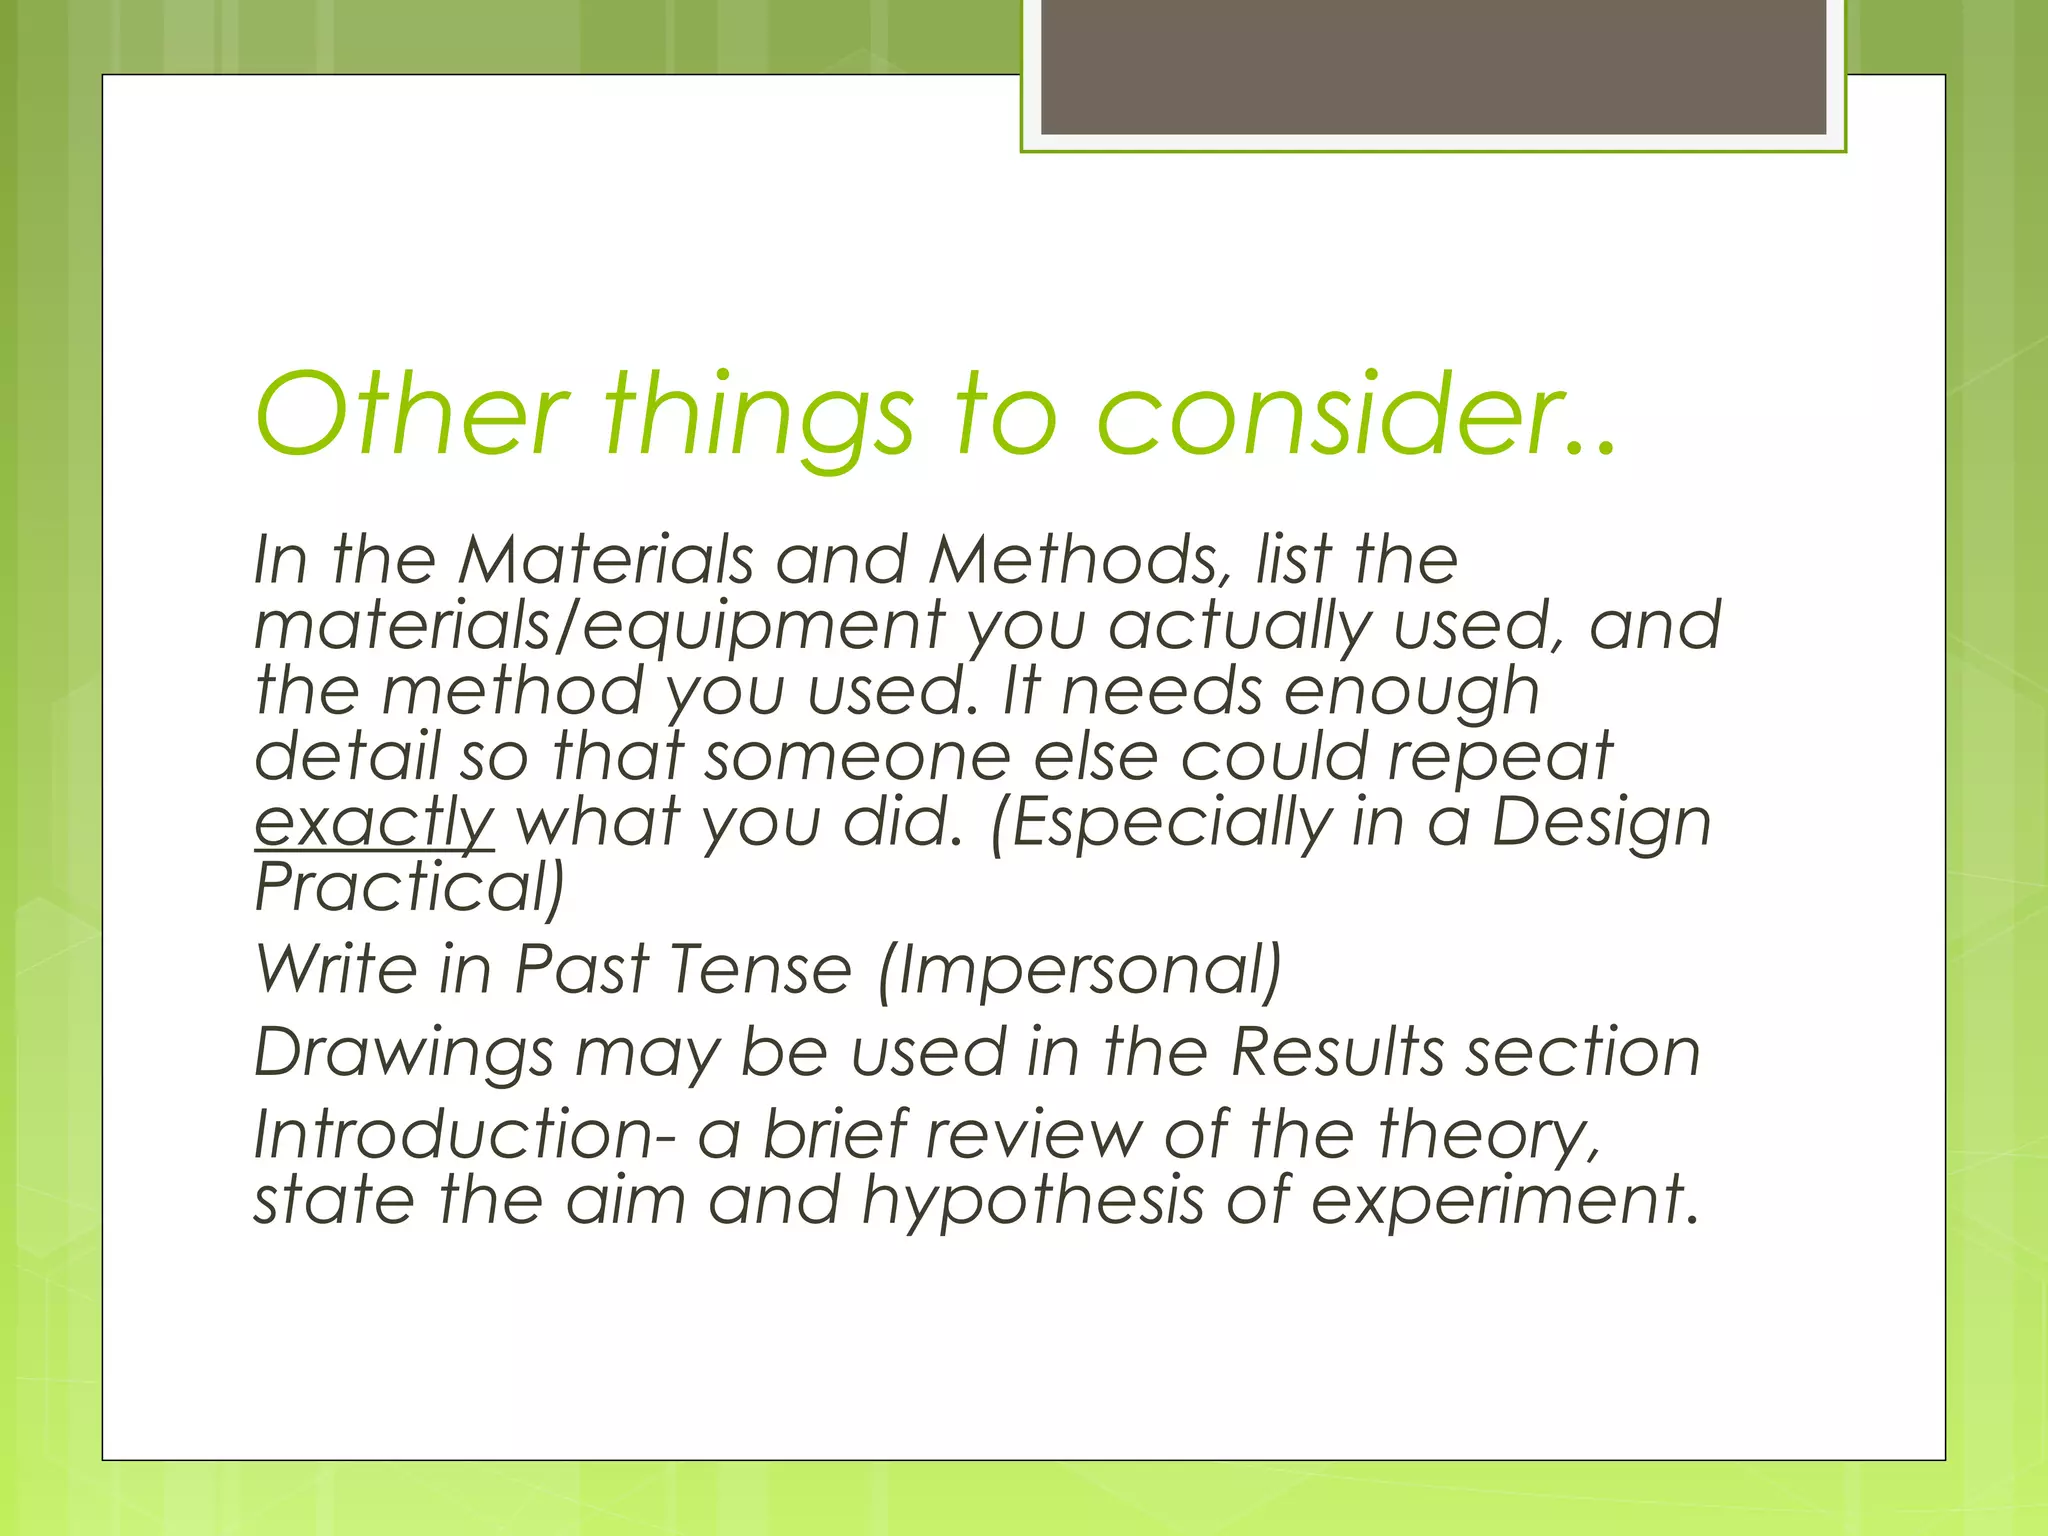
Other things toconsider..
In the Materials and Methods, list the
materials/equipment you actually used, and
the method you used. It needs enough
detail so that someone else could repeat
exactly what you did. (Especially in a Design
Practical)
Write in Past Tense (Impersonal)
Drawings may be used in the Results section
Introduction- a brief review of the theory,
state the aim and hypothesis of experiment.