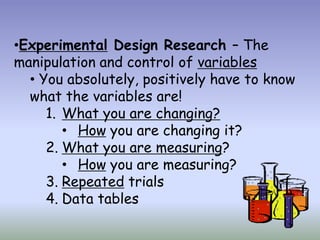
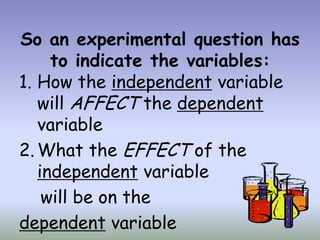
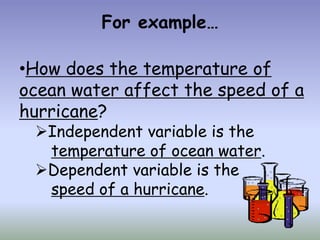
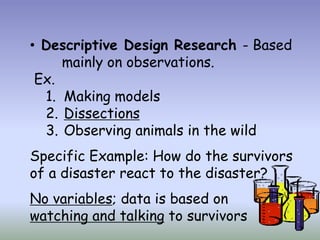
•Experimental Design Research – The
manipulation and control of variables
  • You absolutely, positively have to know
  what the variables are!
     1. What you are changing?
        • How you are changing it?
     2. What you are measuring?
        • How you are measuring?
     3. Repeated trials
     4. Data tables
So an experimental question has
     to indicate the variables:
1. How the independent variable
   will AFFECT the dependent
   variable
2. What the EFFECT of the
   independent variable
    will be on the
dependent variable
For example…

•How does the temperature of
ocean water affect the speed of a
hurricane?
 Independent variable is the
  temperature of ocean water.
 Dependent variable is the
  speed of a hurricane.
• Descriptive Design Research - Based
     mainly on observations.
 Ex.
  1. Making models
  2. Dissections
  3. Observing animals in the wild
Specific Example: How do the survivors
of a disaster react to the disaster?
No variables; data is based on
watching and talking to survivors
•Good questions come from
careful observations.

•Questions beginning with
what, why, how and when are
very important in focusing
on an investigation.
•An observation is any
use of the senses to
gather information.
•Observations may be
direct or indirect.
•Direct observations are
   made using one of your
   senses such as sight or touch.


•Indirect observations are made by
using an instrument such as a
thermometer or a microscope.
•Observations usually lead to
inferences.
•An inference is a logical
interpretation based on
observations or prior
knowledge (schema).
•Example of an
observation: Shadows
can change in length.
•Example of an inference: The
length of an object’s shadow
depends on how near the object
is to the light source.
•Determine if the
following examples are
observations or
inferences.
•You do not have to write these in
your notes.
I turn on a fan.

The blades of the fan
are turning.
There is a whirring sound.
You feel a breeze.
The fan is pushing the
air around in the room.
•A hypothesis is a clear statement of
what you EXPECT the answer to your
question to be.
•Your hypothesis will represent your
best “educated guess” based on what
you have observed and what you
already know (schema).
•A hypothesis must be stated in an if-
then format.
A hypothesis is a special kind of
prediction.
   o What makes it so special???
• It’s a guess about the VARIABLES&
their relationship, in particular,

•How will the independent
variable affect the dependent
variable?
Here is an example of a
hypothesis:

If the researcher uses acid
rain to water plants, then
the plants’ growth will be
slower.
Do NOT use
 personal pronouns!!
Ithink that acid rain
causes plants to grow
    more slowly.
•Hypothesis
   − a statement that uses a few observations
   − an idea based on observations without experimental
       evidence
•Theory
   − uses many observations and has lots of experimental
        evidence
   − can be applied to unrelated facts and new relationships
   − flexible enough to be modified if new data/evidence is
   introduced
•Law
   − stands the test of time, often without change
   − experimentally confirmed over and over
   − can create true predictions for different situations
   − has uniformity and is universal
• You test your hypothesis
by doing an experiment.


• Make sure you are doing
an experiment and not a
demonstration!
•Experiment vs. Demonstration

•Though modeling a
volcano’s eruption
is an interesting
demonstration, it is
NOT an experiment.
•Figuring out how altitude
affects the boiling point of water
is an experiment.
A controlled experiment tests
only ONE factor.
• A controlled experiment has a
control group and one or more
experimental group.
• The control group and the
experimental groups are
EXACTLY the same except for
ONE factor.
• The factor that differs is
called the variable.
• Because the variable is the
only factor that differs,
scientists know that this factor
is responsible for the results of
the experiment.
•An independent variableis what
the scientist changes in the
experiment.


•A dependent variableis what
changes in the experiment as a
result of what the scientist does.
•While doing the experiment, be
sure to write down all of the
observations that you make.
•Include any type of measurement
using the metric system.
•EX: time, date, height, size,
amount, temperature, etc.
•Be as exact as possible in
taking measurements.
•Measure something more
than once and use the
average of the results.
Test More than One Subject!
• Sample size is the number of
subjects you test.
•Your sample size must be large
enough to allow you to draw
accurate conclusions from your
data.
•Do Multiple Trials!


•When doing an
experiment, perform each
test several times.
After you have
collected your data,
determine what it
means.
Tables and graphs are often useful
in helping to organize the data.
Distance Rolled for a Metal Sphere
All graphs should include:
•Title
•Label the axis
•Include a key (legend)
•Use distinct colors
•Every graph always needs a
   key so people can easily
   tell what each color or
   pattern represents.
Tomato Plant Height
90
80
70
60
50
                                Full Light
40                              Light deprived
30
20
10
 0
     Week 1   Week 2   Week 3
In a line graph, place the
 dependent variable on the
    vertical axis and the
independent variable on the
       horizontal axis.
Temperature Variation over 4 Hours
60


50


40


30


20


10


 0
     1          2               3              4


          Sample 1   Sample 2       Sample 3
•Showing percentages is
easy to do with a pie chart.
•You can quickly see which
group has the biggest slice
and therefore contains the
most data.
Sneezing After Exposure to
10 Minutes of Bright Light


                      People
                       who
    People           sneezed
      who              43%
     didn't
    sneeze
     57%
•Based on the analysis of your
data, you should conclude
whether your results reject
or support your hypothesis.
•If the data does reject or
support the hypothesis, why
do you think it does?
•REMEMBER that it is NOT
important for the hypothesis to be
correct.
•What is important is that you
explain WHY you got the results you
did.
•Be sure to mention in your
conclusion what factors you believe
contributed to your results.
•Briefly explain possibilities for
new experiments that would
control these factors.
•Also, mention any investigative
questions that came up during
the experiment.
•Report your results by
doing a written report.
•Let others know what
you have learned.

•Once again, DO NOT
use personal pronouns!!
• Be sure to include a
bibliography, and no, Wikipedia is
NEVER an acceptable source for
any project throughout the entire
year!
• Give credit to the people who
helped you in your project- your
teacher, your parents,
professional scientist, or others.

Scientific Method

  • 2.
    •Experimental Design Research– The manipulation and control of variables • You absolutely, positively have to know what the variables are! 1. What you are changing? • How you are changing it? 2. What you are measuring? • How you are measuring? 3. Repeated trials 4. Data tables
  • 3.
    So an experimentalquestion has to indicate the variables: 1. How the independent variable will AFFECT the dependent variable 2. What the EFFECT of the independent variable will be on the dependent variable
  • 4.
    For example… •How doesthe temperature of ocean water affect the speed of a hurricane? Independent variable is the temperature of ocean water. Dependent variable is the speed of a hurricane.
  • 5.
    • Descriptive DesignResearch - Based mainly on observations. Ex. 1. Making models 2. Dissections 3. Observing animals in the wild Specific Example: How do the survivors of a disaster react to the disaster? No variables; data is based on watching and talking to survivors
  • 7.
    •Good questions comefrom careful observations. •Questions beginning with what, why, how and when are very important in focusing on an investigation.
  • 8.
    •An observation isany use of the senses to gather information. •Observations may be direct or indirect.
  • 9.
    •Direct observations are made using one of your senses such as sight or touch. •Indirect observations are made by using an instrument such as a thermometer or a microscope.
  • 10.
    •Observations usually leadto inferences. •An inference is a logical interpretation based on observations or prior knowledge (schema).
  • 11.
    •Example of an observation:Shadows can change in length. •Example of an inference: The length of an object’s shadow depends on how near the object is to the light source.
  • 12.
    •Determine if the followingexamples are observations or inferences. •You do not have to write these in your notes.
  • 13.
    I turn ona fan. The blades of the fan are turning.
  • 14.
    There is awhirring sound.
  • 15.
    You feel abreeze.
  • 16.
    The fan ispushing the air around in the room.
  • 18.
    •A hypothesis isa clear statement of what you EXPECT the answer to your question to be. •Your hypothesis will represent your best “educated guess” based on what you have observed and what you already know (schema). •A hypothesis must be stated in an if- then format.
  • 19.
    A hypothesis isa special kind of prediction. o What makes it so special??? • It’s a guess about the VARIABLES& their relationship, in particular, •How will the independent variable affect the dependent variable?
  • 20.
    Here is anexample of a hypothesis: If the researcher uses acid rain to water plants, then the plants’ growth will be slower.
  • 21.
    Do NOT use personal pronouns!! Ithink that acid rain causes plants to grow more slowly.
  • 22.
    •Hypothesis − a statement that uses a few observations − an idea based on observations without experimental evidence •Theory − uses many observations and has lots of experimental evidence − can be applied to unrelated facts and new relationships − flexible enough to be modified if new data/evidence is introduced •Law − stands the test of time, often without change − experimentally confirmed over and over − can create true predictions for different situations − has uniformity and is universal
  • 24.
    • You testyour hypothesis by doing an experiment. • Make sure you are doing an experiment and not a demonstration!
  • 25.
    •Experiment vs. Demonstration •Thoughmodeling a volcano’s eruption is an interesting demonstration, it is NOT an experiment. •Figuring out how altitude affects the boiling point of water is an experiment.
  • 26.
    A controlled experimenttests only ONE factor. • A controlled experiment has a control group and one or more experimental group. • The control group and the experimental groups are EXACTLY the same except for ONE factor.
  • 27.
    • The factorthat differs is called the variable. • Because the variable is the only factor that differs, scientists know that this factor is responsible for the results of the experiment.
  • 28.
    •An independent variableiswhat the scientist changes in the experiment. •A dependent variableis what changes in the experiment as a result of what the scientist does.
  • 29.
    •While doing theexperiment, be sure to write down all of the observations that you make. •Include any type of measurement using the metric system. •EX: time, date, height, size, amount, temperature, etc.
  • 30.
    •Be as exactas possible in taking measurements. •Measure something more than once and use the average of the results.
  • 31.
    Test More thanOne Subject! • Sample size is the number of subjects you test. •Your sample size must be large enough to allow you to draw accurate conclusions from your data.
  • 32.
    •Do Multiple Trials! •Whendoing an experiment, perform each test several times.
  • 34.
    After you have collectedyour data, determine what it means.
  • 35.
    Tables and graphsare often useful in helping to organize the data. Distance Rolled for a Metal Sphere
  • 36.
    All graphs shouldinclude: •Title •Label the axis •Include a key (legend) •Use distinct colors
  • 37.
    •Every graph alwaysneeds a key so people can easily tell what each color or pattern represents.
  • 38.
    Tomato Plant Height 90 80 70 60 50 Full Light 40 Light deprived 30 20 10 0 Week 1 Week 2 Week 3
  • 39.
    In a linegraph, place the dependent variable on the vertical axis and the independent variable on the horizontal axis.
  • 40.
    Temperature Variation over4 Hours 60 50 40 30 20 10 0 1 2 3 4 Sample 1 Sample 2 Sample 3
  • 41.
    •Showing percentages is easyto do with a pie chart. •You can quickly see which group has the biggest slice and therefore contains the most data.
  • 42.
    Sneezing After Exposureto 10 Minutes of Bright Light People who People sneezed who 43% didn't sneeze 57%
  • 44.
    •Based on theanalysis of your data, you should conclude whether your results reject or support your hypothesis. •If the data does reject or support the hypothesis, why do you think it does?
  • 45.
    •REMEMBER that itis NOT important for the hypothesis to be correct. •What is important is that you explain WHY you got the results you did. •Be sure to mention in your conclusion what factors you believe contributed to your results.
  • 46.
    •Briefly explain possibilitiesfor new experiments that would control these factors. •Also, mention any investigative questions that came up during the experiment.
  • 48.
    •Report your resultsby doing a written report. •Let others know what you have learned. •Once again, DO NOT use personal pronouns!!
  • 49.
    • Be sureto include a bibliography, and no, Wikipedia is NEVER an acceptable source for any project throughout the entire year! • Give credit to the people who helped you in your project- your teacher, your parents, professional scientist, or others.