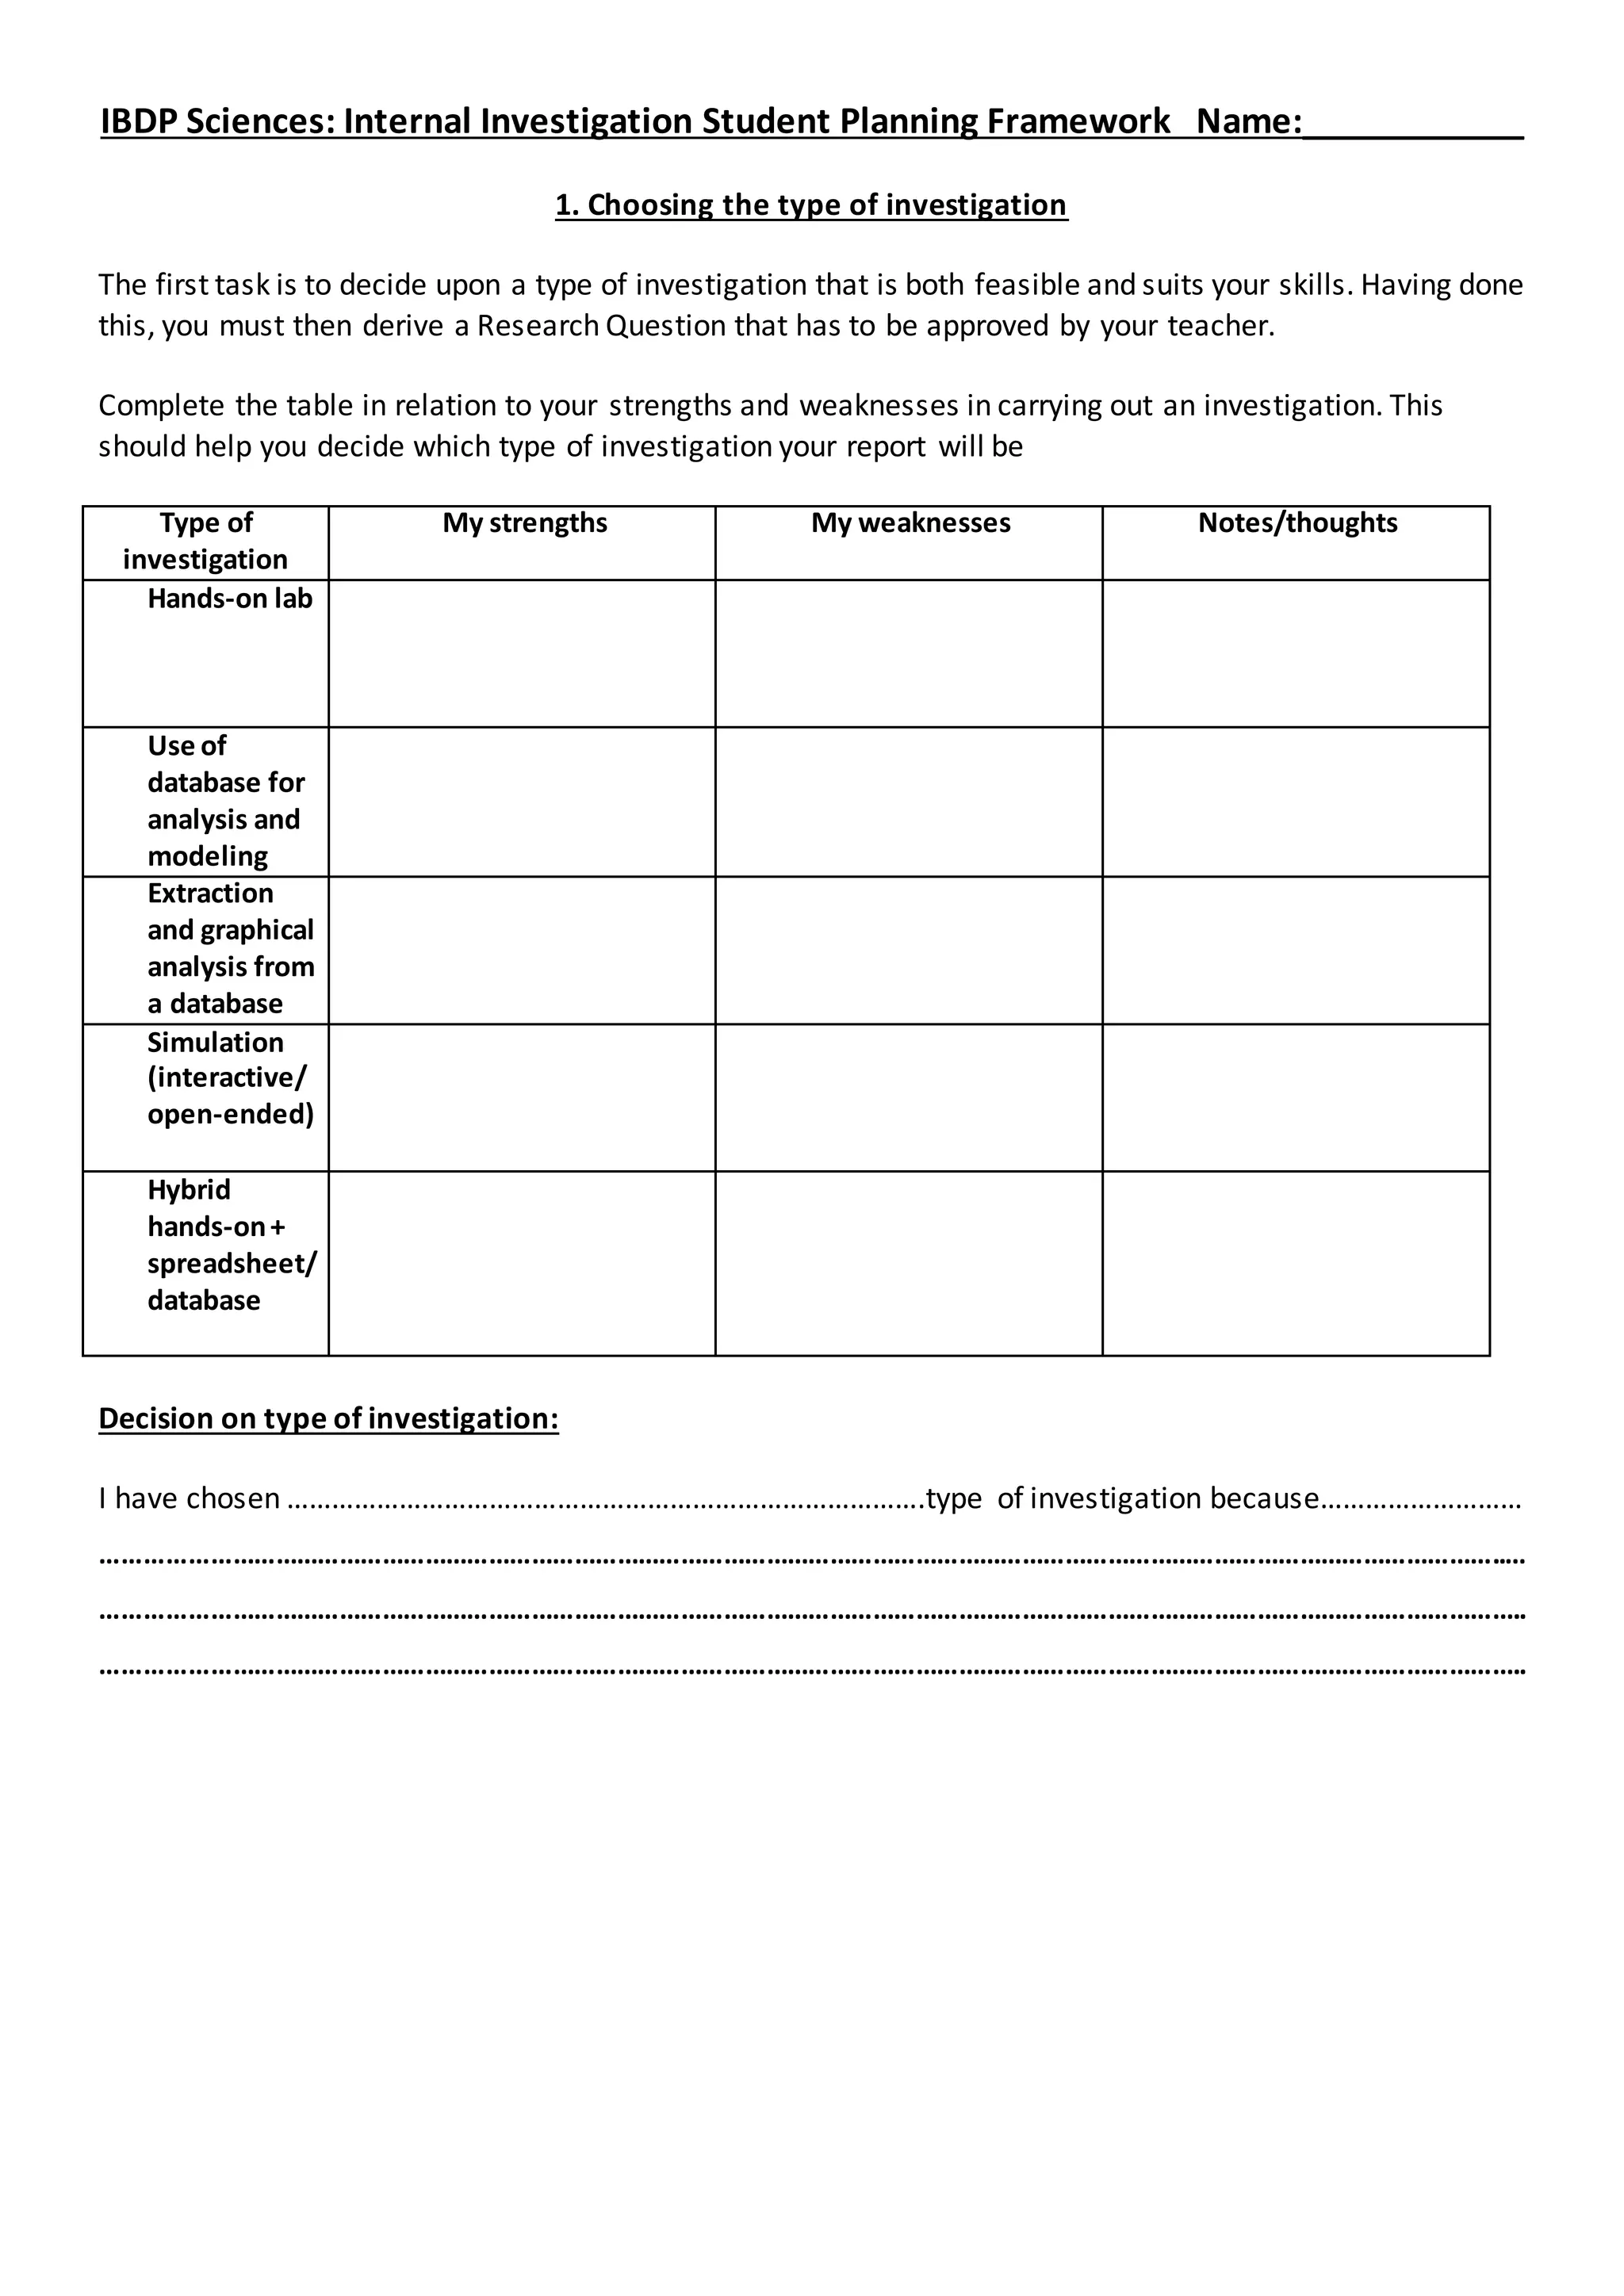
1. This document provides a framework for students to plan an internal investigation for the IBDP Sciences. It includes sections to choose an investigation type, develop a research question and hypothesis, identify variables, plan apparatus and methods, collect and present data, and analyze results.
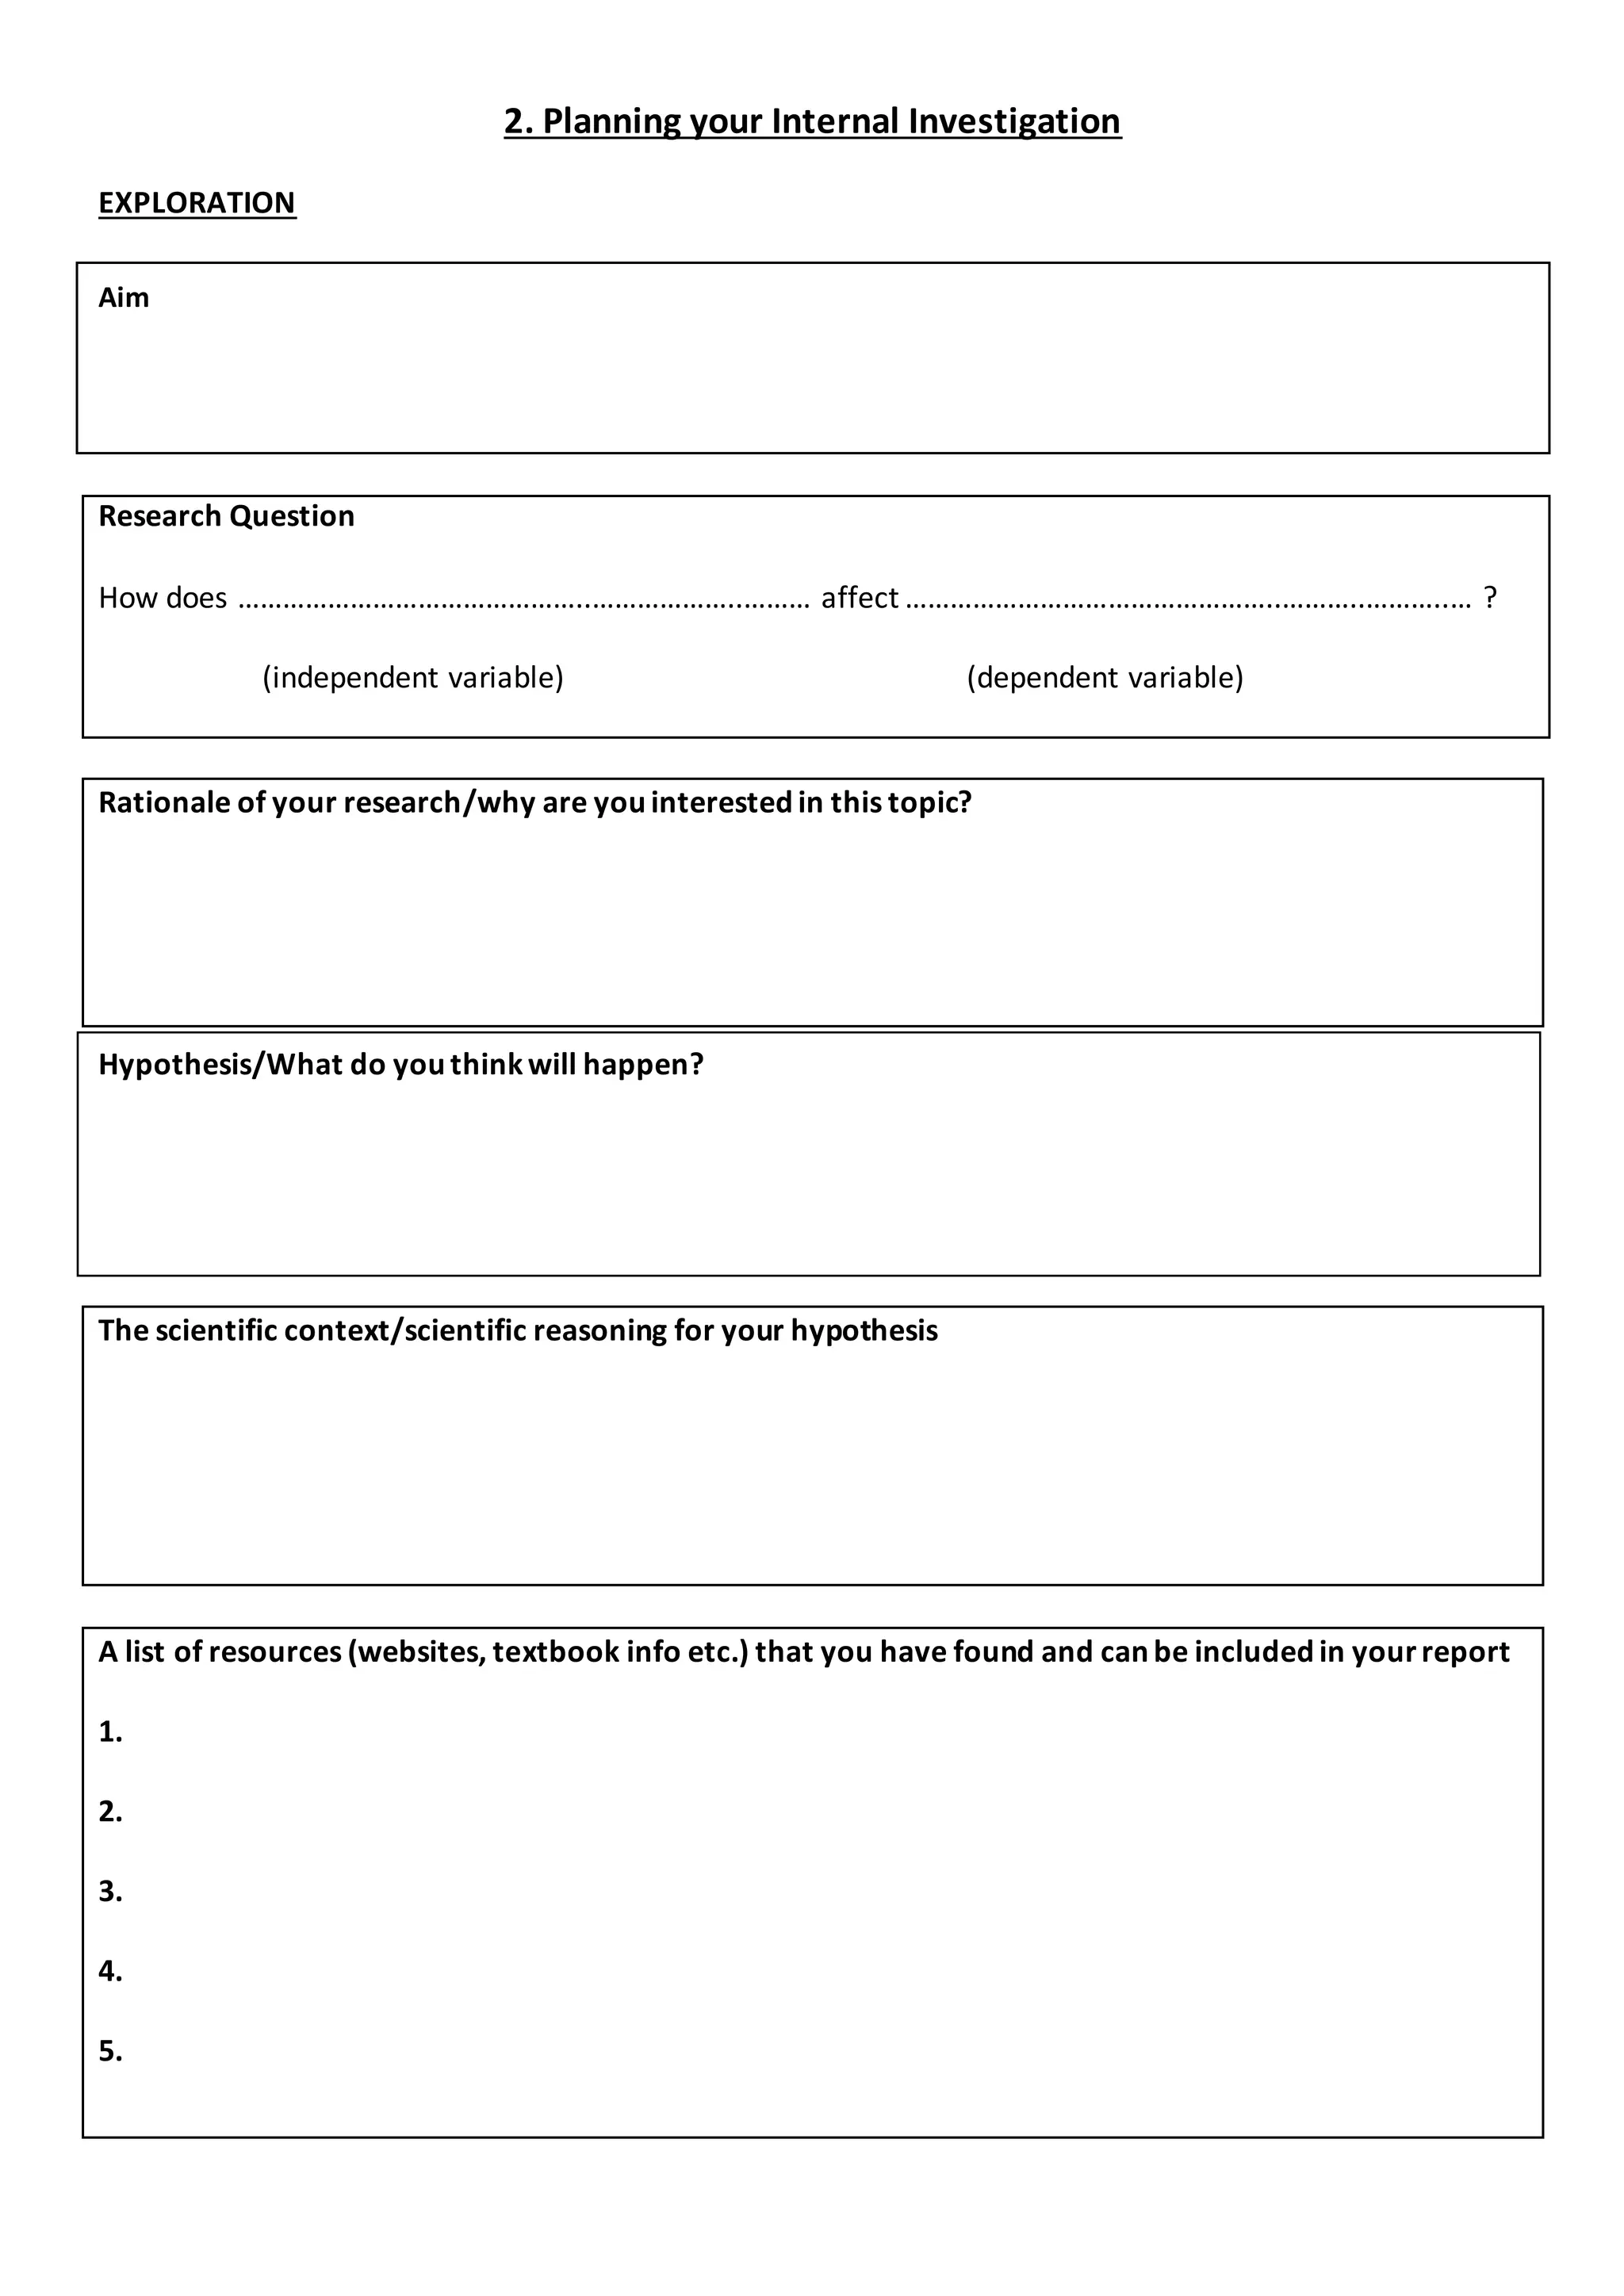
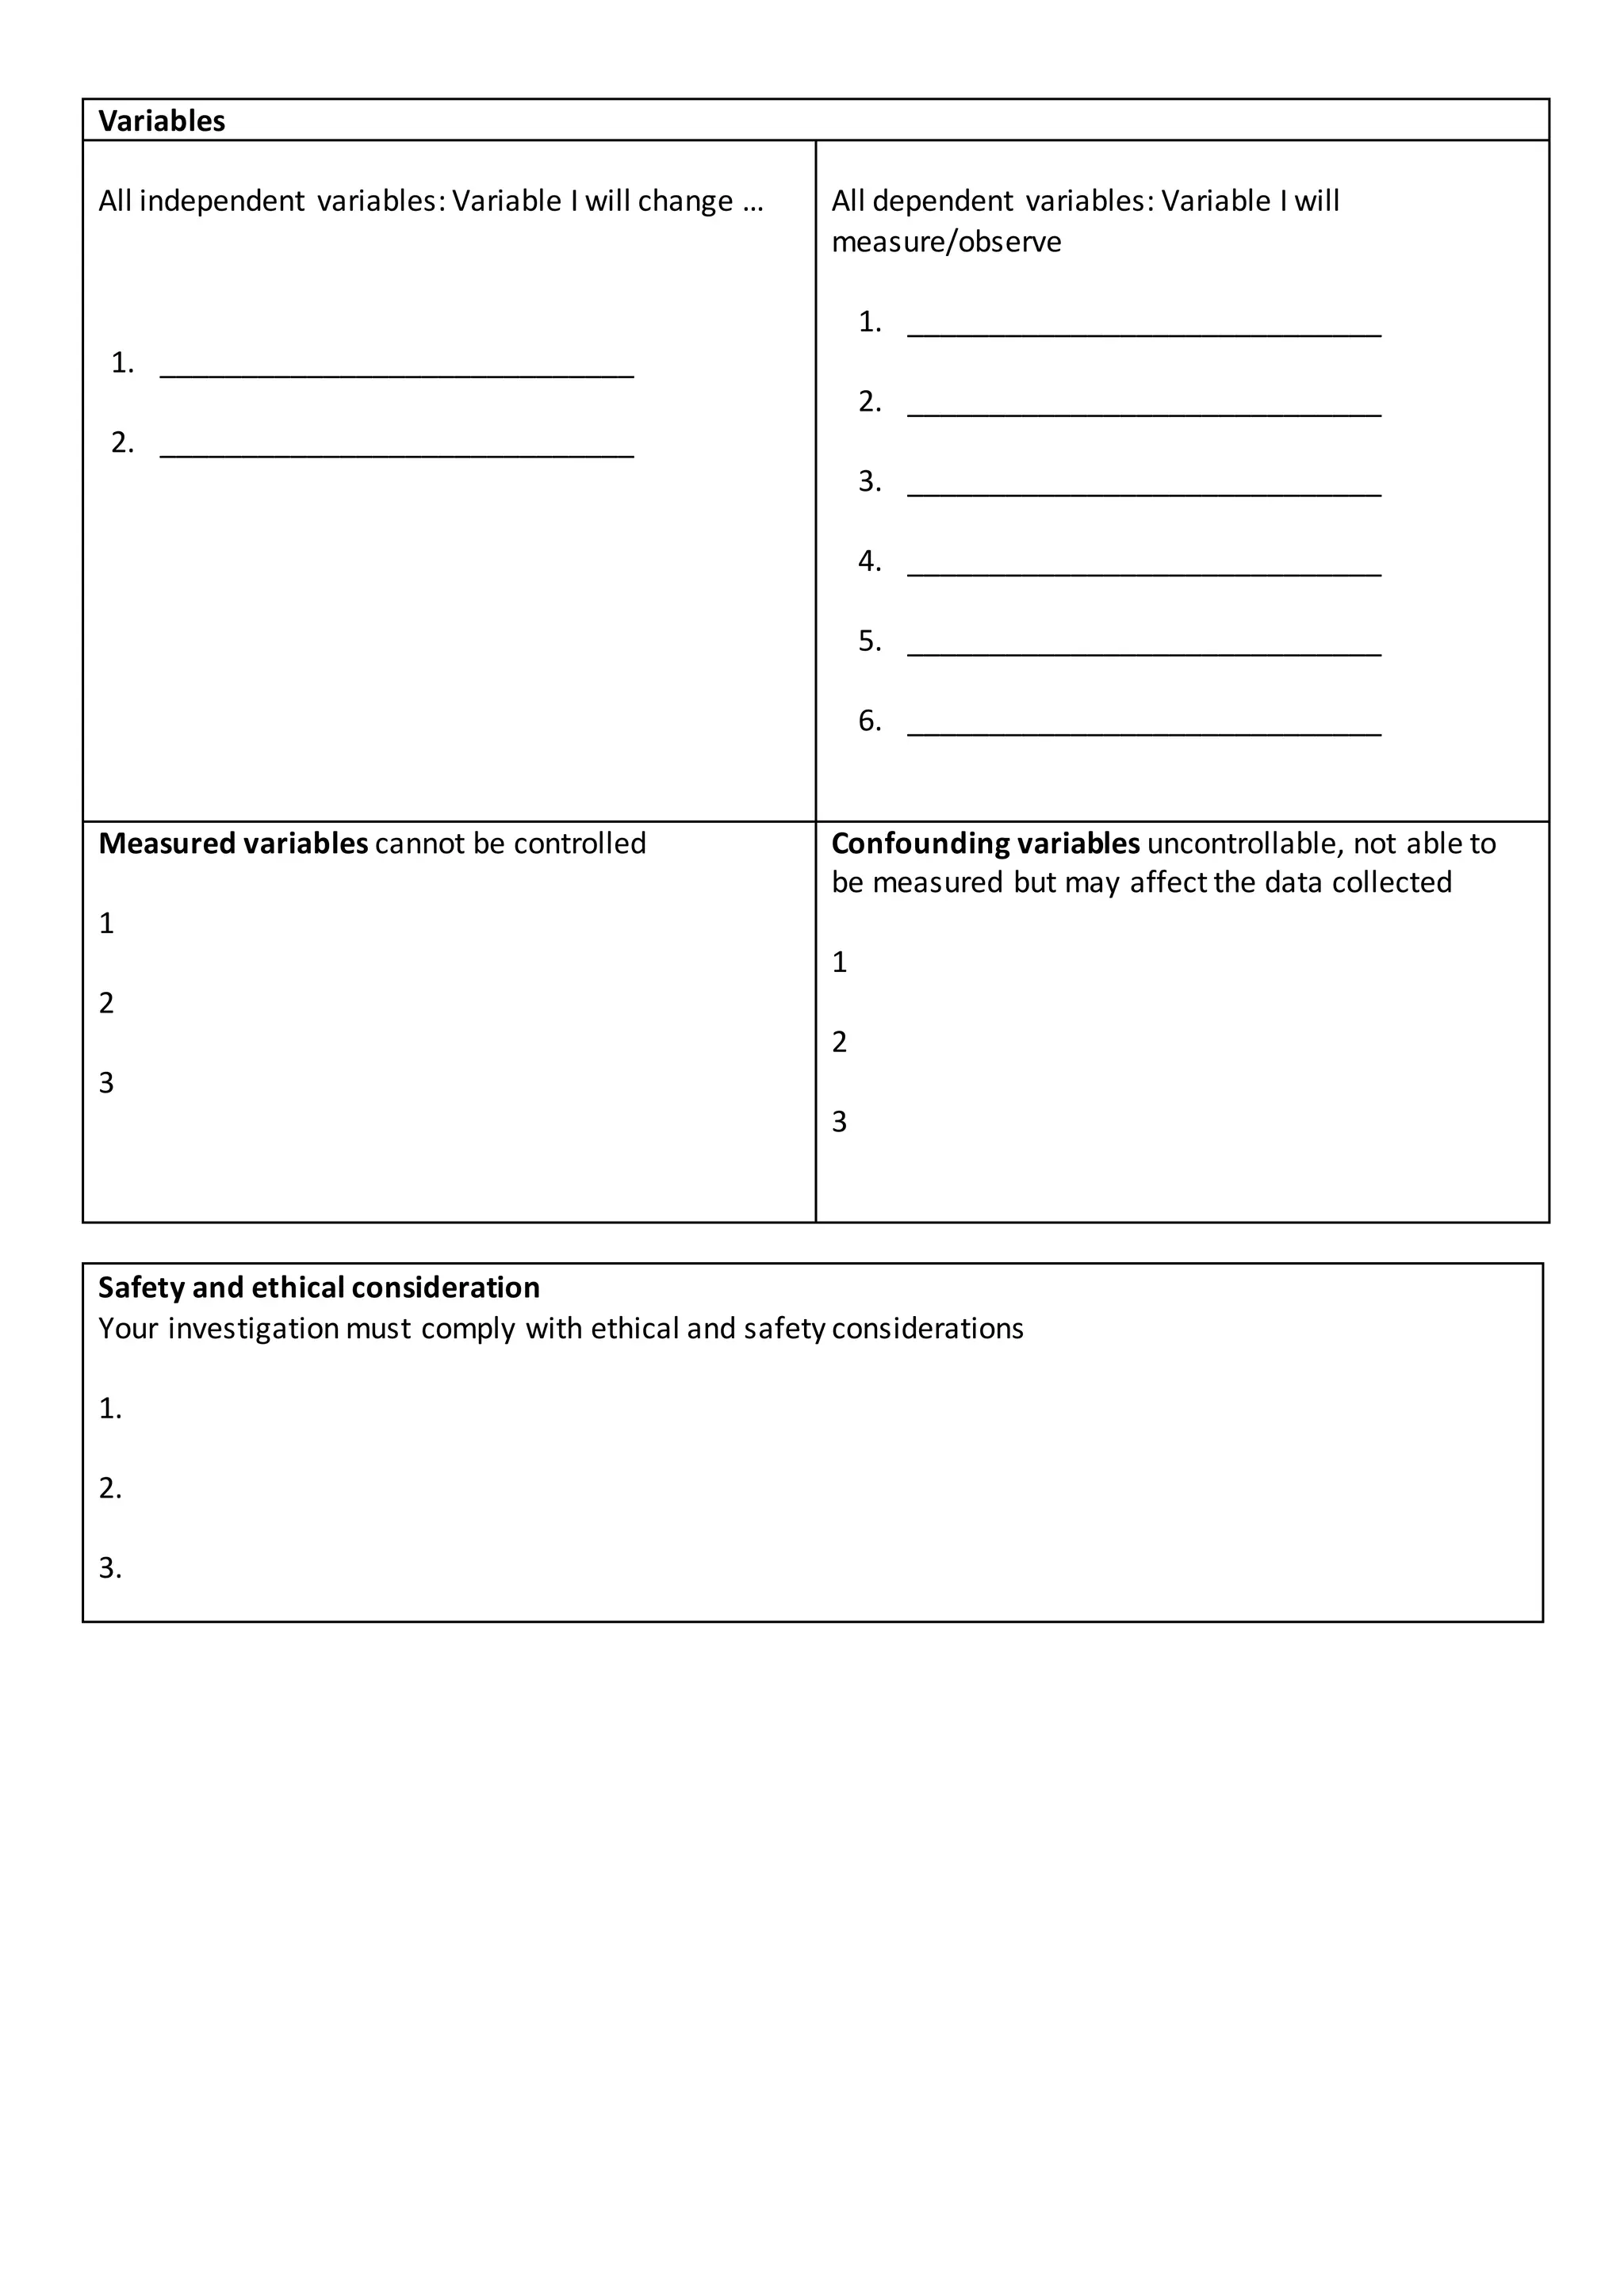
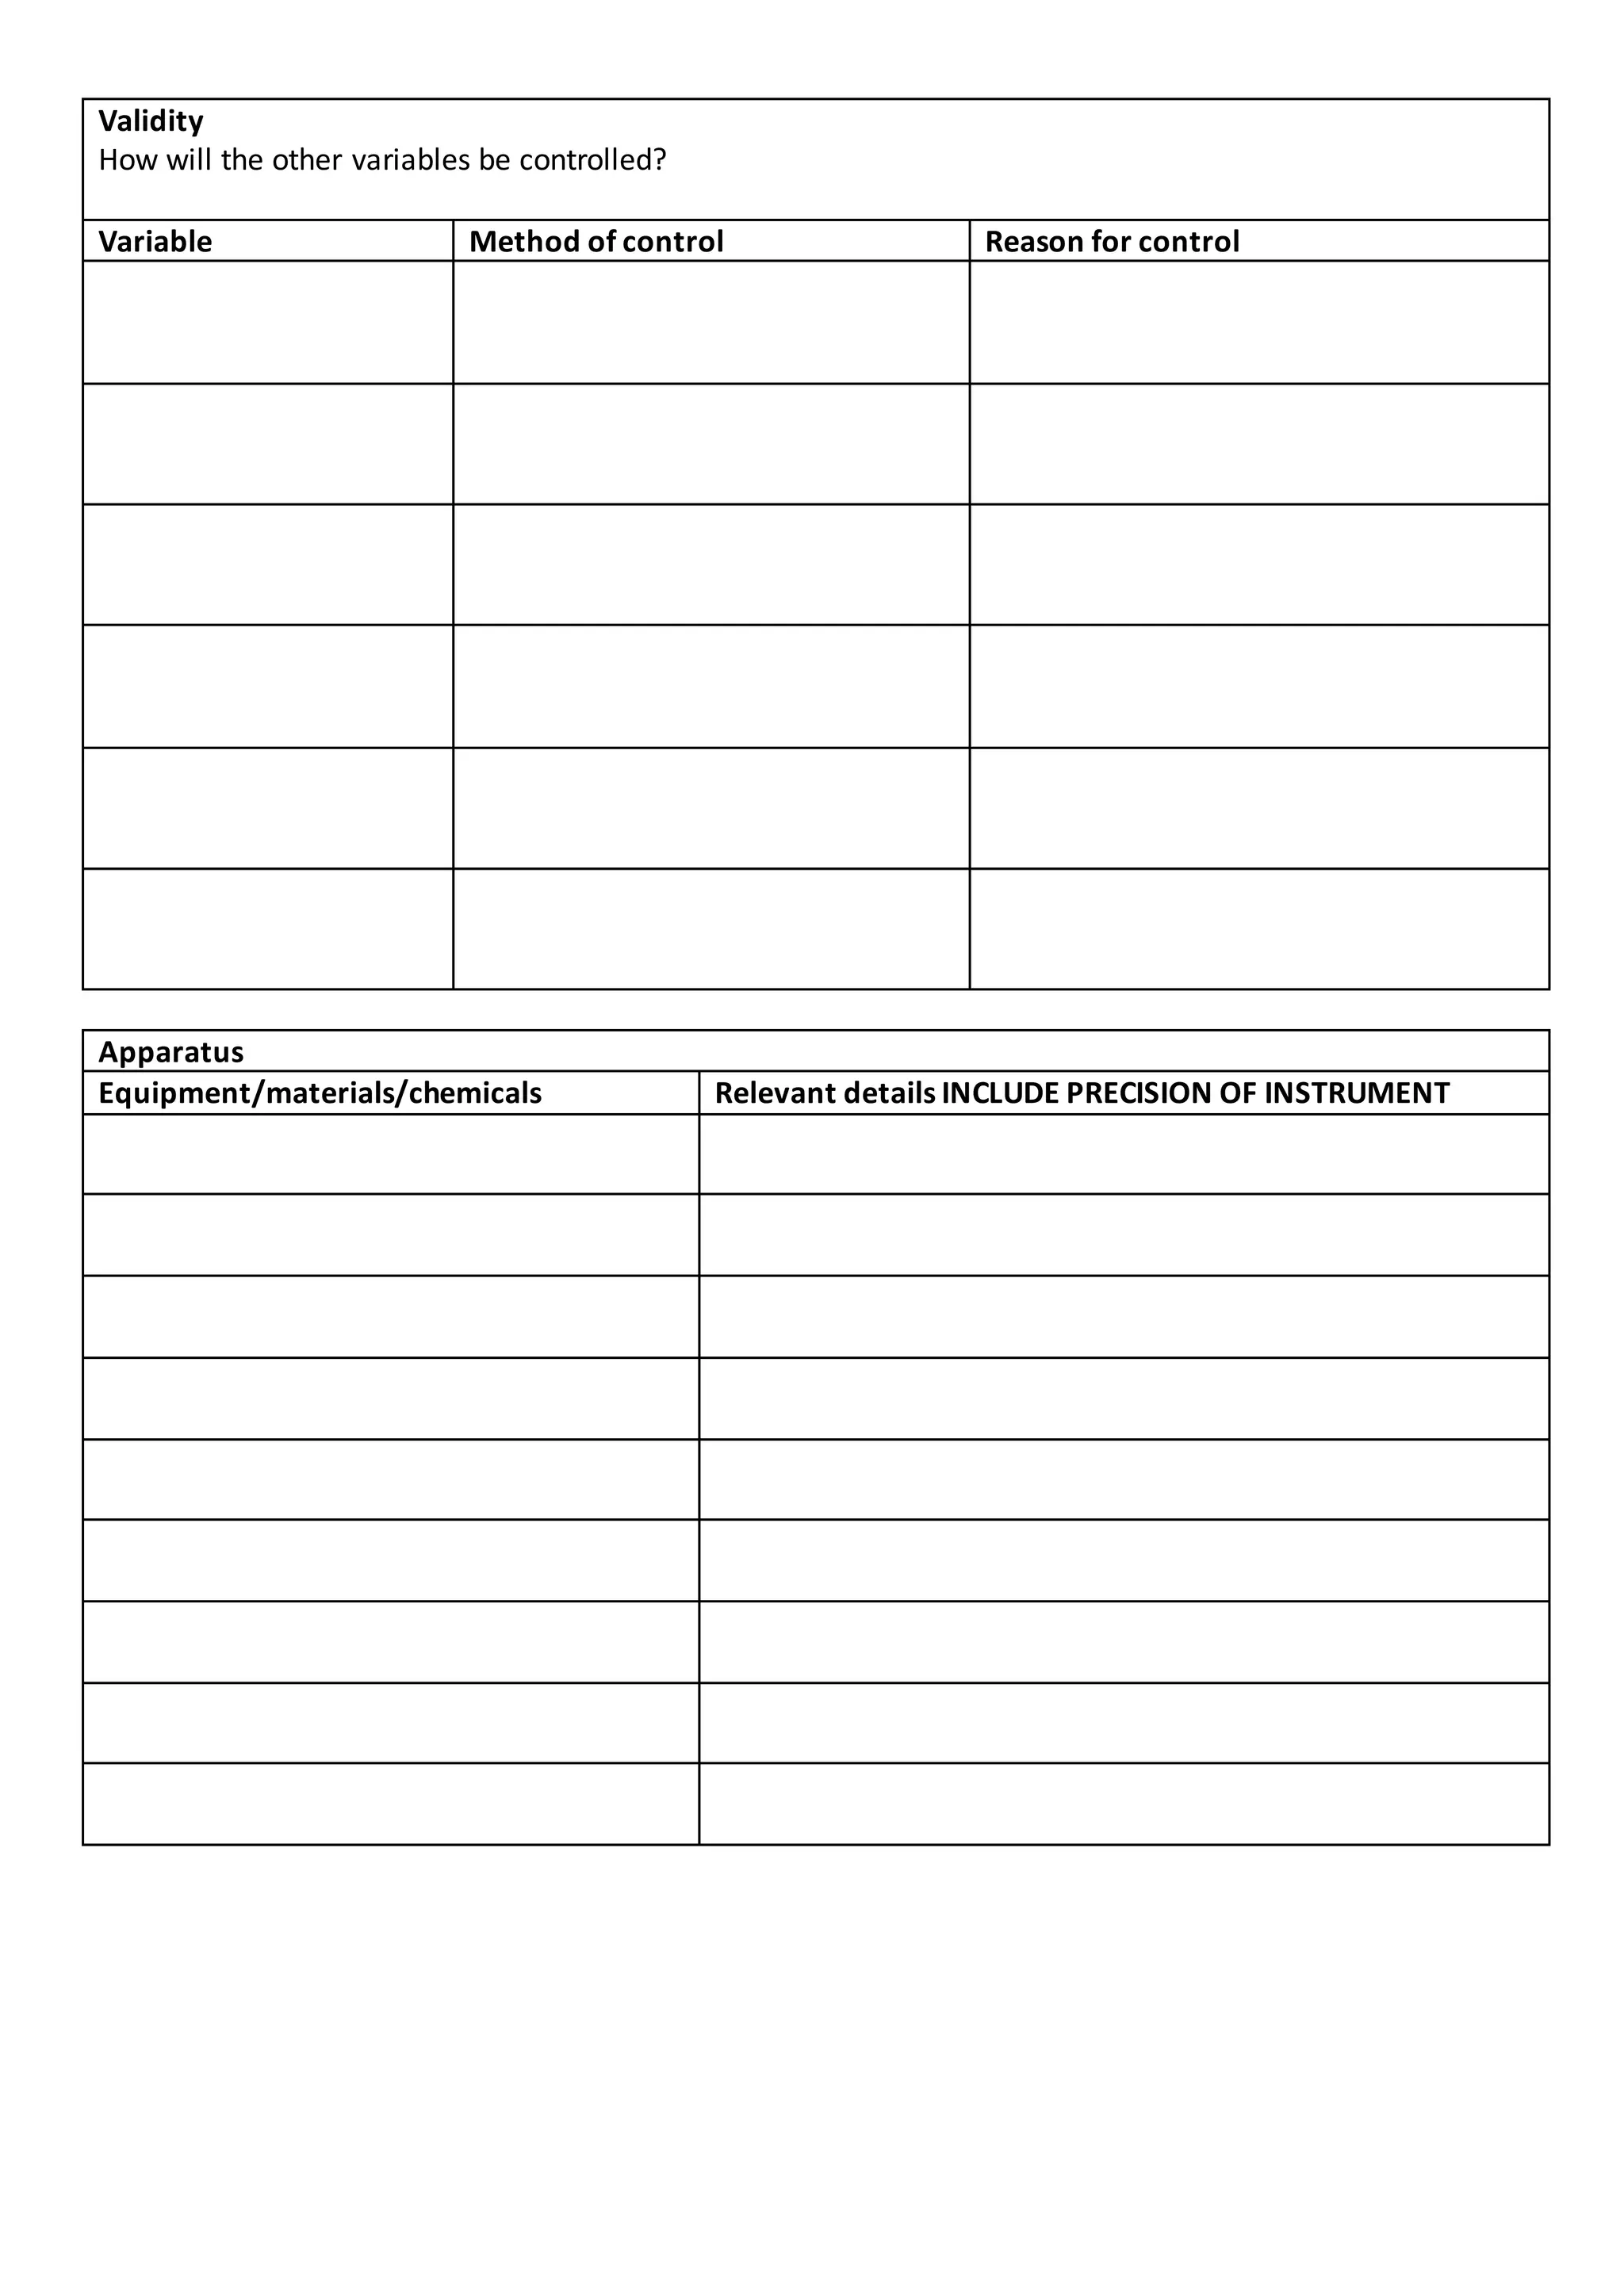
2. The planning framework guides students through exploration, experiment design, data collection and presentation, and conclusion/evaluation. It prompts students to consider investigation type, variables, apparatus, safety, validity, methods, results, uncertainties, and improvements.
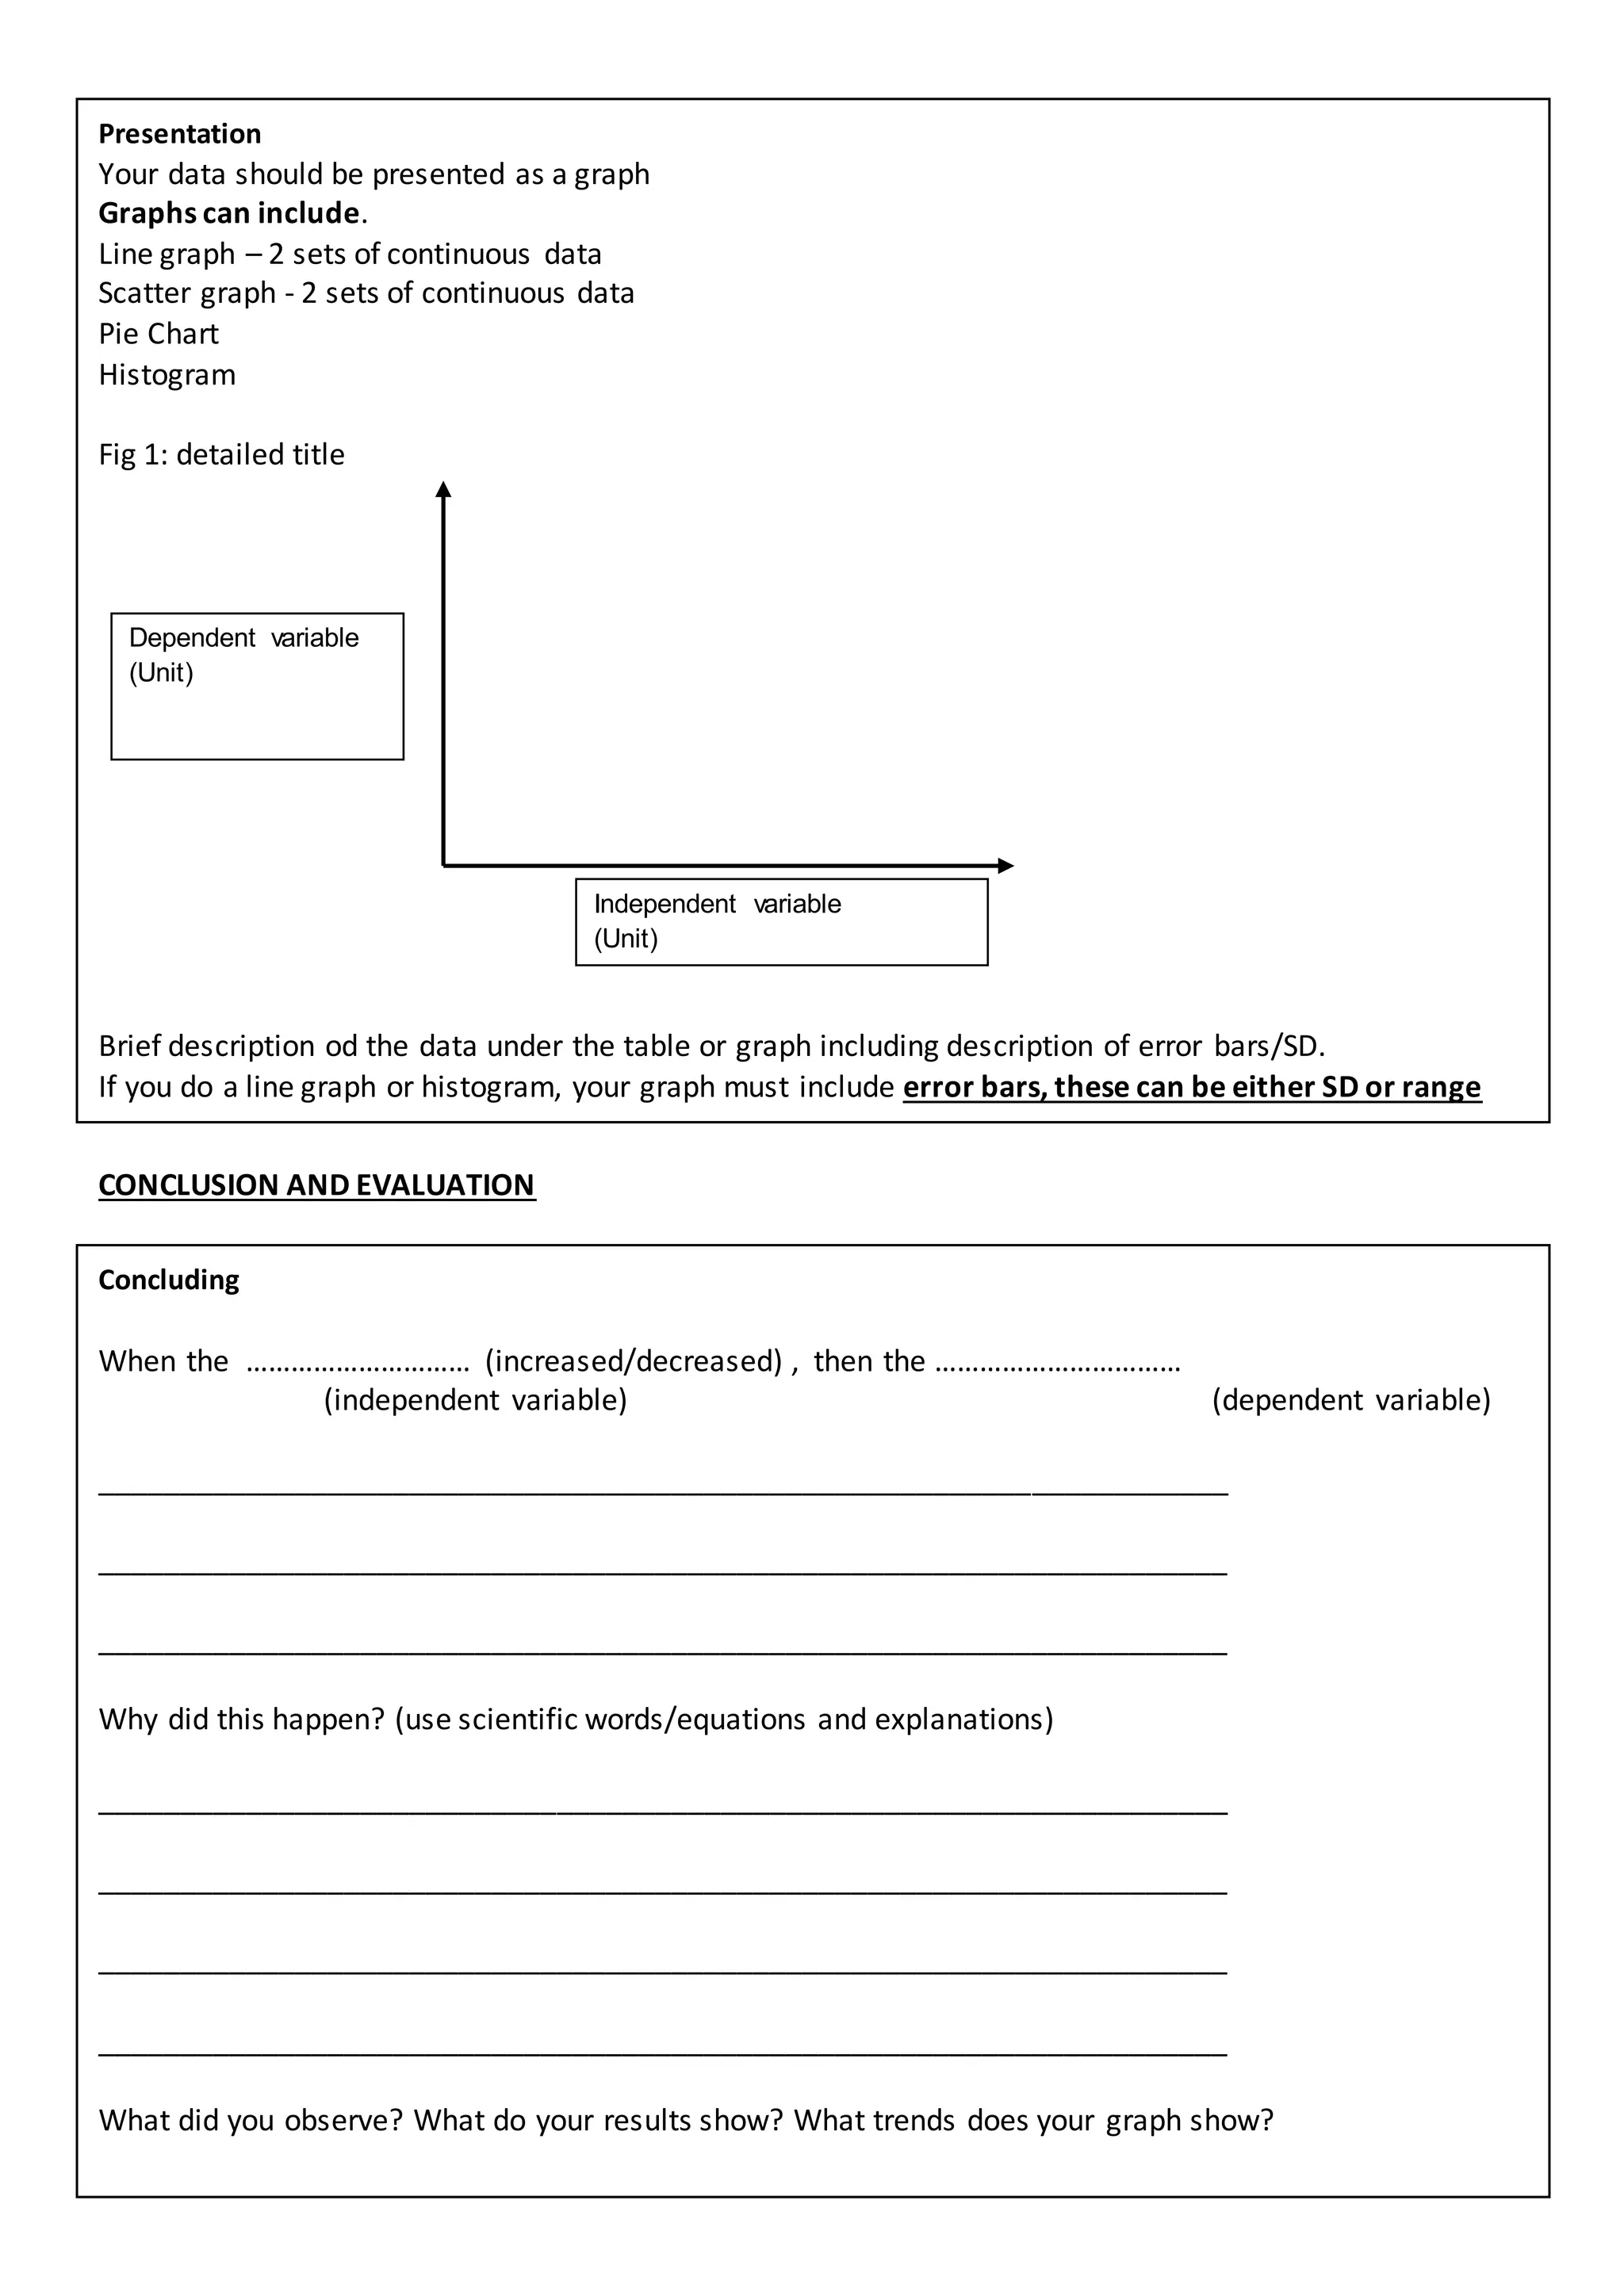
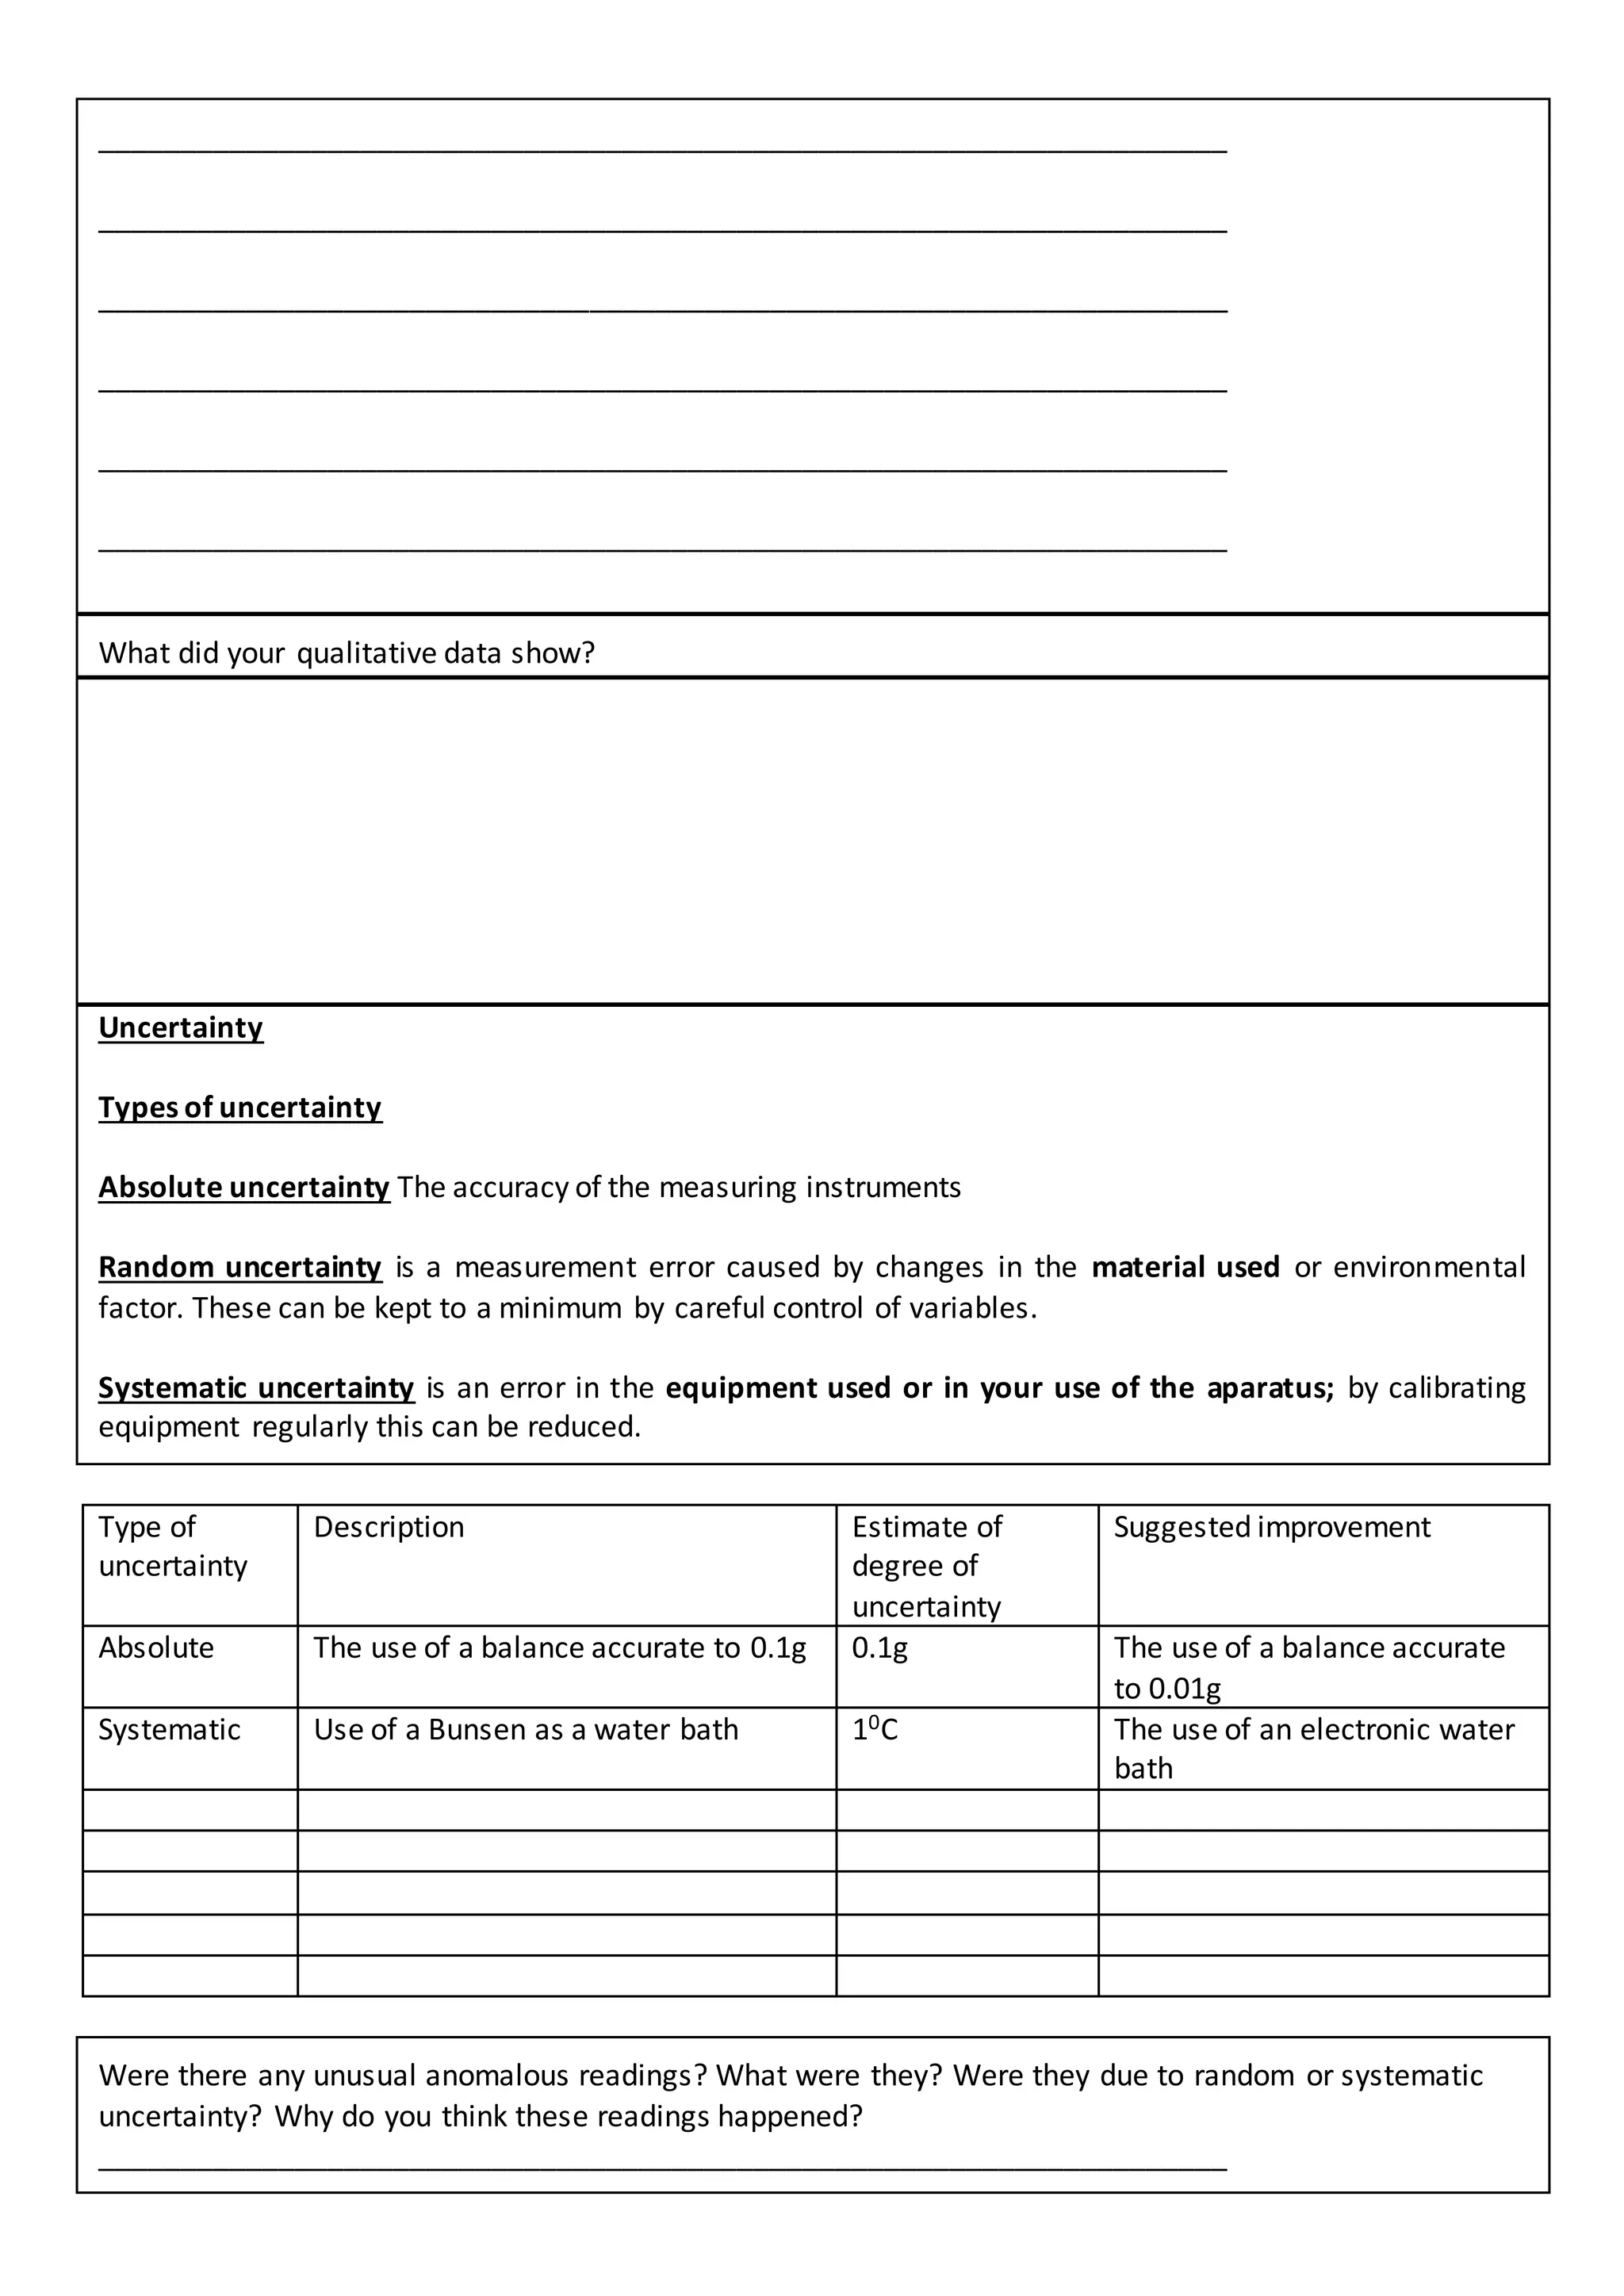
3. The conclusion section has students state how the independent variable affected the dependent variable, explain results scientifically, evaluate uncertainties and apparatus, compare results to accepted values, and suggest further investigations.