Downloaded 58 times

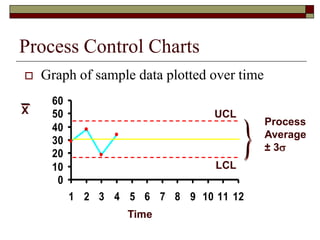
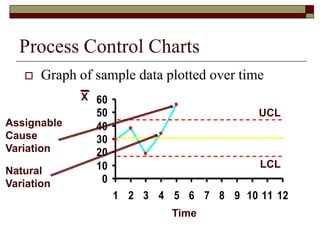
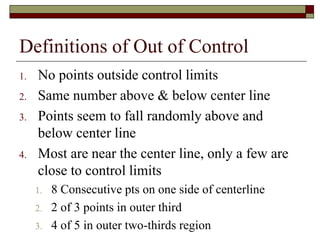
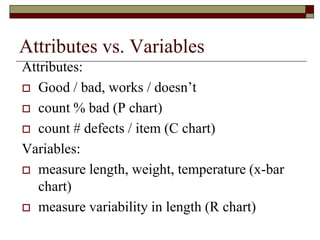
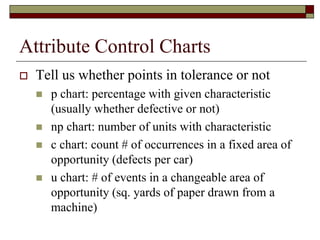
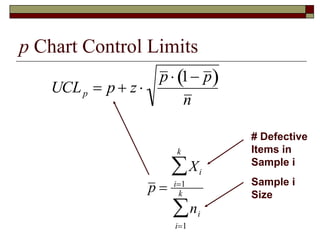
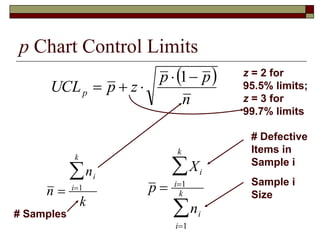

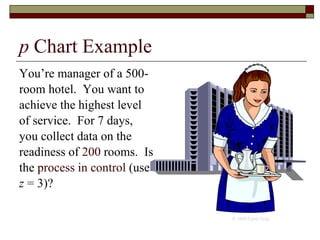
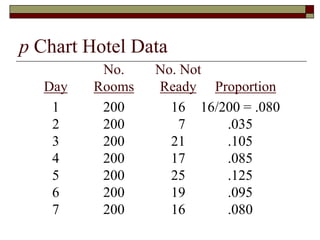
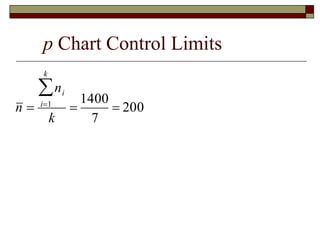
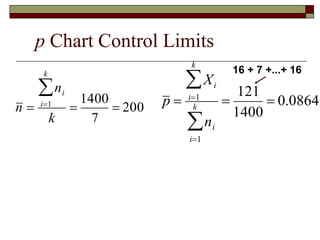
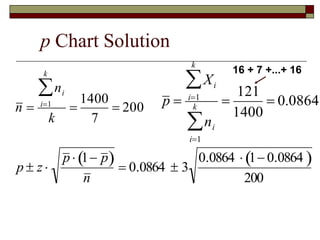
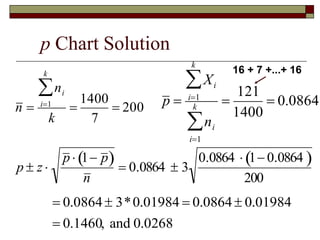
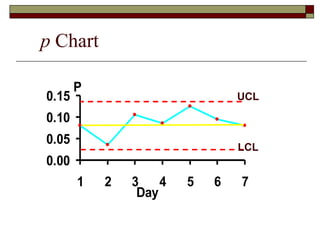
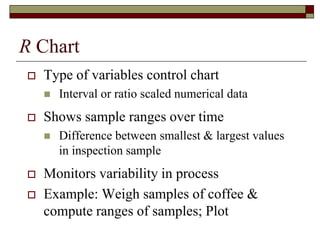
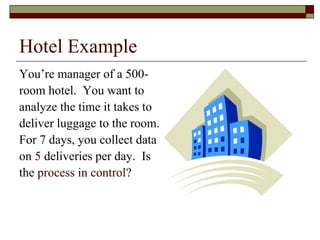
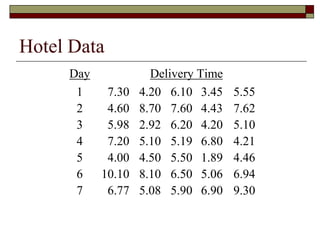
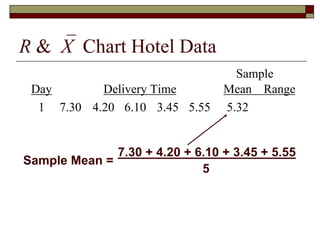
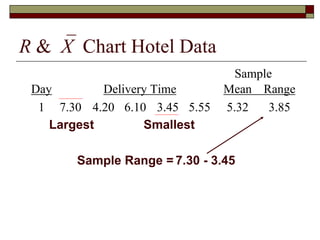

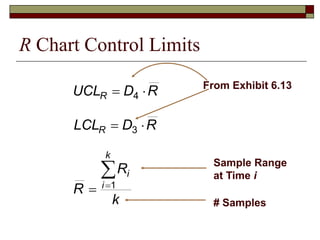
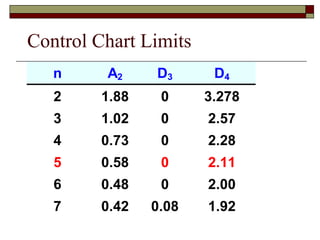
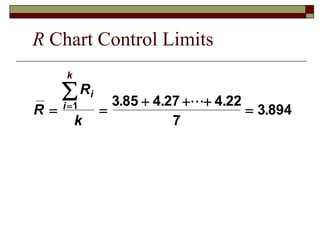
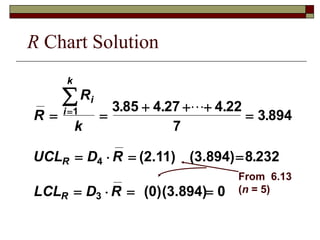
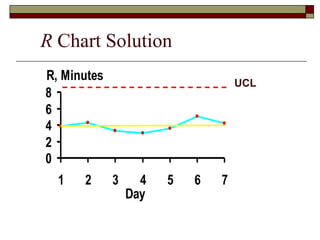
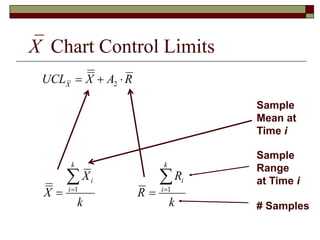
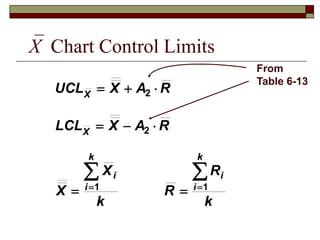
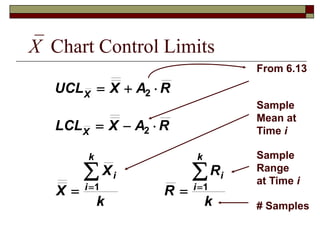
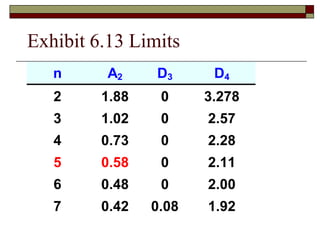
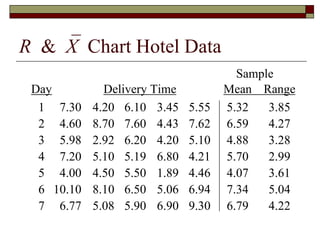
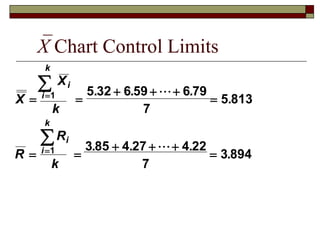
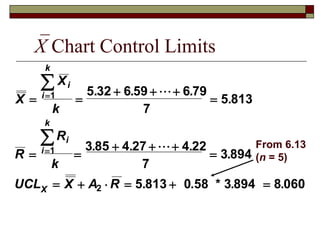
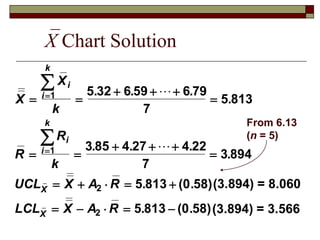
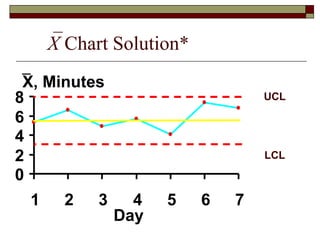
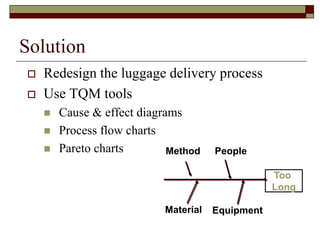

This document discusses statistical process control and control charts. It defines the goals of control charts as collecting and visually presenting data to see when trends or out-of-control points occur. Process control charts graph sample data over time and show the process average and upper and lower control limits. Attribute control charts indicate whether points are in or out of tolerance, while variables charts measure attributes like length, weight or temperature over time. Examples are provided to illustrate p-charts, R-charts and X-bar charts using hotel luggage delivery time data.


![Production & Operation Management Chapter9[1]](https://cdn.slidesharecdn.com/ss_thumbnails/chapter91-140613051446-phpapp02-thumbnail.jpg?width=640&height=640&fit=bounds)
![Chapter9[1]](https://cdn.slidesharecdn.com/ss_thumbnails/chapter91-140613050946-phpapp02-thumbnail.jpg?width=640&height=640&fit=bounds)


