

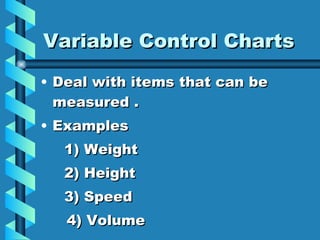

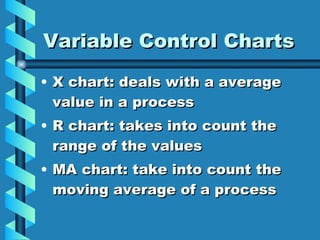


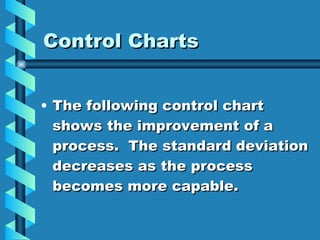


Control charts are a statistical tool used to determine if a process is in or out of control. There are two main types of control charts: variable control charts which deal with measurable items and attribute control charts which factor in quality attributes. Control charts help improve processes by making defects visible and determining what adjustments are needed. They are calculated by finding the average, upper control limit, and lower control limit of a sample data set and plotting the points on a chart.


![7 qc tools training material[1]](https://cdn.slidesharecdn.com/ss_thumbnails/7qctoolstrainingmaterial1-120925054558-phpapp02-thumbnail.jpg?width=640&height=640&fit=bounds)


