Downloaded 655 times
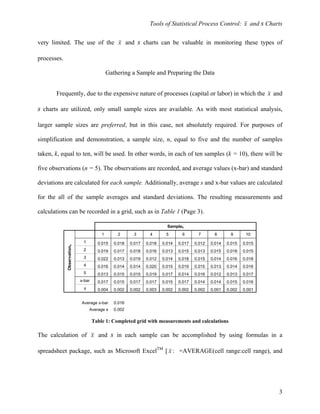
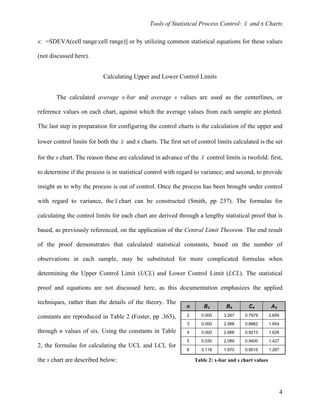
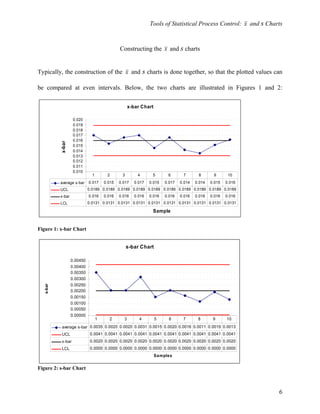
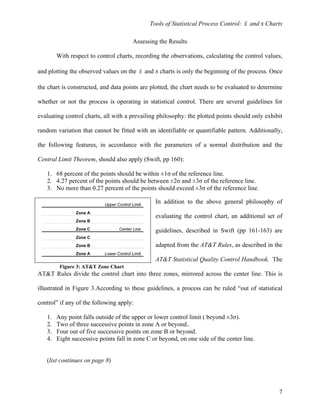

This document discusses x and s control charts, which are statistical tools used to monitor processes and determine if they are in statistical control. The x chart tracks central tendency (averages) while the s chart tracks variation (standard deviation). Sample data is collected, averages and standard deviations are calculated, and control limits are determined using statistical formulas. Together the x and s charts provide insight into a process's stability and identify areas for improvement.


