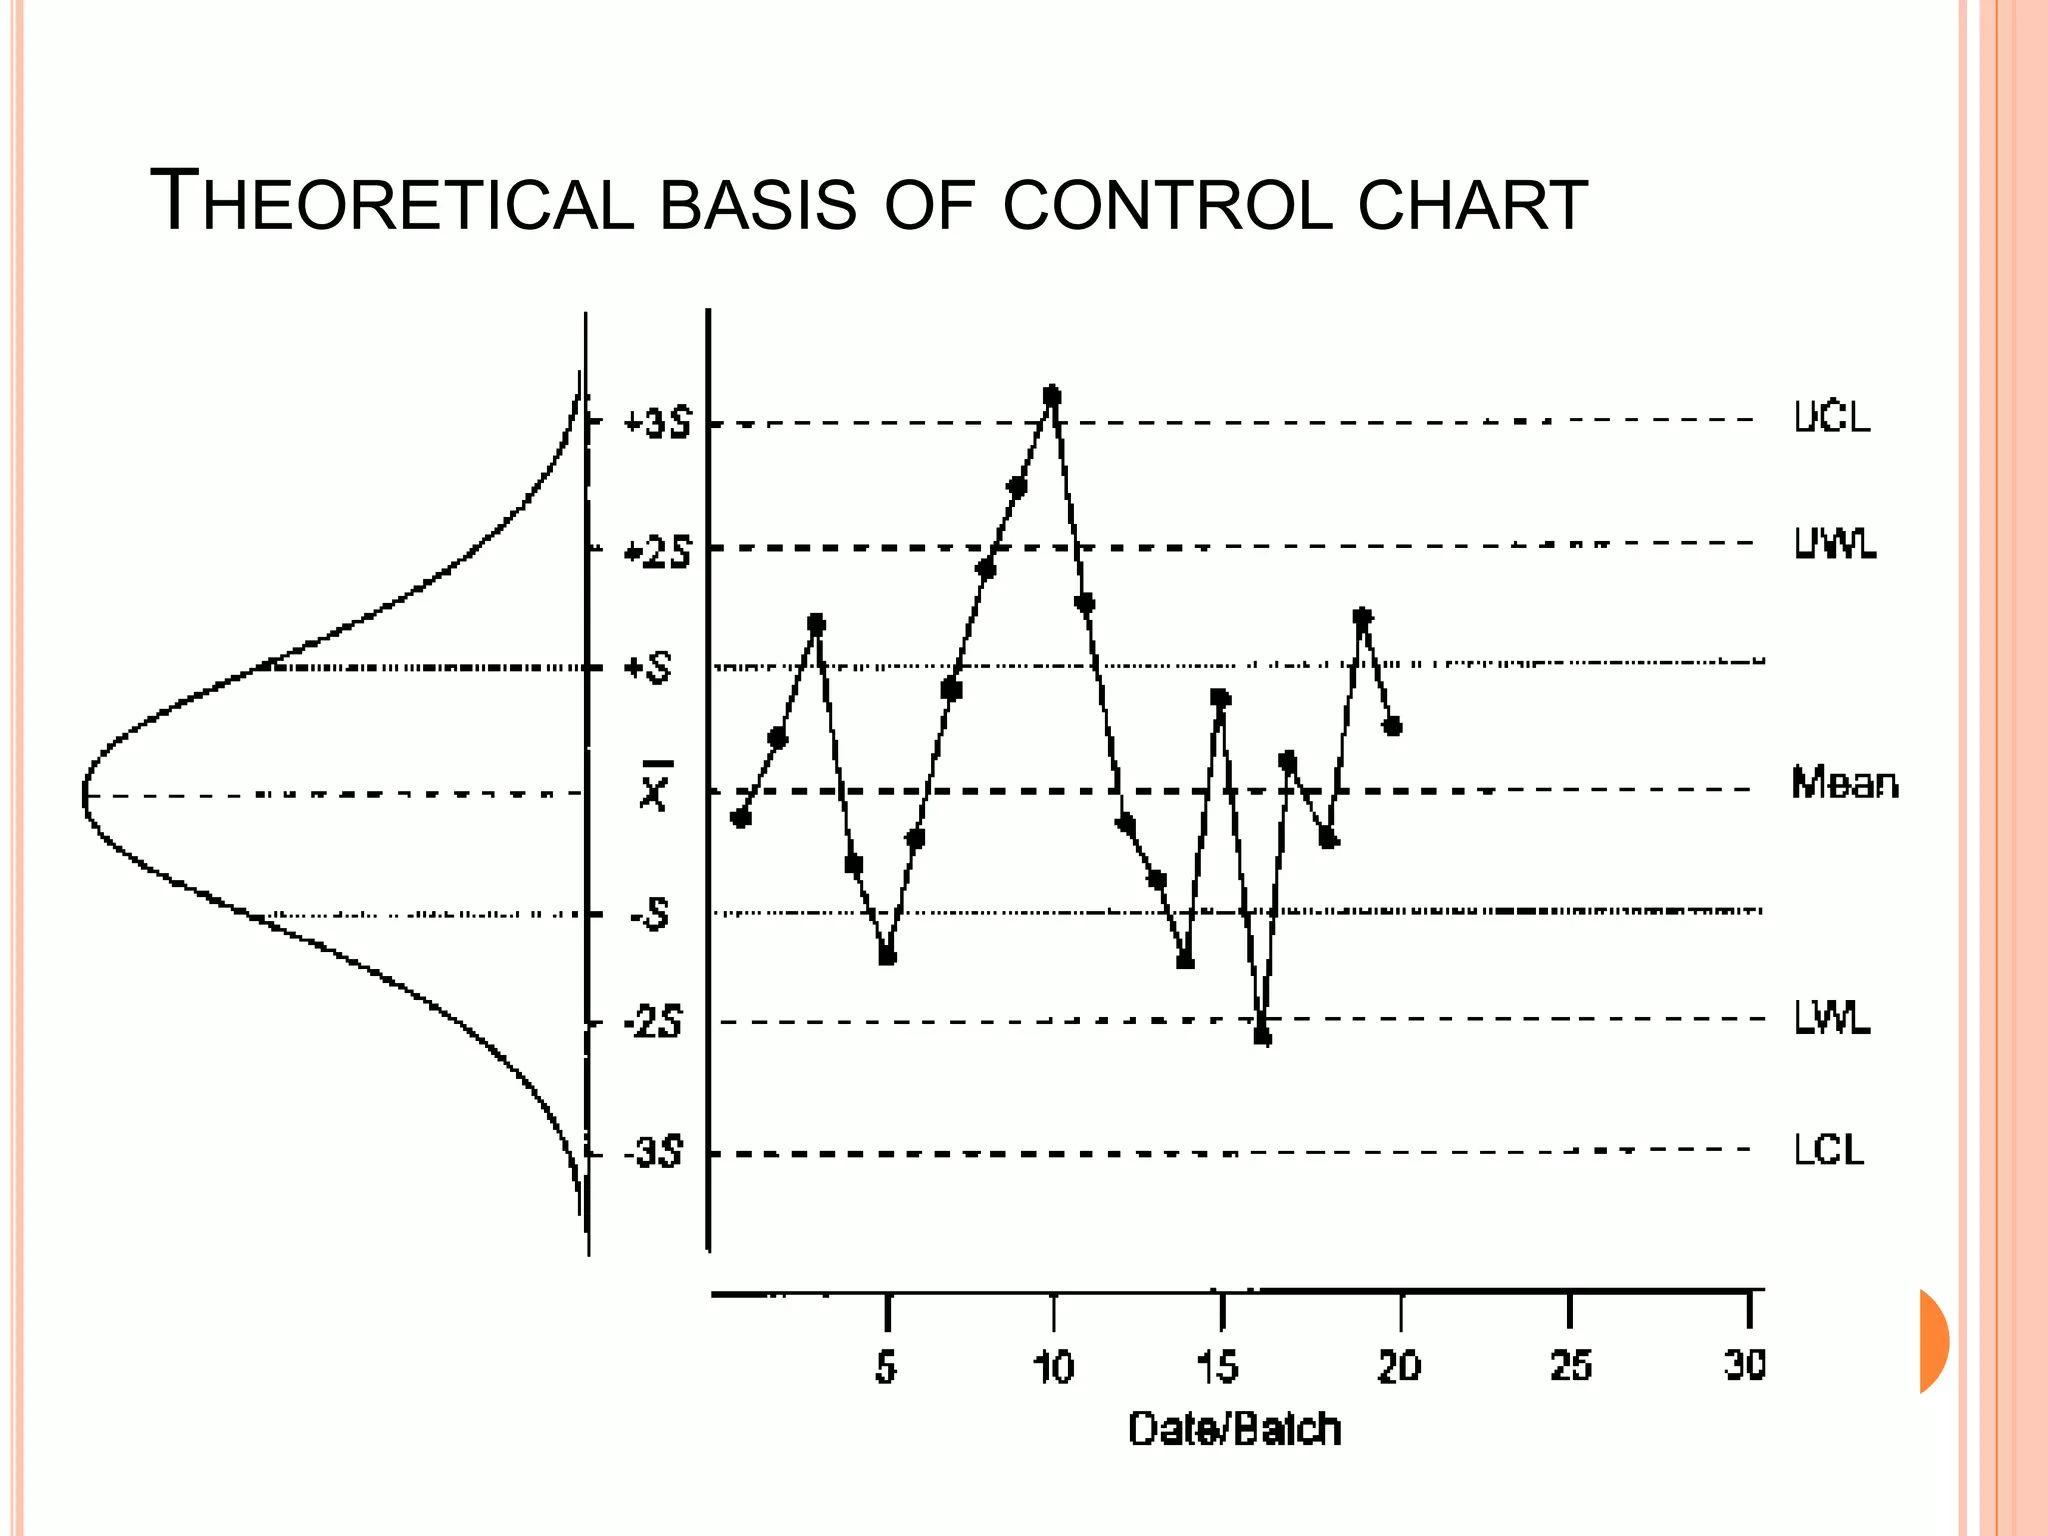
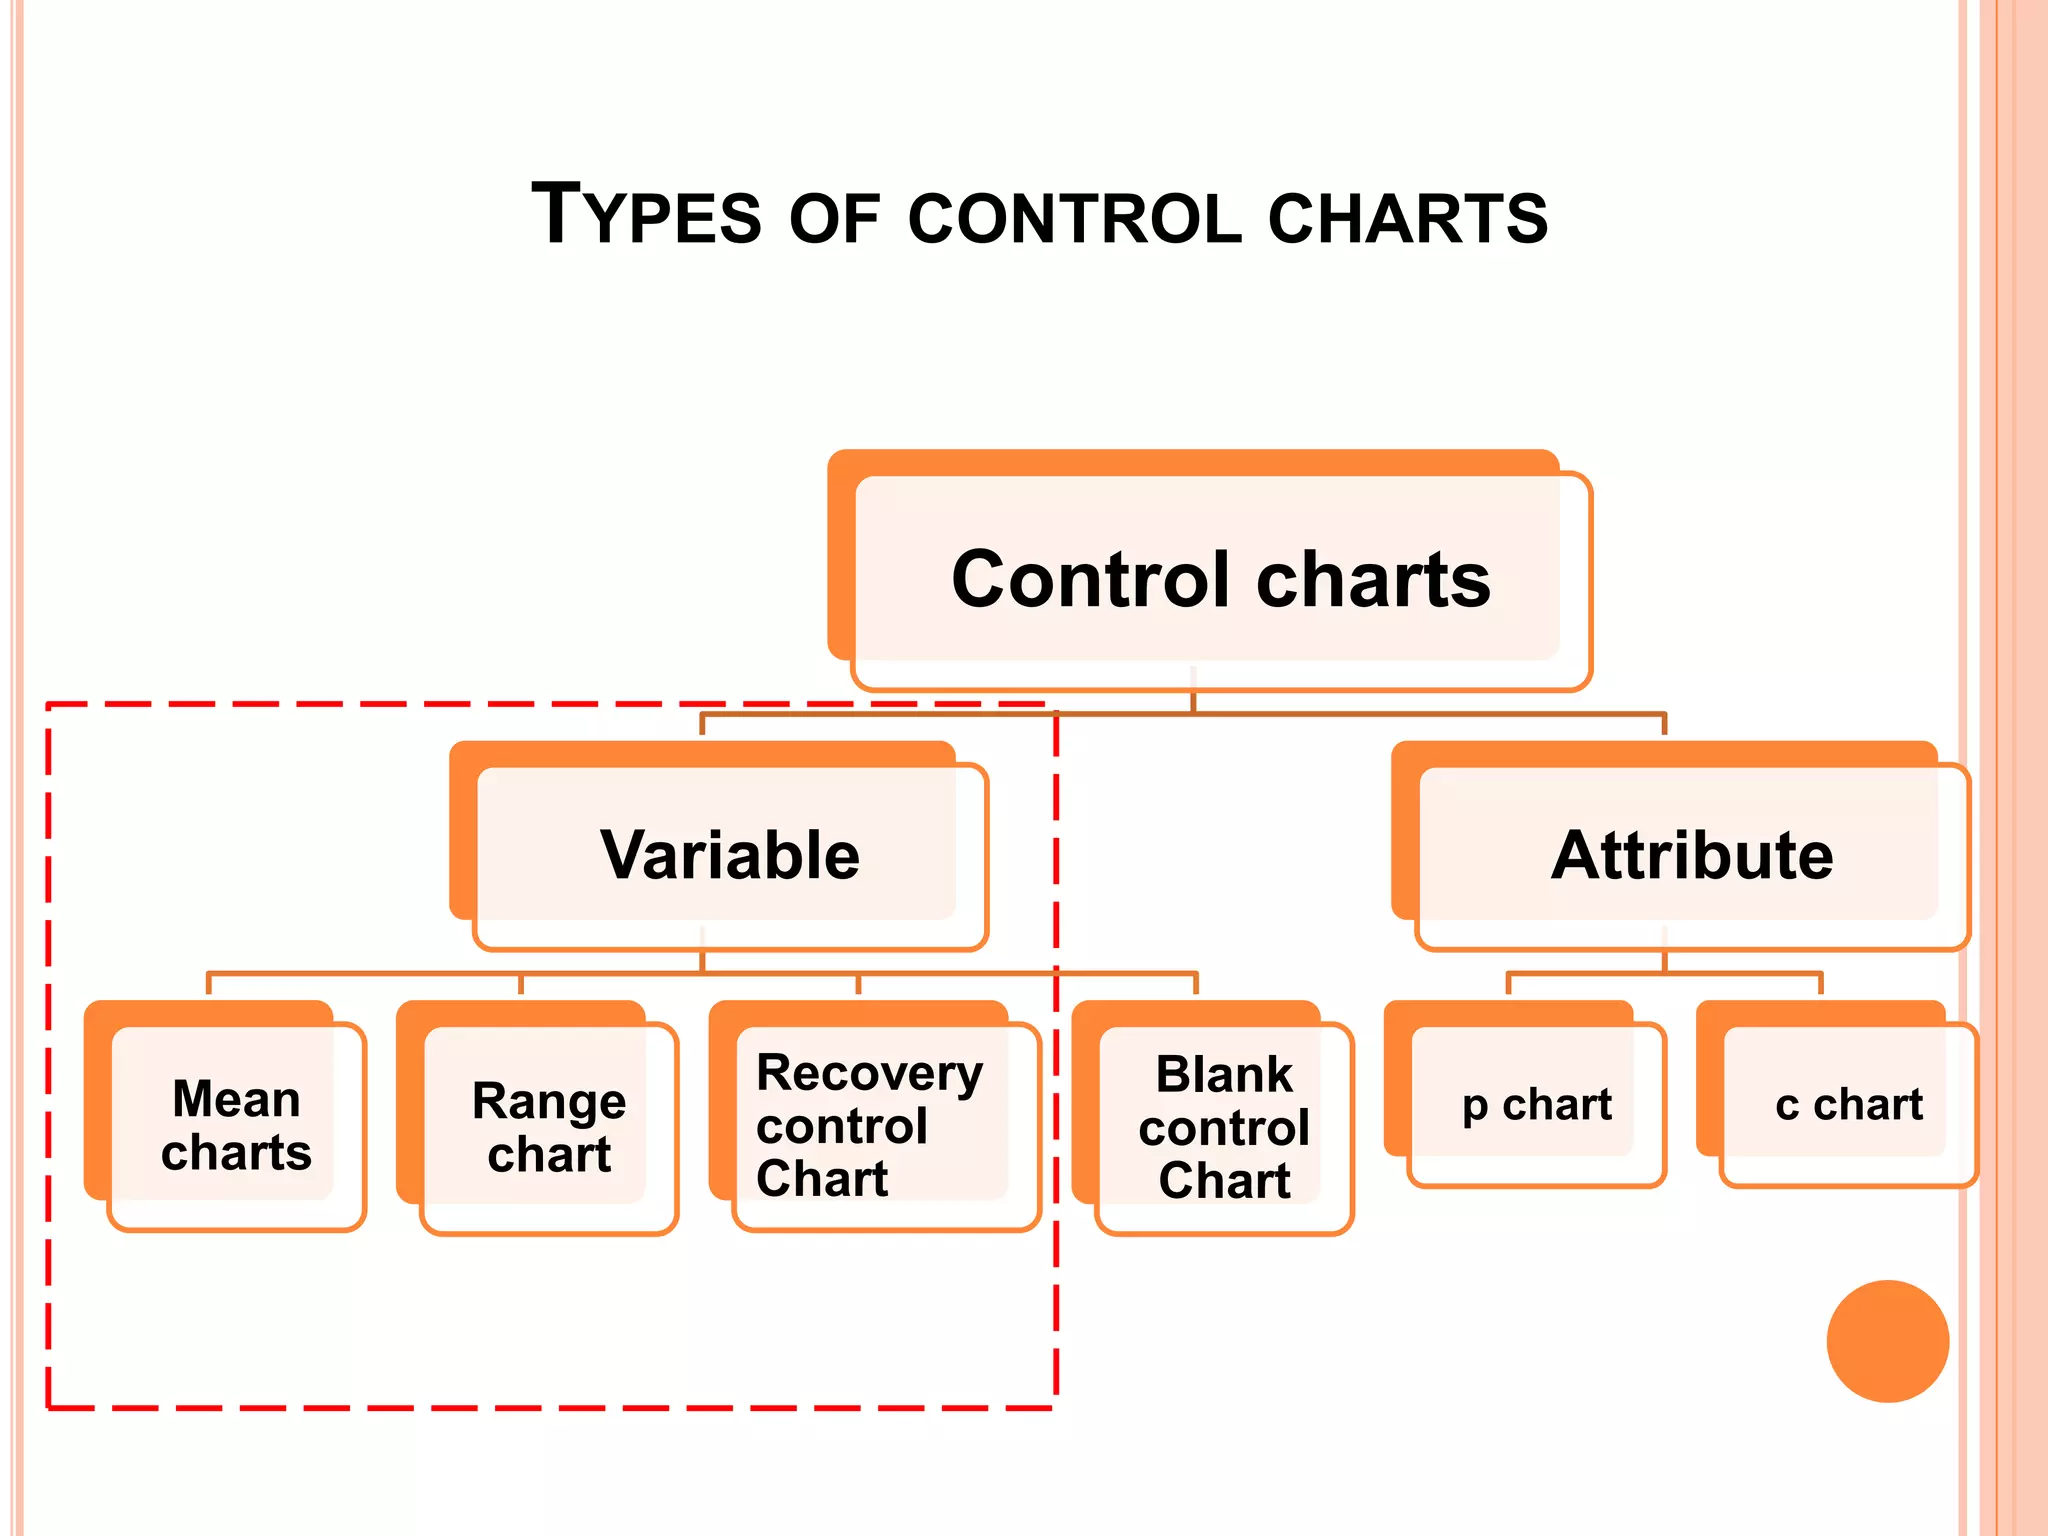
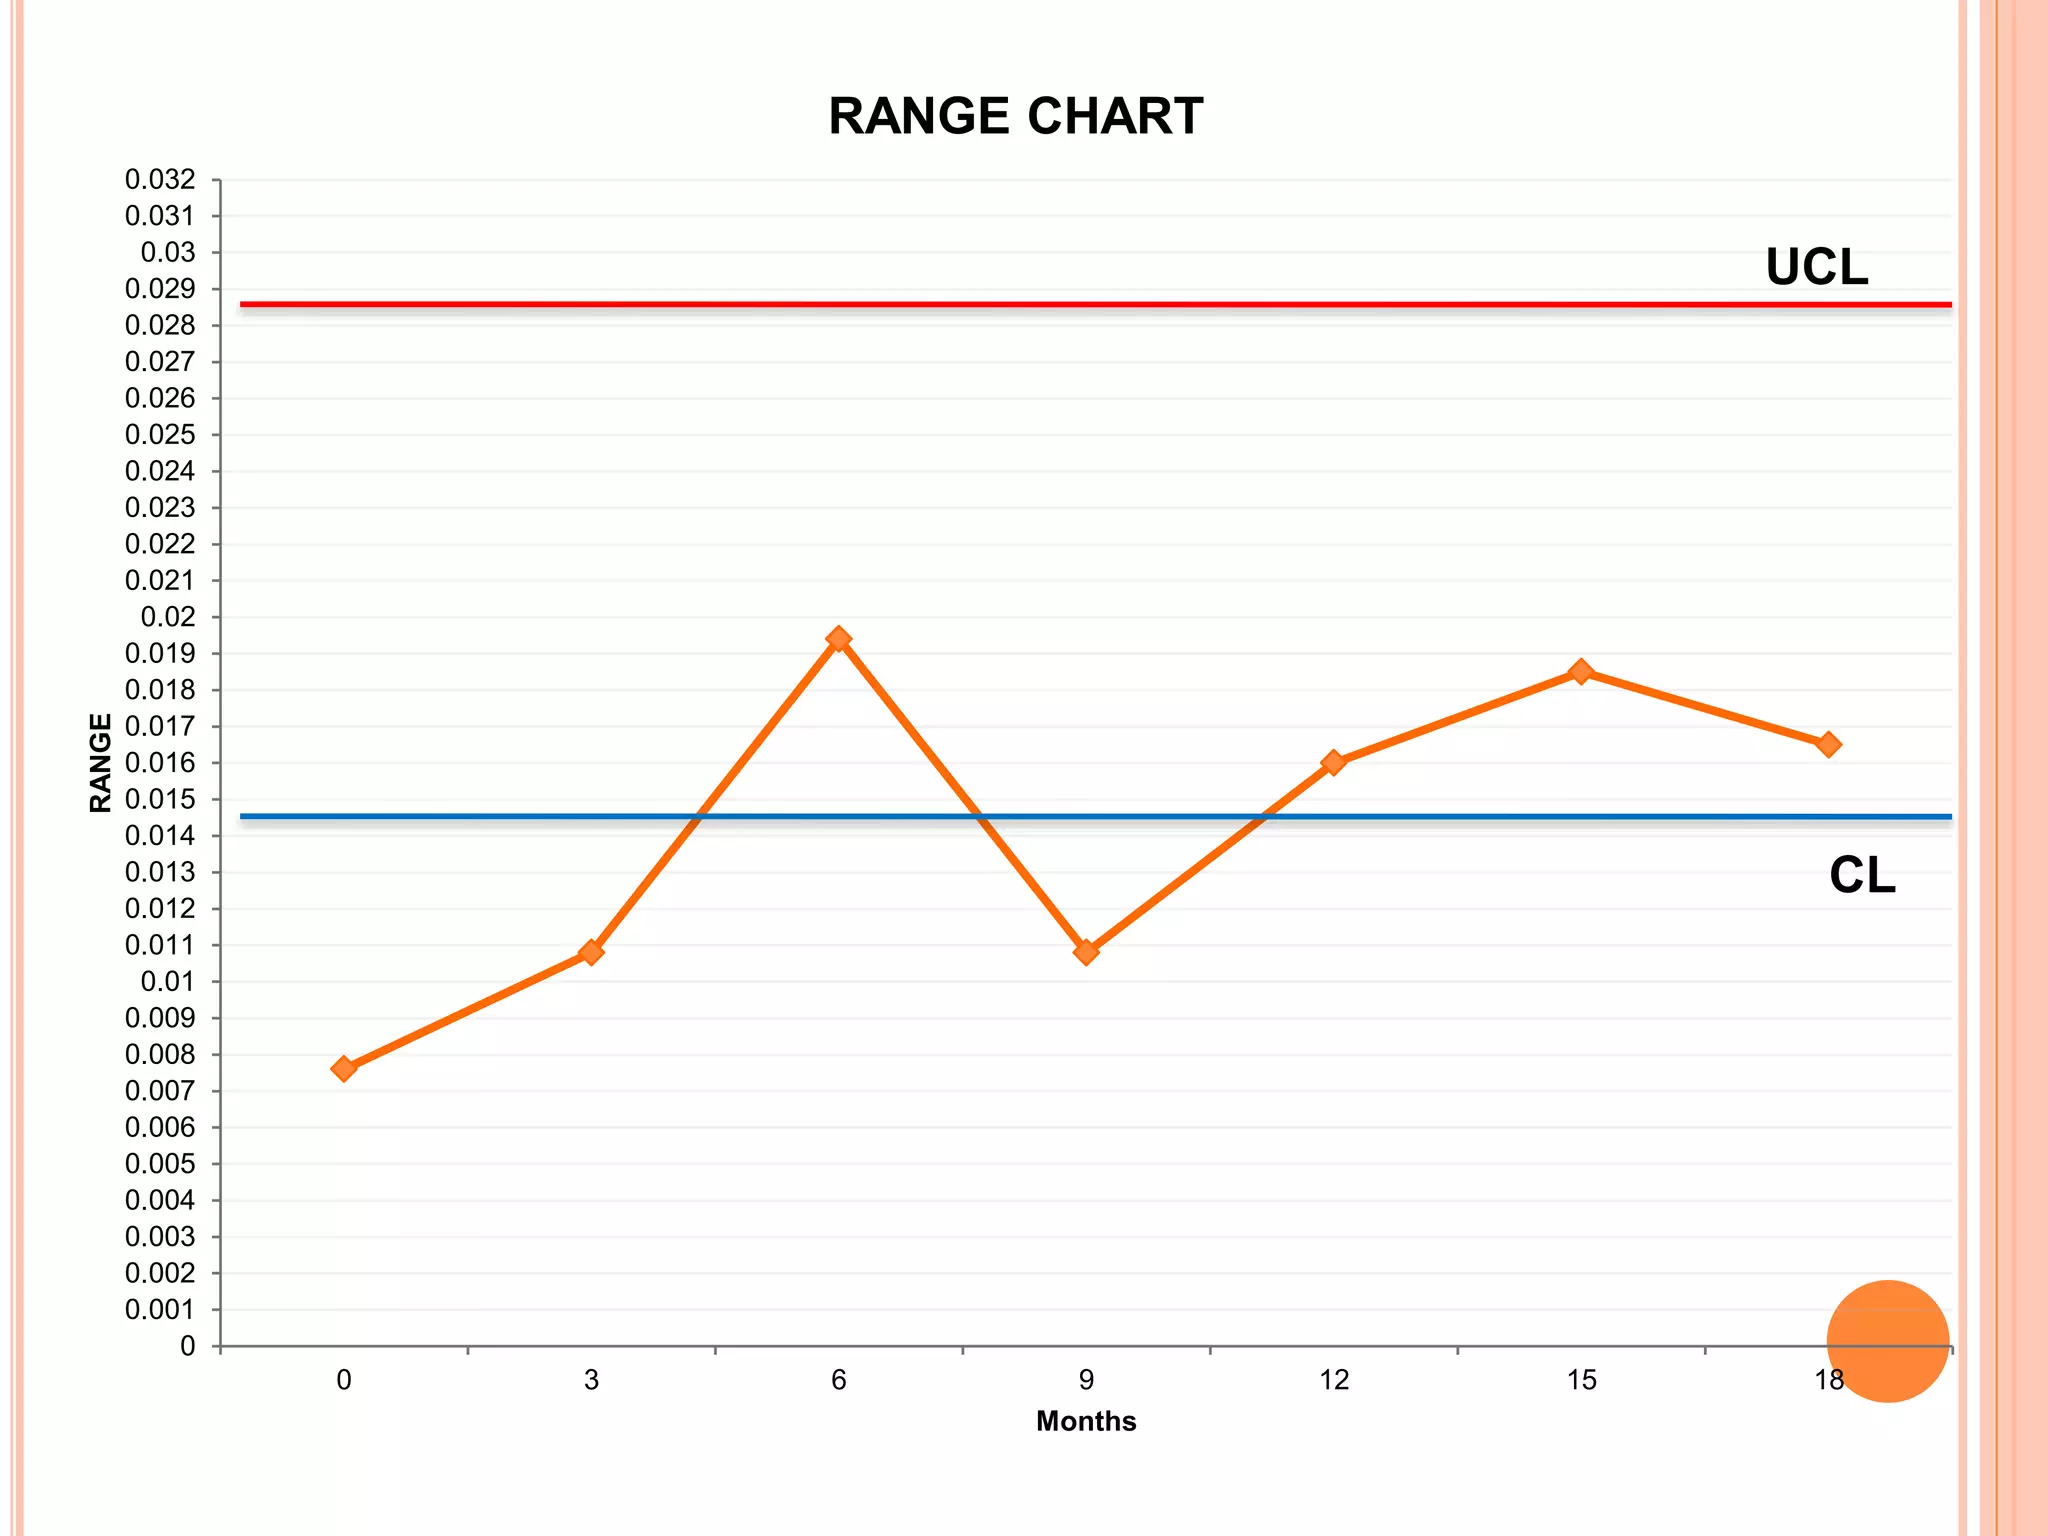
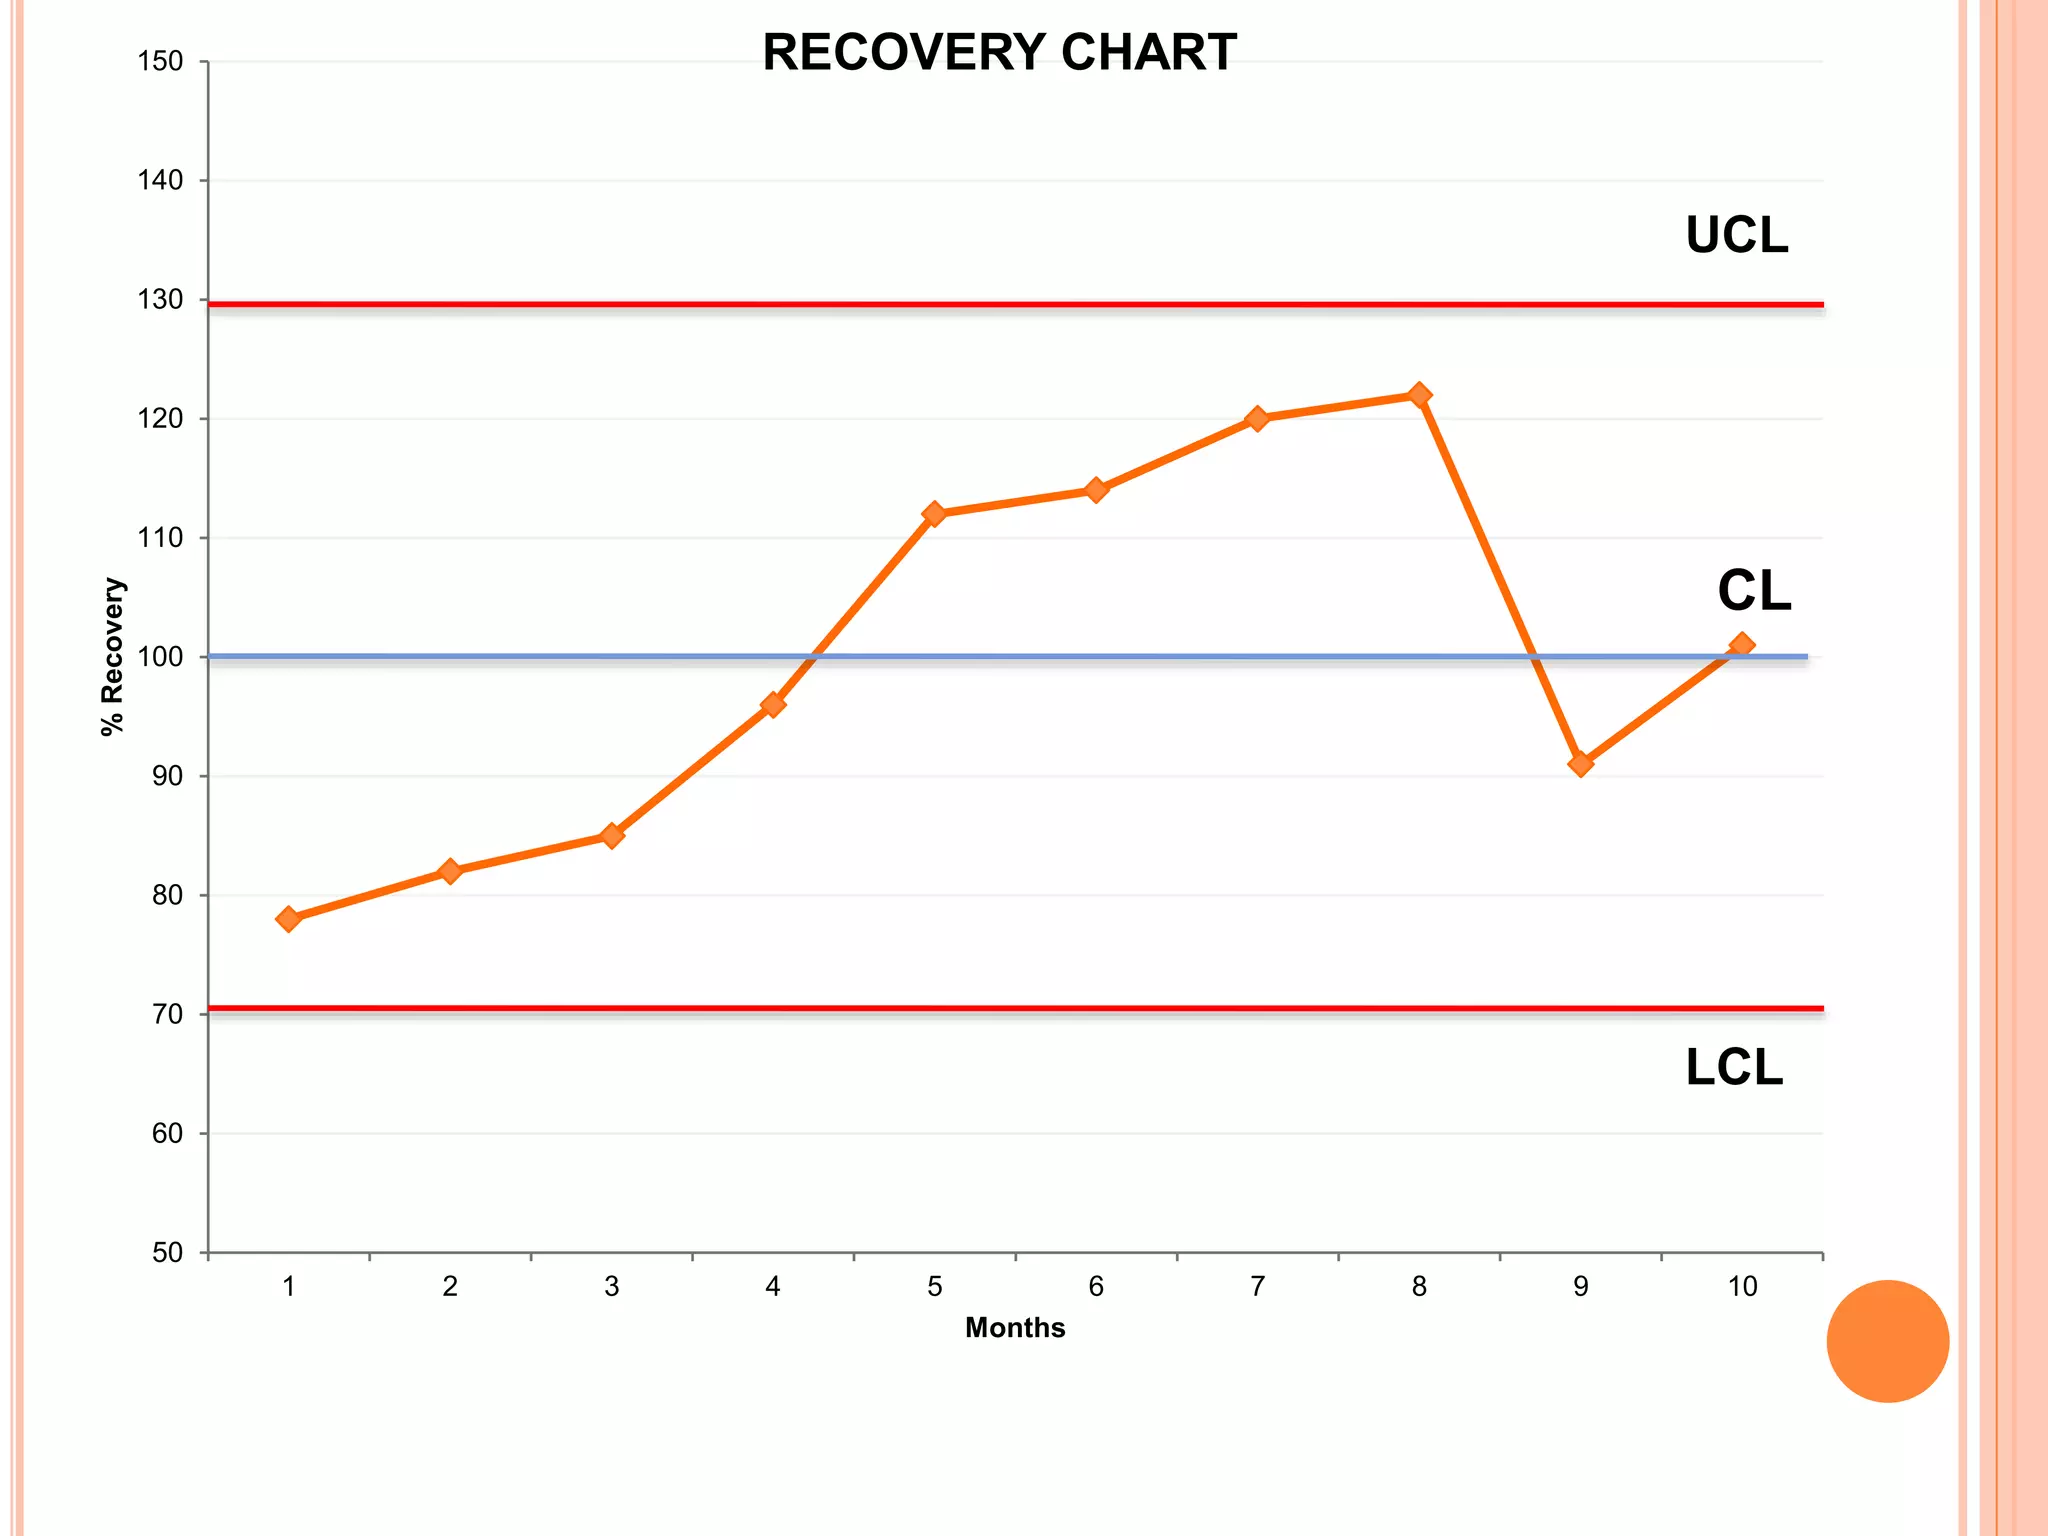
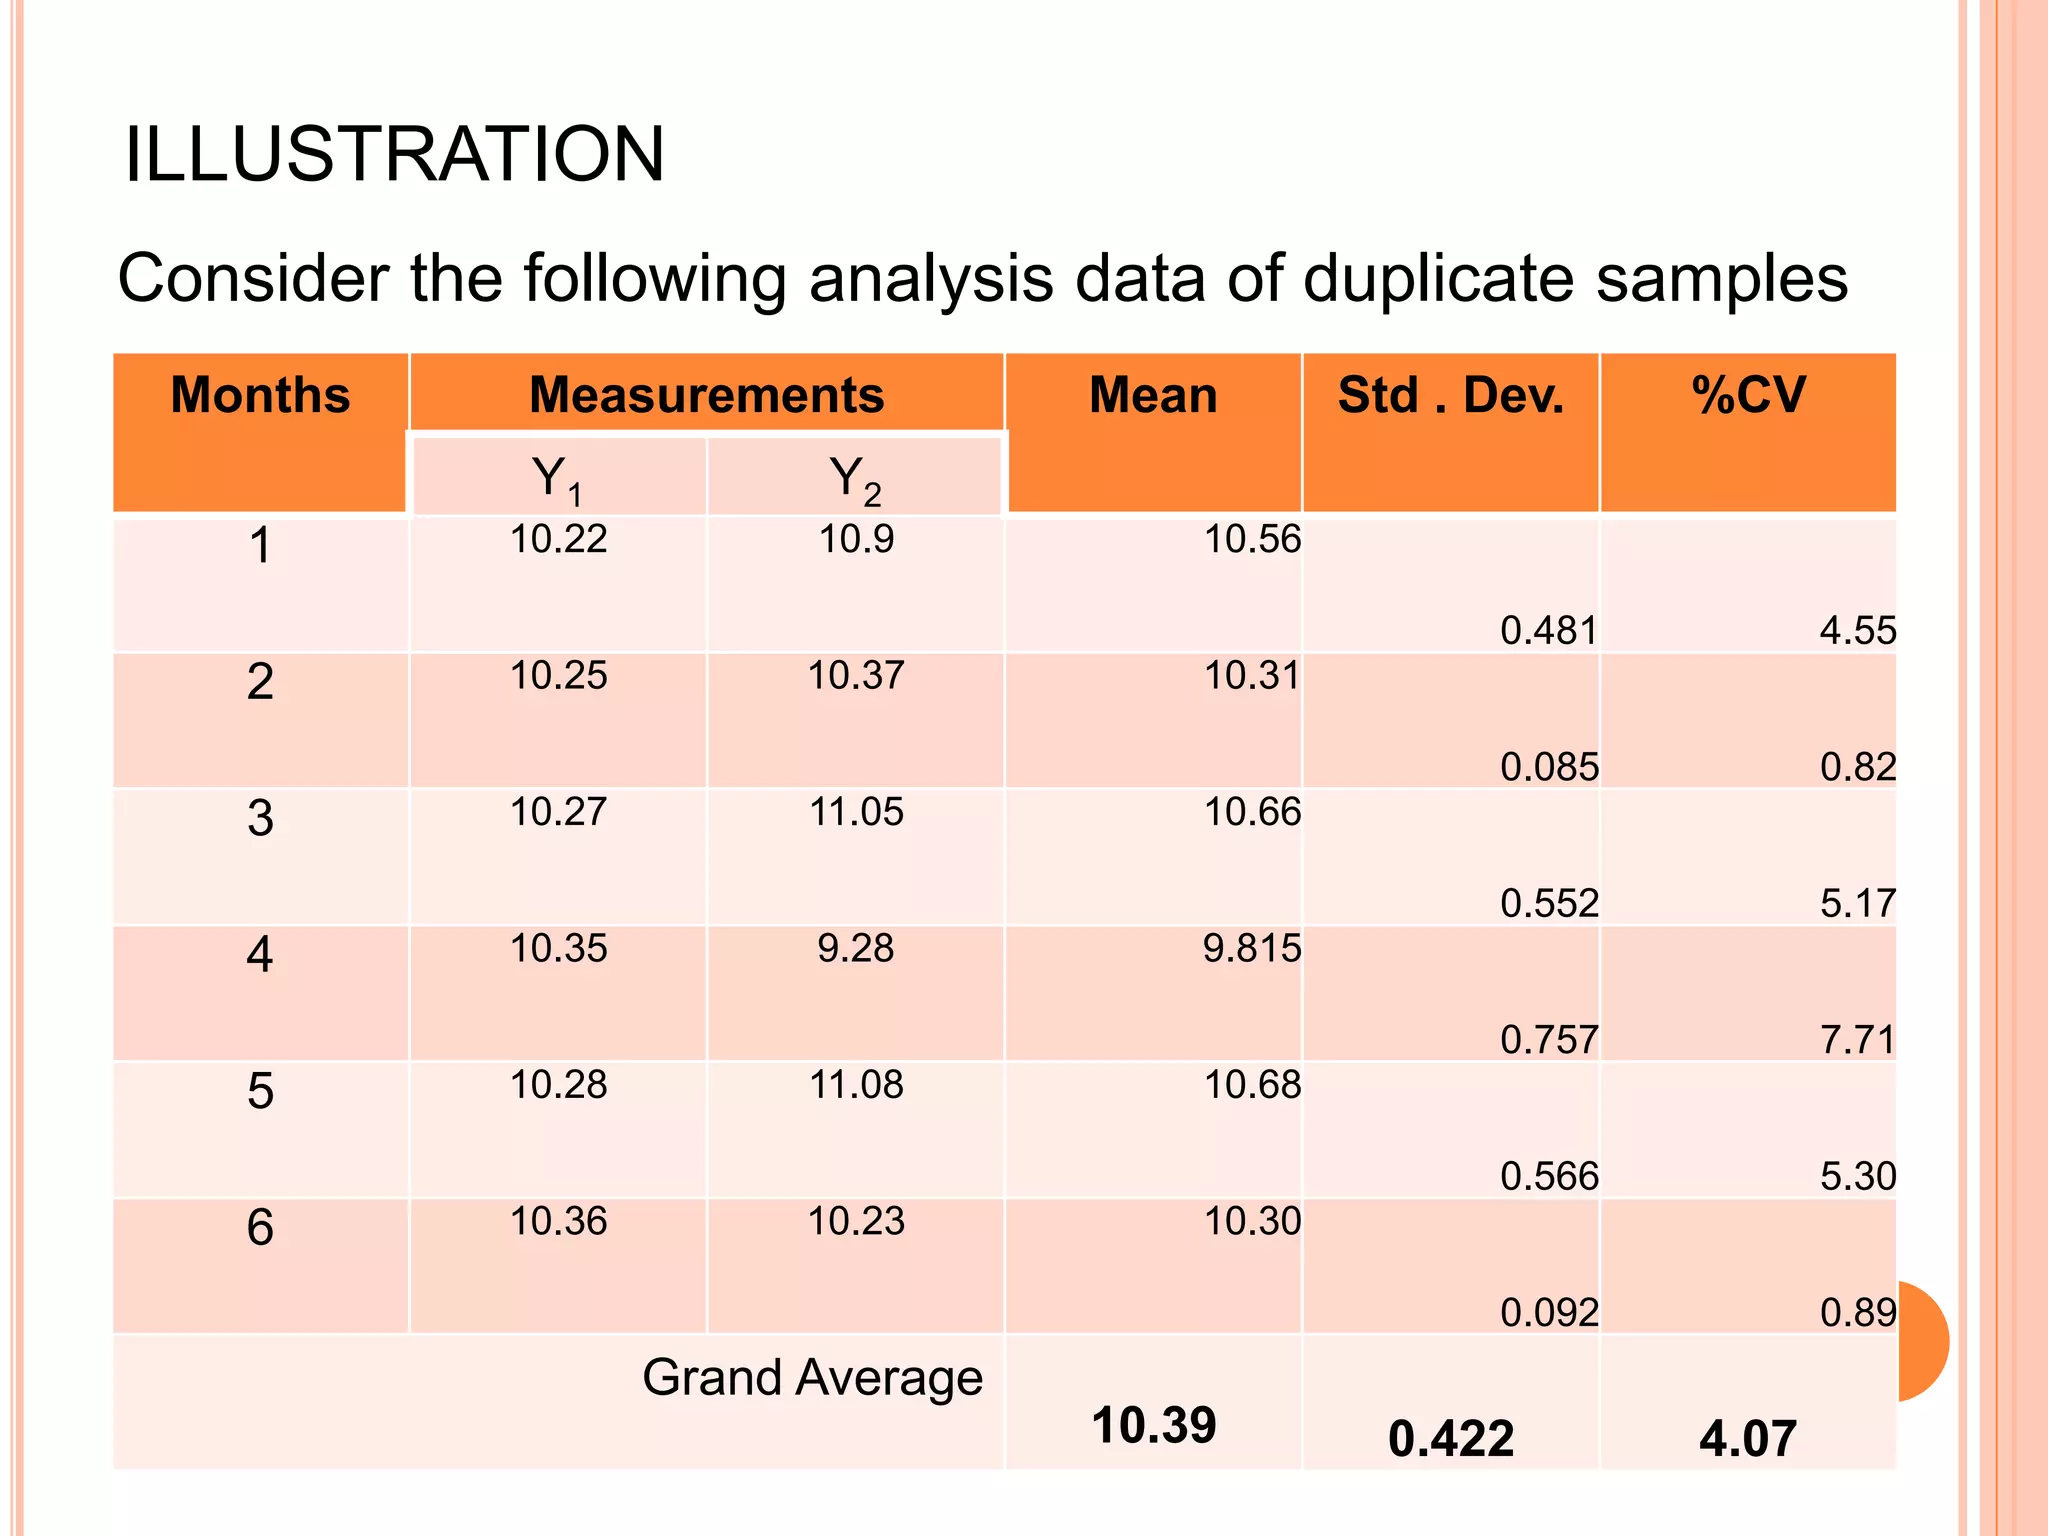
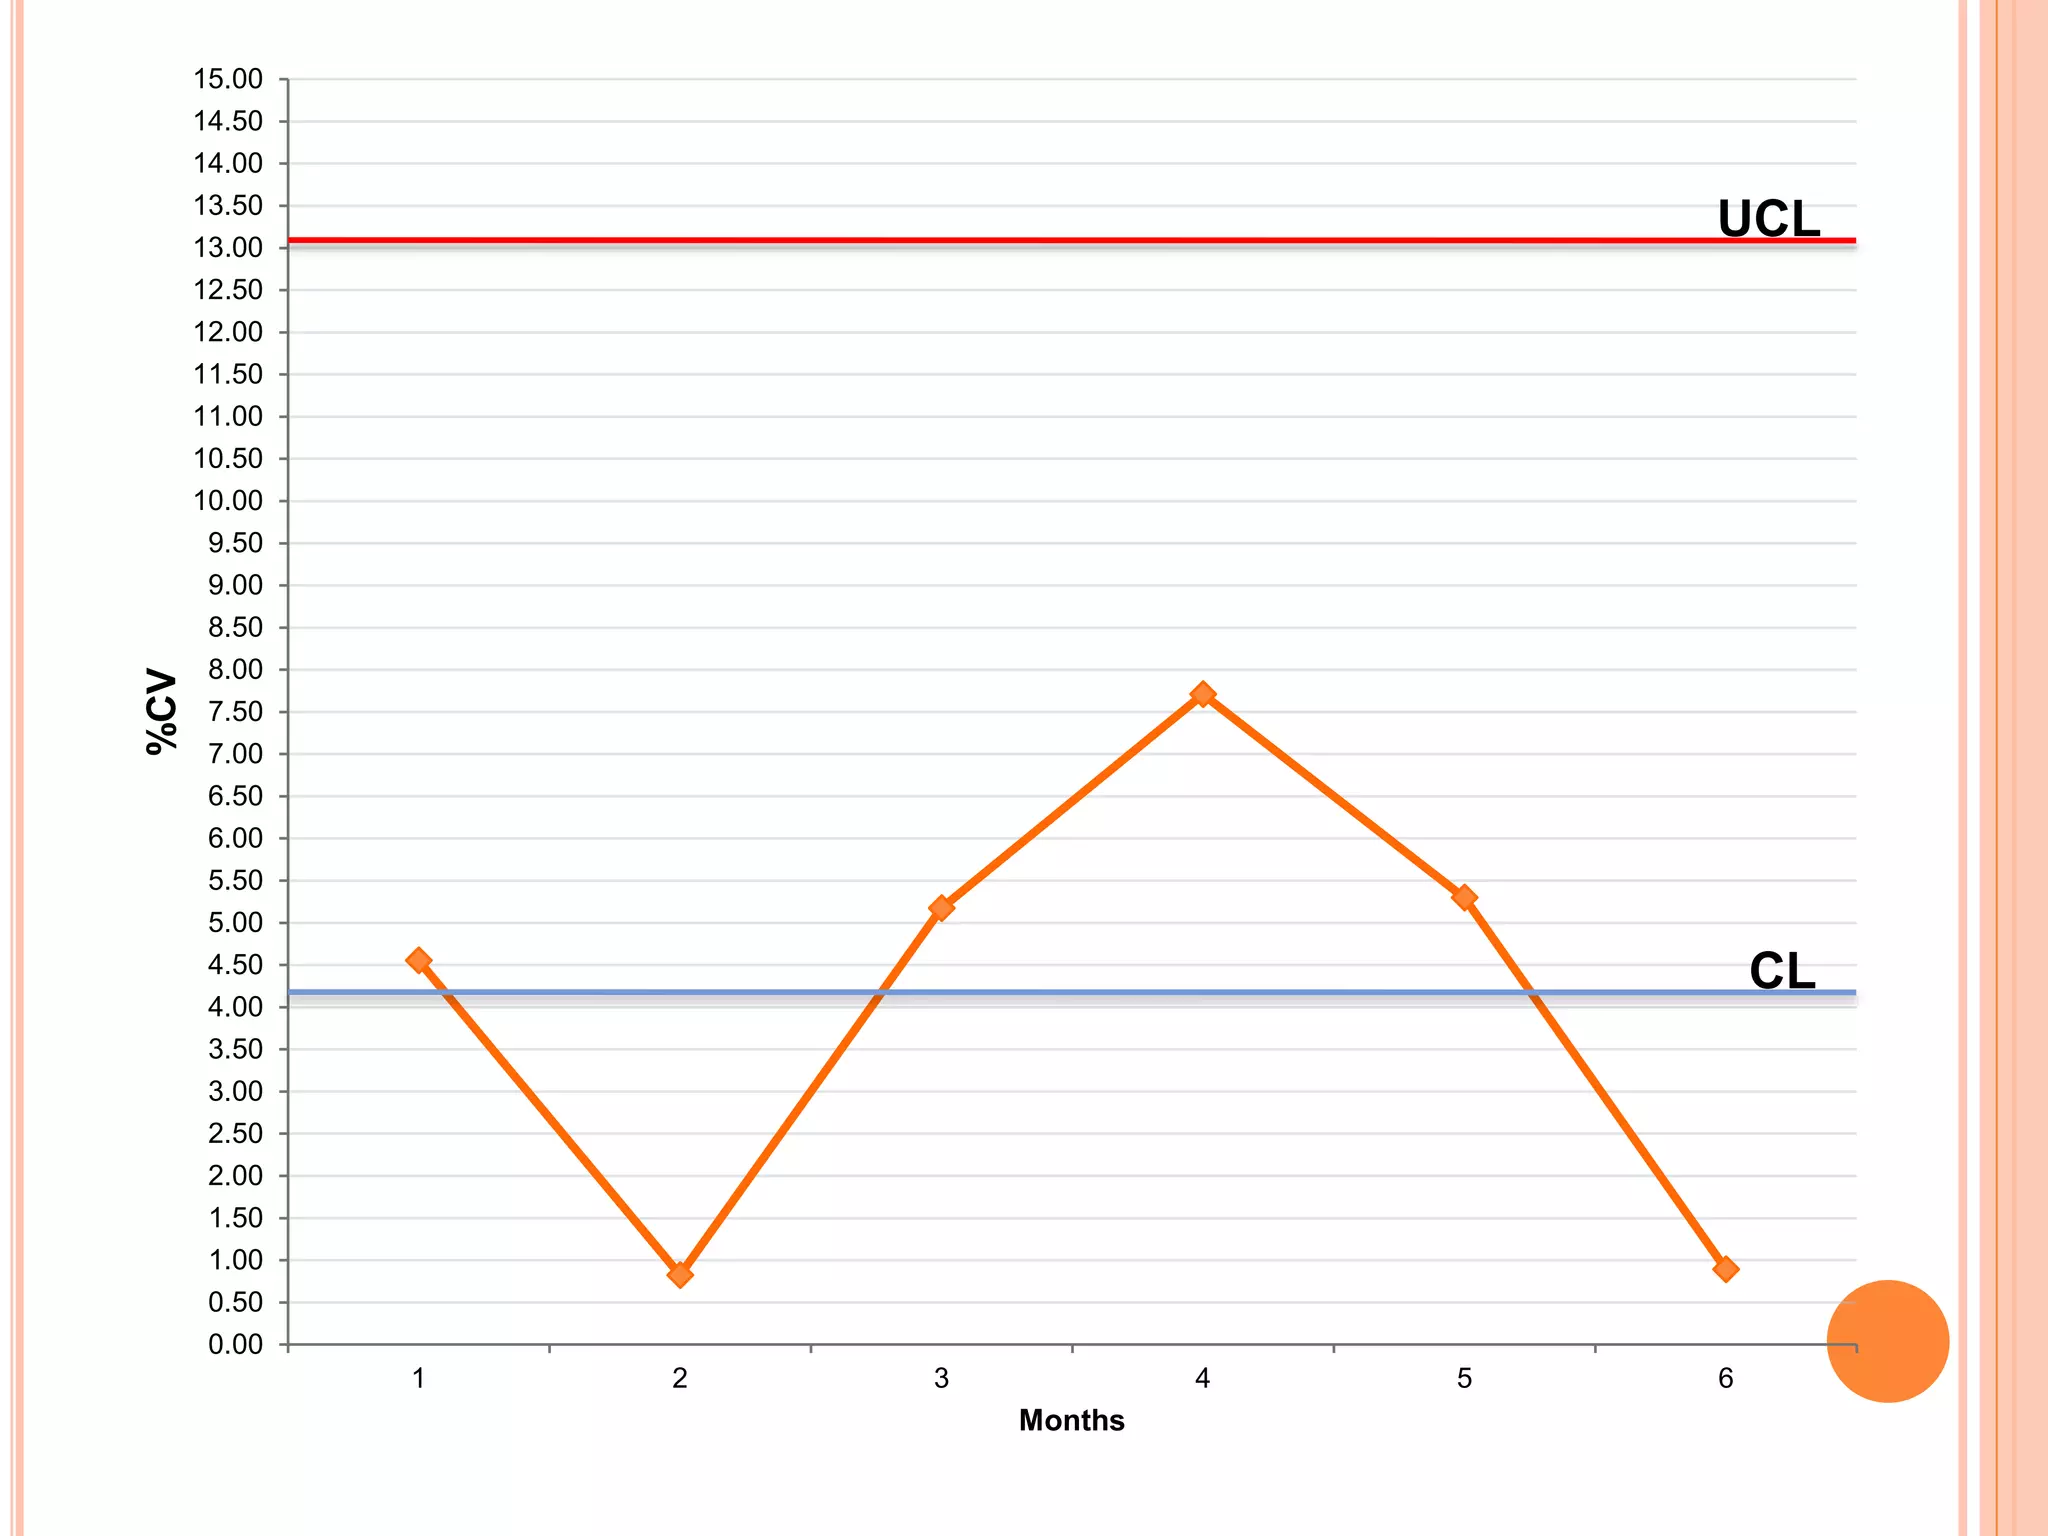
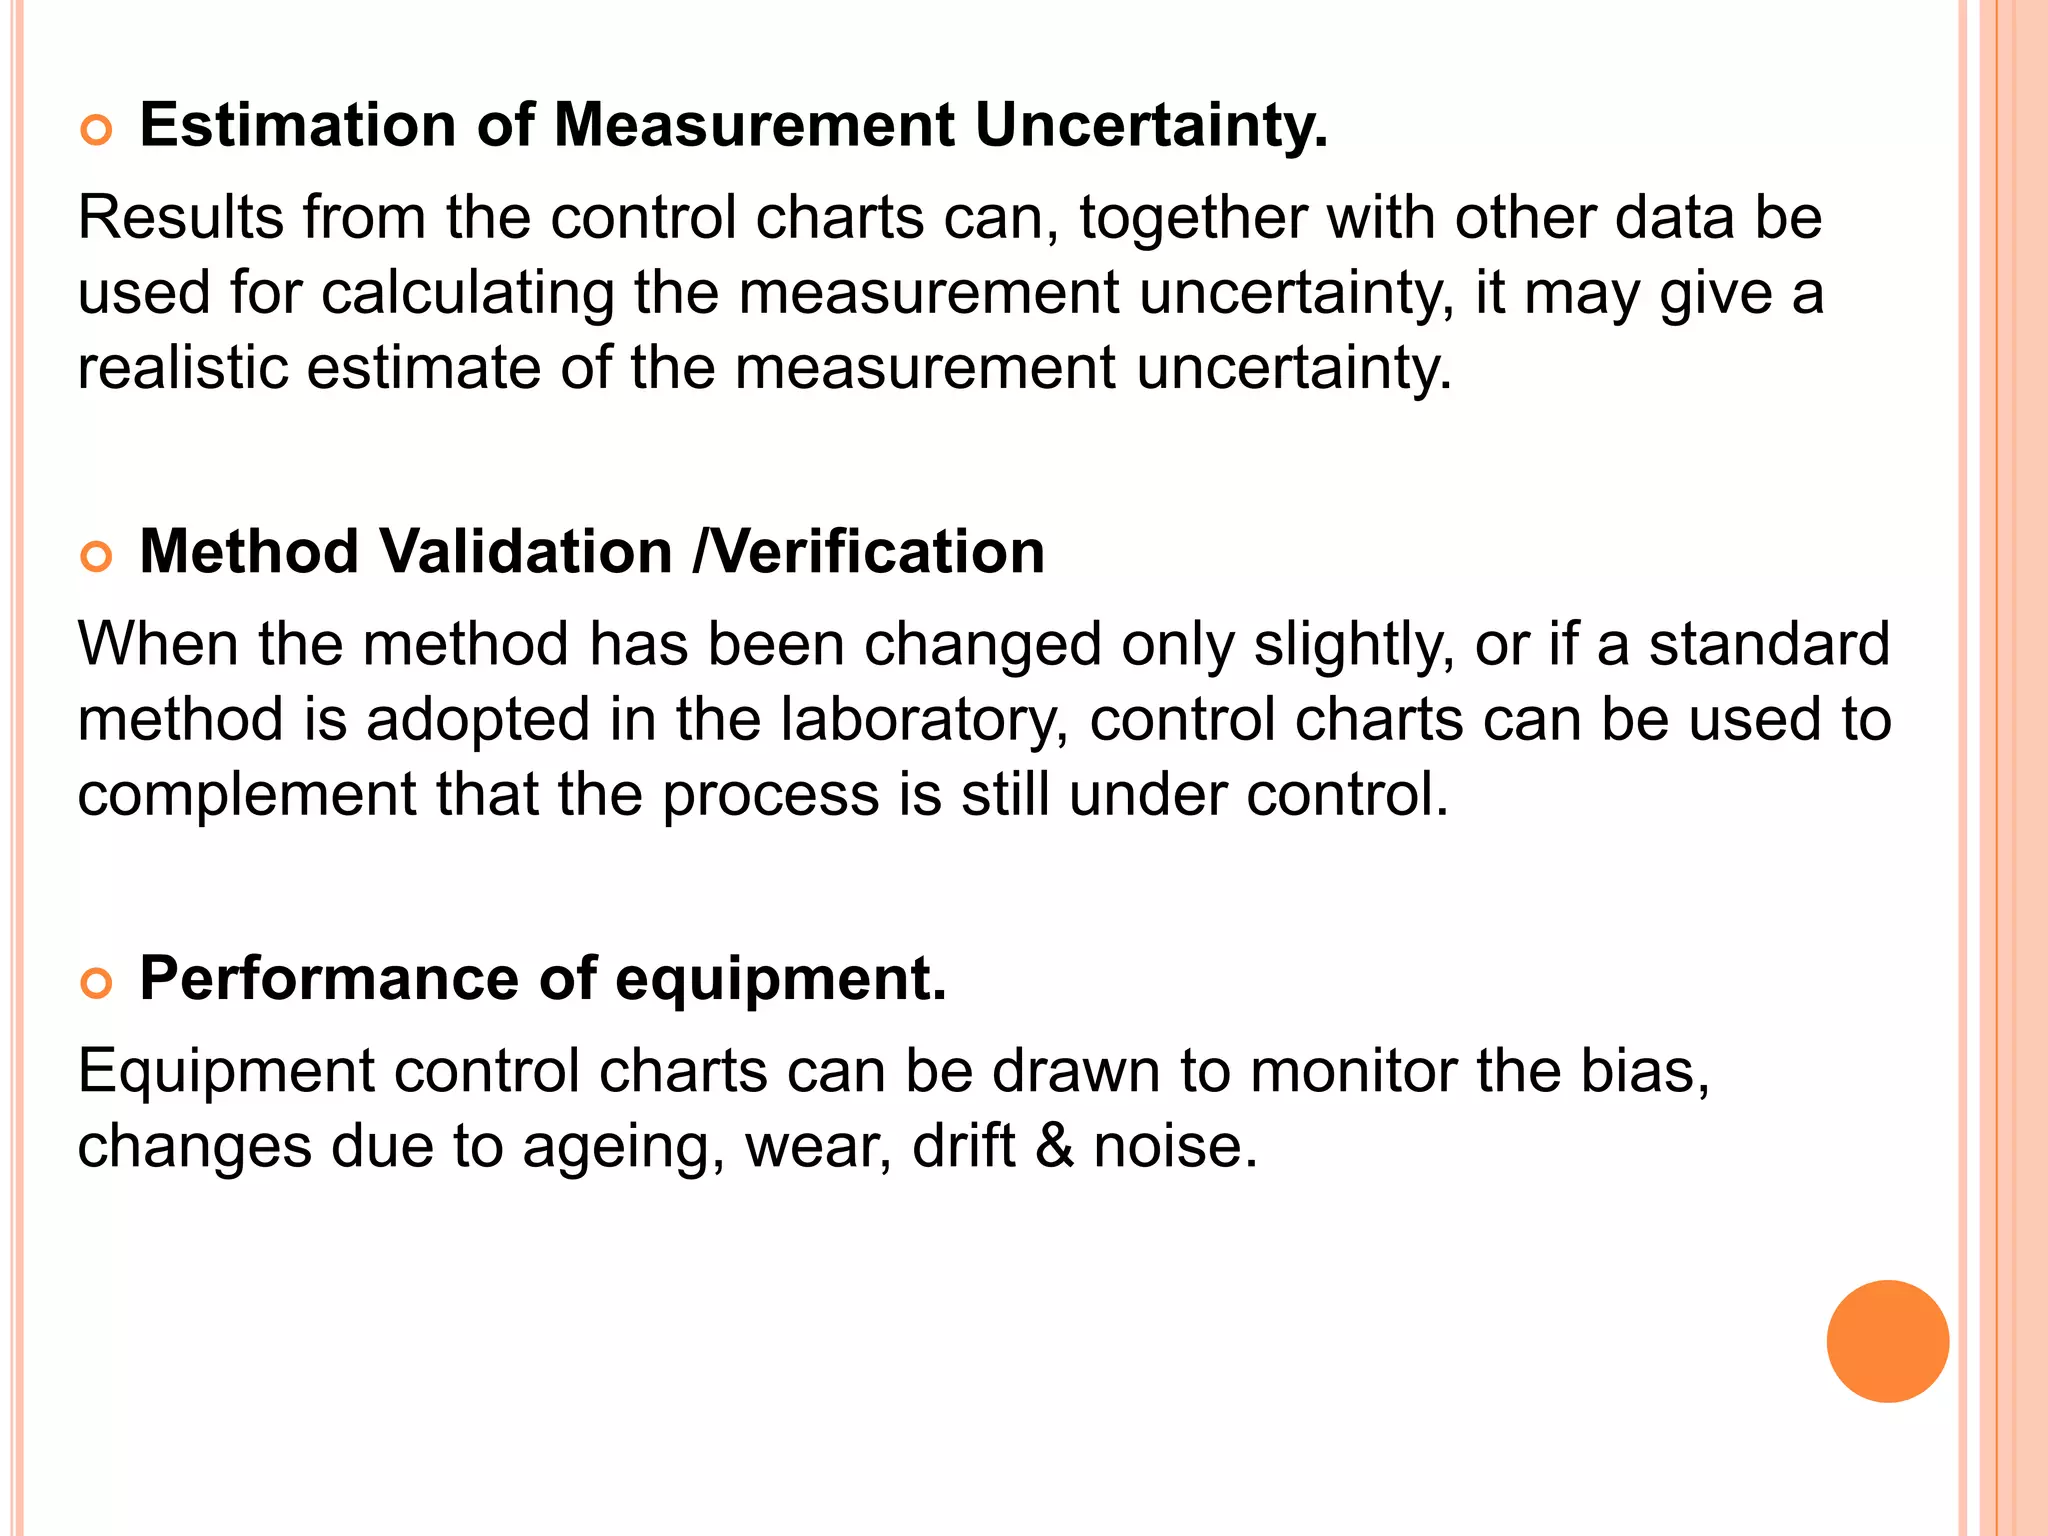
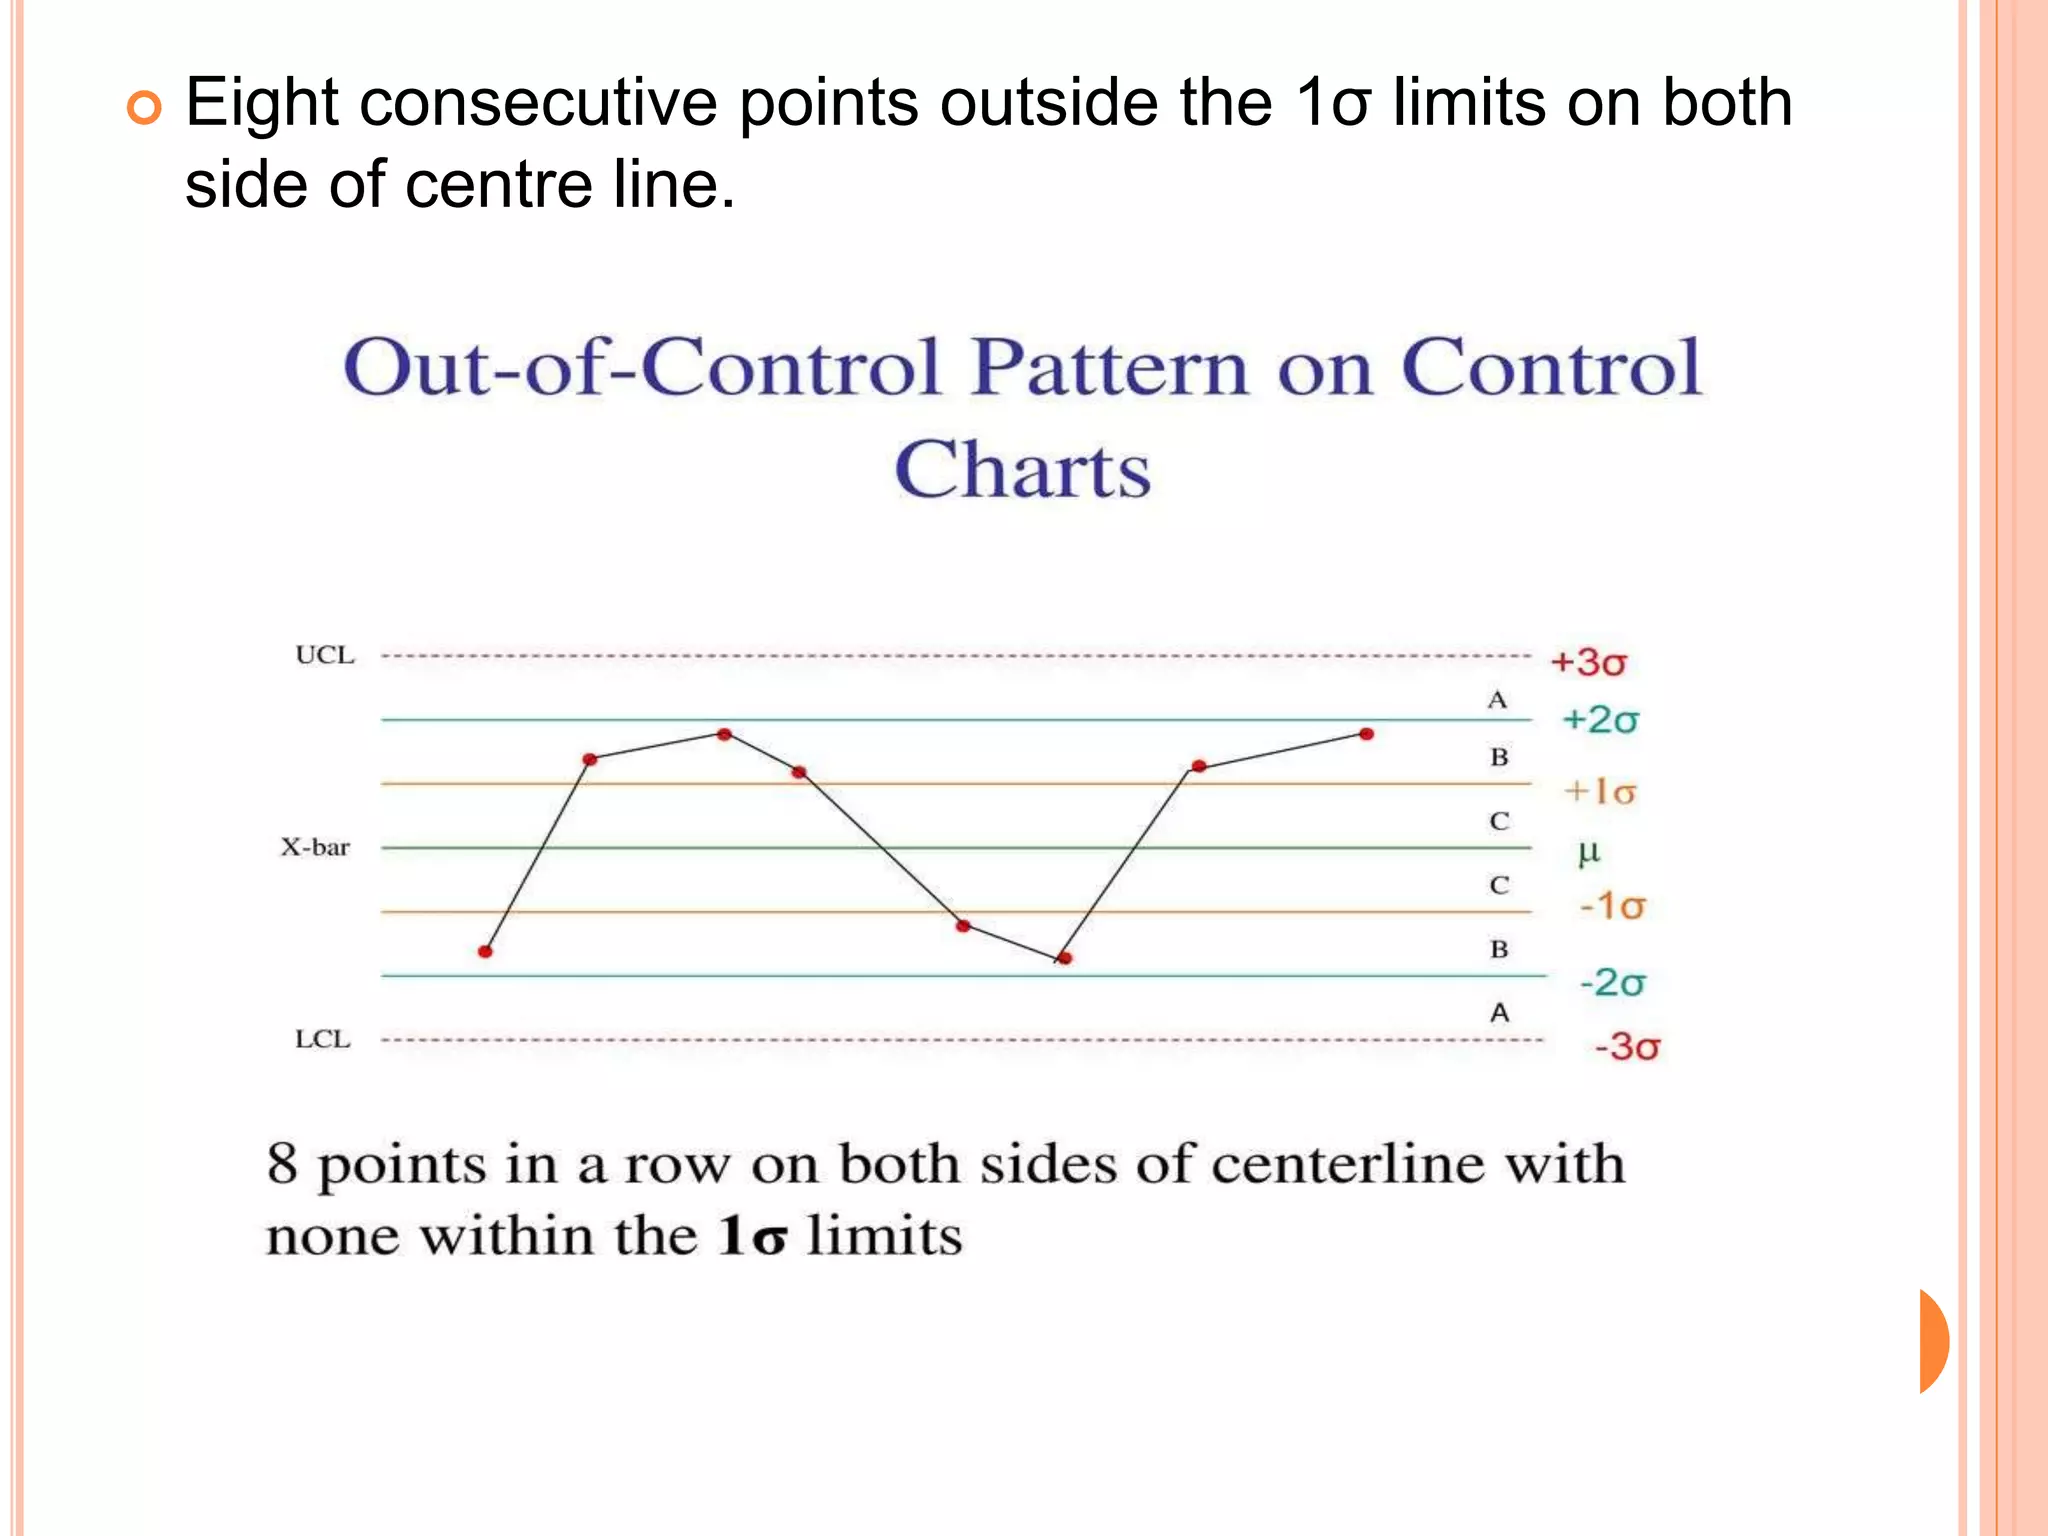
This document discusses the use of control charts in laboratories to monitor testing processes and ensure validity of test results. It provides examples of different types of control charts, including mean charts, range charts, recovery control charts, and duplicate sample charts. Control charts can be used to detect changes in testing processes, monitor equipment performance, compare testing methods, and evaluate different analysts. Trend analysis of control charts allows labs to determine if a process is in or out of statistical control. Control charts are a powerful tool for internal quality control in testing laboratories.