Download as PDF, PPTX

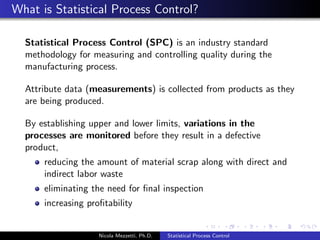
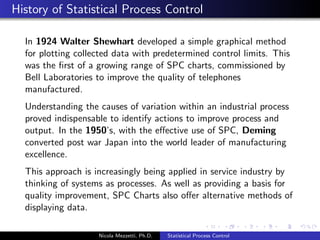

This document provides an overview of statistical process control (SPC). It discusses the history and development of SPC by Walter Shewhart in the 1920s. It describes how SPC uses control charts to monitor process variation and identify when processes are out of control. The document outlines different types of control charts and how they are interpreted. It also discusses key SPC concepts like process capability indices and the seven step process for implementing SPC.


