Downloaded 130 times

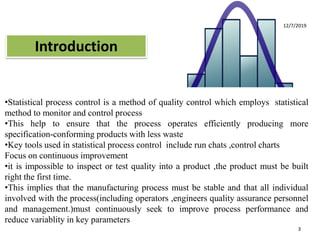

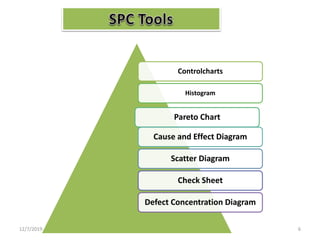


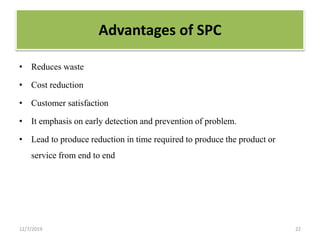


This document discusses statistical process control (SPC), which uses statistical methods to monitor and control processes to improve quality. SPC aims to ensure processes operate efficiently and produce specification-conforming products with less waste. Key SPC tools include control charts, histograms, cause-and-effect diagrams and check sheets. Control charts in particular plot process data over time to identify changes or variability. SPC provides benefits like reduced waste, lower costs, improved customer satisfaction and early problem detection and prevention.